
Key takeaways
ICT’s Top Down Trade Review September 01, 2024 explains his Nasdaq analysis for August 30, moving from weekly context to daily levels, then 15-minute, five-minute and one-minute charts.
Read the full summary
ICT’s Top Down Trade Review September 01, 2024 explains his Nasdaq analysis for August 30, moving from weekly context to daily levels, then 15-minute, five-minute and one-minute charts. The main references are a weekly wick midpoint reported as 19,440.50, Tuesday’s daily low at 19,441.50 and a 15-minute order-block opening price at 19,466.75. He compares settlement and last-price daily charts, carries higher-timeframe levels down to intraday charts, and describes five afternoon timing windows. The useful lesson is how those references fit together, not a verified trading edge. This is a transcript-based review; the creator labels displayed performance hypothetical, and the reported prices and executions are not independently verified here.
How we researched this article
BestProps used document-based research from primary firm sources, checked September 19, 2026. The complete source list, scope, limitations, and commercial-state record appear near the end of this article.
What the ICT Trade Review Covers
The recording opens with ICT explaining that it reviews the video of the Friday session he had already published in two versions, a condensed one of roughly eight minutes and the full recording of the afternoon in real time, so that students can compare what he says here with the 15-second and one-minute charts. He describes this file as the top-down explanation of his pre-trade analysis, intended to go with the longer trade recording rather than replace it (0:10, 1:03).
This is independent commentary, not an official ICT publication or proof that the method produces consistent results. The creator’s video description states that displayed trading performance is hypothetical and warns about hindsight and execution limits. The recap uses the timestamped transcript, which can contain errors; it does not independently verify the original audio, chart prices, fills or account statements.
ICT Trade Review Weekly Context
He begins on the weekly chart (3:37) and says his higher-timeframe expectation had been for price to move higher. Within that outlook he works with two references: the upper half of a previous weekly wick, and the opening price of a down-close weekly candle, which he draws as a line and treats as an order block. He says the earlier week had traded down to that opening price and to the low of the wick, and that a move back into that area should be brief and rejected rather than accepted as a new range to trade inside.
Rather than requiring an imbalance to be filled in full, he says context decides which part of a range matters. At 10:00 he marks half of that wick and gives that price as 19,440.50, saying trade can go below it but then needs to show immediate rejection and work back toward the upper half of the wick. Earlier, at 9:19, he uses his informal word for price that overshoots a boundary only slightly, which he calls a “mohawk”, a small extension past the level rather than a run away from it. The price is his reported annotation, not an independently checked market-data value.
ICT Trade Review Daily Levels and Old Lows
On the daily chart (12:32) he says he wants to do the bulk of his trading back inside the weekly order-block area, and that a brief test of it followed by a recovery supports his working premise of higher prices and a preference for buy setups while still allowing short-term moves either way.
A large part of this section is mechanical. From about 15:33 he answers a recurring student question about why some daily charts show settlement prices and others do not: he points out that his own daily chart currently displays the blue “SET” label, meaning settlement prices are being used as the daily close, and he says students should look at both versions. His stated rule is to keep whichever view reveals a separation between the bodies of adjacent candles, because that separation is what he calls a volume imbalance and records as a reference point. TradingView’s documentation describes the same switch: the settlement-versus-last-price choice applies to daily bars and higher timeframes, while intraday data is unchanged either way.
He then says to look back at the highs and lows of the previous three daily candles. For the Friday session under review, that means Thursday, Wednesday and Tuesday (19:16). He highlights Tuesday’s low at 19,441.50 (18:56) and explains that when the previous day’s settled low and the older Tuesday low are both available, he judges the older level the more significant of the two. He also marks a high of 19,447.50 on the candle that defines what he calls a buy-side imbalance, sell-side inefficiency, and notes that Tuesday’s low sits below it, which is why he focuses on the daily low rather than that imbalance (24:14). His reasoning that old highs and lows hold resting liquidity, and that price is drawn to them, is his market interpretation; the recording does not independently establish that mechanism.
While on the daily chart he also labels a candle a propulsion block (an up-close candle whose opening price he keeps as a level once price trades below it and fails to close back above the midpoint of the next higher block) and points students to the month-four material in his 2016 mentorship playlist for that vocabulary (25:48).
ICT Daily Chart Map
- The upper half of a prior weekly wick as the broad working area, with 19,440.50 given as its midpoint.
- The opening price of a down-close weekly candle, treated as an order-block level.
- Daily volume imbalances, compared with settlement prices displayed and hidden.
- The previous three daily highs and lows, with Tuesday’s 19,441.50 low treated as the more significant.
- A daily buy-side imbalance, sell-side inefficiency whose high he puts at 19,447.50.
- Newly formed daily structures, including the candle he labels a propulsion block, added as the week developed.
ICT Trade Setup on Lower Timeframes
28:20 marks the move down to the 15-minute chart, where he says the levels had been annotated before he sat down to the session. He describes the Friday afternoon idea at 28:39 as a bullish “Turtle Soup” setup: he was trading the PM session from two o’clock and wanted to see whether price could rally up into a bearish order block. In the same passage he notes that the long US Labor Day weekend would affect volume and the times he trades, and that he expected the price action to be less orderly as a result.
Within that 15-minute sequence he highlights a move below an earlier low that then recovered, and says he is keying off the midpoint of that wick, which he calls consequent encroachment, rather than the wick’s outer boundary (31:38). He frames the nearby candles as buy-side imbalance, sell-side inefficiency structure and describes price trading into the consequent encroachment while leaving the lower portion of the gap open (33:19).
He then identifies a bullish order block and gives its opening price as 19,466.75, the opening of a down-close candle that was overtaken on the way up (34:14). He states that the low of the 2:15 p.m. candle of Friday, August 30, 2024 matched that opening price and describes the rally that followed from it (34:33). These are his narrated figures and candle identification. They do not establish that the marked level caused the subsequent move.
Above that, he describes price moving into another imbalance which, because his working bias was bullish, he expected to be used as an inversion rather than as a shorting area: a sell-side imbalance, buy-side inefficiency he wants to see act as a bullish discount array (35:26). The pattern he keeps returning to is that pullbacks into fair value gaps, wick midpoints and bullish order blocks were treated as successive footholds toward the higher-timeframe objectives, and that a bullish reading does not require every discount array to be filled completely before price leaves.
ICT Trade Refinement on Five-Minute and One-Minute Charts
He moves to the five-minute chart at 40:49 and shows the same levels being reused, including a small excursion beyond the upper portion of the 15-minute imbalance that he says was simply price digging into a five-minute order block rather than invalidating the idea.
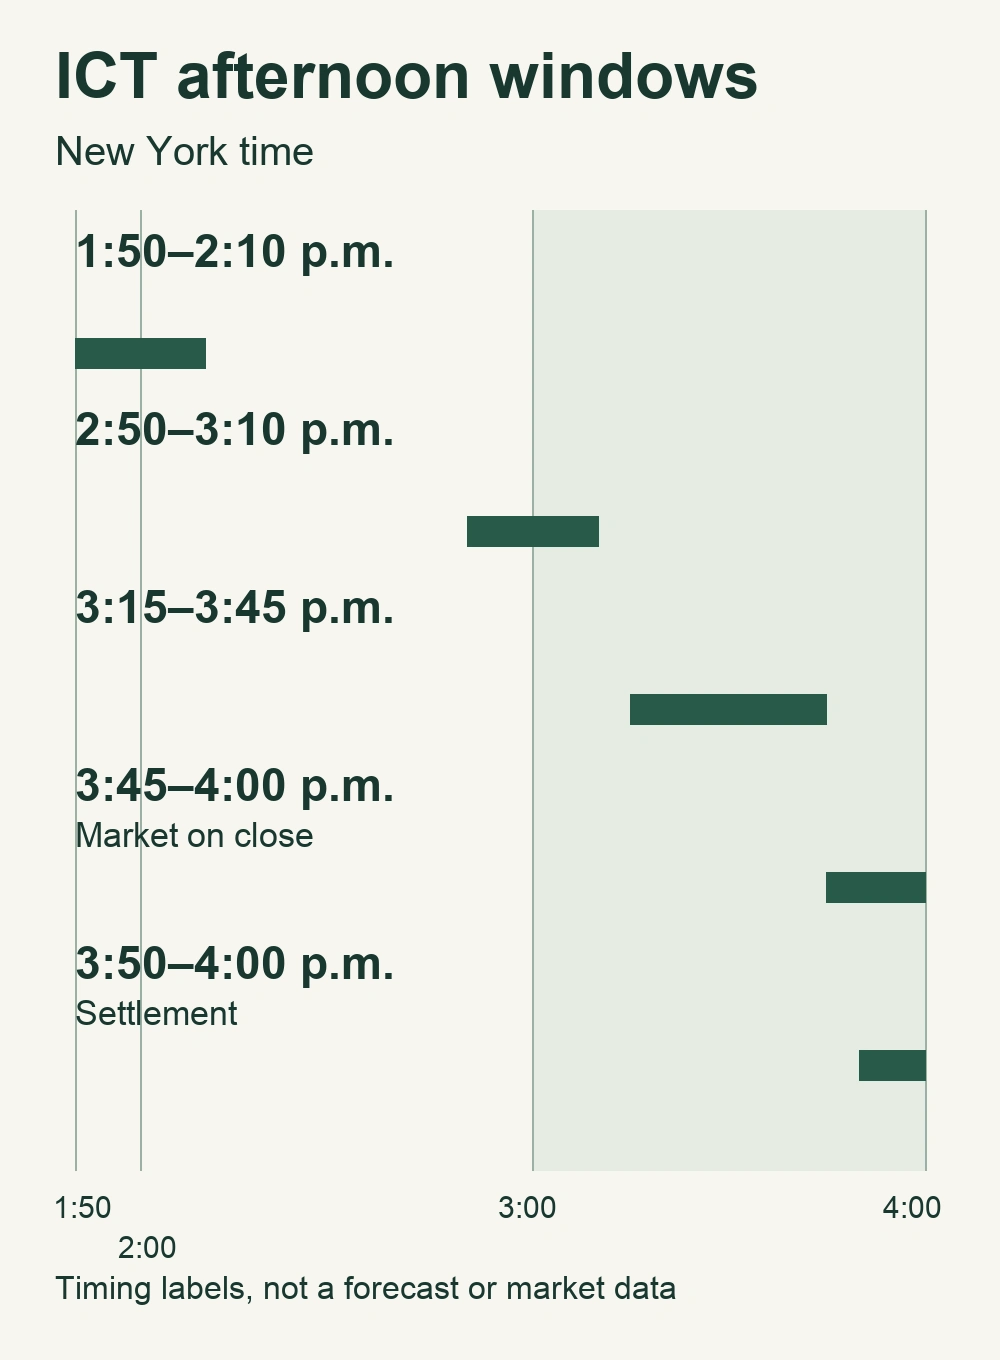
At 47:20 he corrects a label on his own slide: the final chart is one minute, not five minutes. On that chart he lists the intraday windows he calls macros. These use the review’s New York session clock, not video elapsed time:
- 1:50–2:10 p.m., which he says covers the buying shown on the one-minute chart (47:36).
- 2:50–3:10 p.m., a period he describes as one where the market spools and runs for liquidity (48:32).
- 3:15–3:45 p.m., during which he says price dropped back into a 15-minute bullish order block (49:24).
- The market-on-close macro, 3:45–4:00 p.m. (49:33).
- The settlement macro, which he defines as the last ten minutes, 3:50–4:00 p.m. (49:41).
Two of those five windows begin before 3:00 p.m., so they are not all inside the final hour even though he presents them together as the timing labels students ask about for the last hour of the session (49:55). He also says the arrays on a lower-timeframe chart should be labelled with the timeframe they came from, so that a review weeks later still shows which structure was weekly, daily or intraday (48:51).
ICT Trade Review Lessons for Traders
The part of the recording a student can reproduce is the sequence rather than the forecast: establish a directional hypothesis from the higher timeframes, mark a limited set of prior reference levels, decide which version of the daily chart to read, and then observe how price behaves near those levels before moving to shorter timeframes. The video also stresses studying one instrument consistently, annotating your own charts rather than copying screenshots, and labelling each level with its source timeframe.
There is a short trade-management passage near the end of the chart discussion. He says that when a student does not know how to take partials, one way to improve is to trail up however many contracts you intend to scale out and let the market stop you on that number, and he adds that a good runner that has made money should never be allowed to turn into a losing trade (43:44, 45:18). That is his risk-management commentary, not a performance claim or individualized advice. A stop order does not guarantee a particular exit price; slippage, gaps and fees can change the result.
For a prop-firm evaluation, keep this chart-reading exercise separate from account risk. A directional idea does not change a firm’s loss limits. Understand how drawdown limits work before choosing position size, and record losing examples as well as setups that fit the retrospective explanation.
Watch the ICT Top Down Trade Review
The original recording is Top Down Trade Review September 01, 2024 from The Inner Circle Trader. The title names the review date; the recording discusses the session traded on Friday, August 30, 2024 and refers to the following Monday as the Labor Day holiday; the review is a retrospective explanation of the higher-timeframe analysis behind that session, and the numbers quoted in this article are the levels he reports rather than values recovered from the charts.
Watch the original recording on YouTube
Watch the full recording directly on The Inner Circle Trader’s YouTube channel using the link below.
Chart tools for the ICT trade review
Three references support the practical side of the article: the exchange page that documents session and holiday hours, and two vendor help pages that document the chart settings and study tools the discussion depends on.
Check the ICT review session clock
The review’s Friday-afternoon example leads into a US holiday weekend. For a new trading session, use CME Group’s holiday and trading-hours page to check the relevant product and venue. CME states that hours are subject to change and that its Globex hours are in US Central Time unless otherwise stated. Do not transfer the speaker’s New York-clock labels to an exchange schedule without checking the time zone, contract and trade date.
Understand the ICT daily-chart setting
The settlement discussion only makes sense if the setting is understood. TradingView’s settlement-price help page explains that the “Use settlement as close on daily interval” option chooses what is displayed as the closing price for daily and higher-timeframe bars of futures contracts, that the settlement price is calculated by the exchange at the end of each trading day with no single rule across exchanges, and that switching to intraday timeframes leaves the intraday data identical whether settlement prices were shown or not. That matches the instruction in the recording: compare both daily views, and expect the intraday charts to be unaffected.
Replay the ICT review without hindsight
TradingView’s Bar Replay guide documents opening replay from the chart’s top panel, choosing a starting point, stepping the chart forward, and its listed limits, among them that server-side alerts keep firing on real-time data, that new server-side alerts cannot be created during replay, that paper and broker orders execute against real-time data, and that non-standard chart types are incompatible with replay. Used honestly, replay is how a student can check whether a marked level was available before the move instead of only in hindsight. It cannot reproduce live conditions and cannot verify what another trader executed.
BestProps is not affiliated with CME Group, TradingView or the Inner Circle Trader, and no source listed here endorses this article or any setup. Turtle Soup, order block, volume imbalance, consequent encroachment, fair value gap, inversion, propulsion block and macro are used as descriptive study terms taken from the recording. Nothing on this page demonstrates a tested, repeatable or profitable result; any practical application involves substantial risk and this review is for education only.