
Key takeaways
ICT’s 58-minute 7 October 2023 weekend review analyzes the US Dollar Index, EUR/USD, GBP/USD, AUD/USD, gold, ES and Nasdaq from weekly and daily charts down to hourly, 15-minute, five-minute and one-minute views, prioritizing higher-time-frame direction, the economic calendar, key gaps and levels, and explicit invalidation conditions.
Read the full summary
ICT’s 58-minute 7 October 2023 weekend review analyzes the US Dollar Index, EUR/USD, GBP/USD, AUD/USD, gold, ES and Nasdaq from weekly and daily charts down to hourly, 15-minute, five-minute and one-minute views, prioritizing higher-time-frame direction, the economic calendar, key gaps and levels, and explicit invalidation conditions. DXY reached the prior weekly high of 107.274 and printed 107.348 after 12 weeks of buy-side delivery, supporting a possible retracement without calling a top. His major-news two-stage delivery framework treats the first move after nonfarm payroll or FOMC as potentially false and the second as a reversal, while acknowledging this is not certain and citing roughly 175 ES handles in about two minutes as a reason stops may behave poorly. His Silver Bullet rule requires a market-structure shift and retracement into a fair value gap between 10 and 11, although the gap may form earlier, with a minimum objective of five handles. ES regular trading hours are 08.30 to 15.15 CT, electronic hours cover the full session, and the E-mini contract is worth $50 per index point. He defines a liquidity void as an interval with no trading between two candles, not merely one wide candle. He reports a Nasdaq position entered at 14,775 between wick consequent-encroachment levels of 14,770.75 and 14,783.75 and exited by resting limit at 14,856.25 below the opening-range gap high, but the trade, fills and outcome are unverified and exclude costs and slippage. The review is a discretionary process example rather than evidence of an edge, with the article emphasizing that about two out of three retail forex traders finish each quarter in the red.
How we researched this article
BestProps used document-based research from primary firm sources, checked September 24, 2026. The complete source list, scope, limitations, and commercial-state record appear near the end of this article.
In ICT Mentorship 2023 – October 07, 2023 Market Review, the Inner Circle Trader reviews the US Dollar Index, four foreign-exchange pairs, gold, the S&P 500 and the Nasdaq after the October 2023 nonfarm payroll release. He works from the weekly and daily charts down to hourly, 15-minute, five-minute and one-minute views, and he spends the last part of the recording walking through an S&P position he says he placed in advance.
This is a weekend review, not a lesson set. It is useful mainly for seeing how one trader assembles a forward-looking read: higher-time-frame direction first, then the calendar, then the specific levels and gaps he intends to watch. What follows restates his stated analysis against his own timestamped captions. The chart levels, the interpretations and the reported execution are his account of screens this article cannot show, and none of it is independent evidence of an edge.
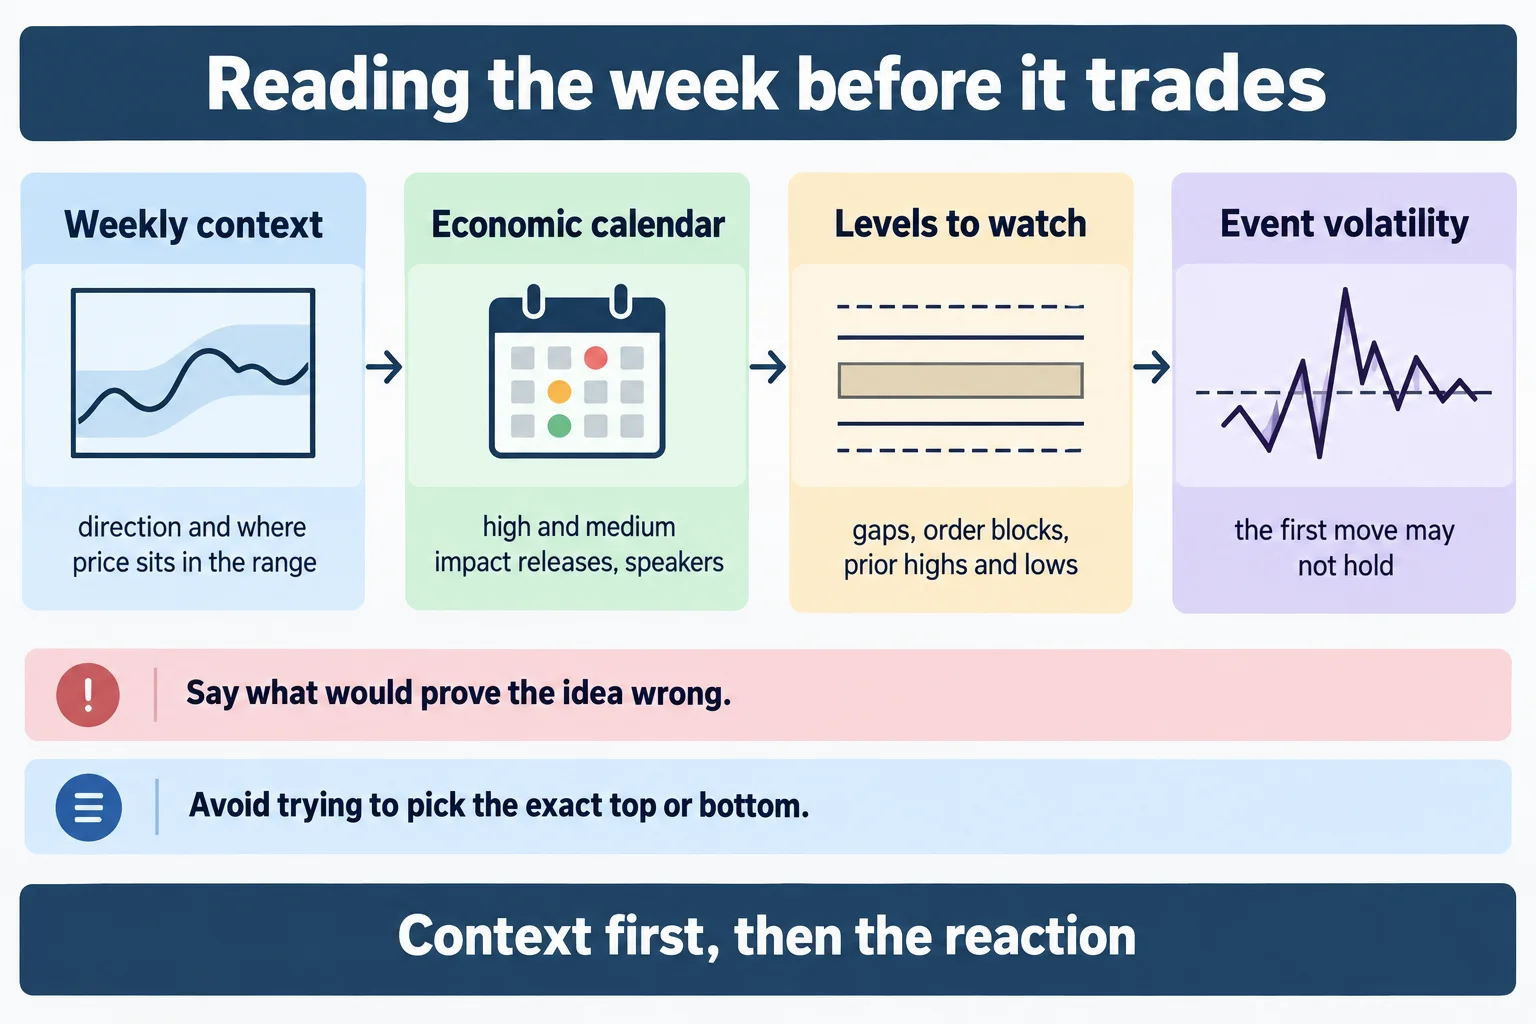
Week Covered in the ICT Market Review
The recording is dated 7 October 2023 and runs about 58 minutes. He says he is recording at 8:00 in the morning on Saturday (41:54), which is what he means when he later tells the audience to pay attention because this is as live as it gets. He notes that Monday is a holiday and that the coming week is therefore compressed (2:07).
The backdrop matters to him. He opens by saying events had occurred overnight involving the Middle East and Israel (0:16), and he expects that to add tension and produce a large Sunday opening gap, while also saying plainly that nobody knows where the market will open (38:08). That was a contemporaneous expectation, not something this source establishes about what followed.
Dollar Index Outlook in the ICT Market Review
Starting on the weekly Dollar Index at 0:25, he says an initial objective was met – the high of a prior weekly candle that he reads as 107.274 – and that the week just closed printed a high of 107.348, just above it and into an inefficiency. He counts twelve weeks of buy-side delivery, roughly three months of one-way movement, and calls a retracement reasonable here. He also states that he is not trying to pick the top (1:22).
His second step is the calendar. He recommends going through the coming week's high-impact and medium-impact releases and central-bank speakers as a weekend routine (1:30), and he expects a volatile week as a result.
On the shorter-term Dollar Index chart he describes the nonfarm payroll session as a move down into an order block, then up into buy-side liquidity, then rejection back toward sell-side liquidity. Going into the next week he says the shaded area near that rejection could act as what he calls an inversion fair value gap, and he outlines the sequence he prefers: a trade back up into the breaker, touching that inversion gap, and then a move lower (6:23). He then names the failure case himself – a gap lower on the open with no return into that area at all (7:08).
Dollar Pairs and Gold in the ICT Market Review
He begins the foreign-exchange section at 7:51 by saying that his earlier targets for the Dollar Index, the euro, the pound, the Australian dollar, the S&P and the Nasdaq had all been delivered in price that week, with gold the one exception – it had not reached the level he had outlined.
For EUR/USD he points to relative equal lows that price traded down into and then rebounded from, and lists the areas he is watching: a gap, an order block and a short-term high (8:00). His stated point is that price could retrace all the way back into those areas and still not constitute a confirmed reversal (8:52). He then sets out what would change his mind: the euro would have to take out a specified high and then treat an inefficiency above it as support before he would treat the low as significant (10:03).
He applies the same logic to GBP/USD at 11:32, noting that it behaved similarly to the Nasdaq relative to the S&P but was slower to follow the euro lower. His summary line is that one weekly down close does not change a three-month trend for him (12:34), and he repeats the instruction to avoid trying to pick a top or a bottom.
For AUD/USD he says he had been looking for sell-side to be taken, describes price returning into an inefficiency, and sets a condition: while it stays below the stated highs he expects lower prices and would not be interested in buying (13:06). He adds that he is not trading forex at all any more and is giving his opinion because viewers ask for it (14:09). That is a disclosure about his own participation, and it means nothing here should be read as a description of positions he held.
Gold at 14:24 is described as having traded down into an inefficiency, then broken through it so that it would act as an inversion fair value gap, with relative equal lows as the target he was pointing at. He says the nonfarm payroll move did not deliver that target and he still regards it as viable (15:00).
S&P 500 Index Read in the ICT Market Review
Moving to ES at 15:30, he notes price trading into an older inefficiency where the candle bodies stayed inside and only the wicks extended, and says a deeper retracement into that area would still not meet his definition of a reversal. He points to lows that he considers “too clean” and says he is completely willing to be proven wrong (16:43).
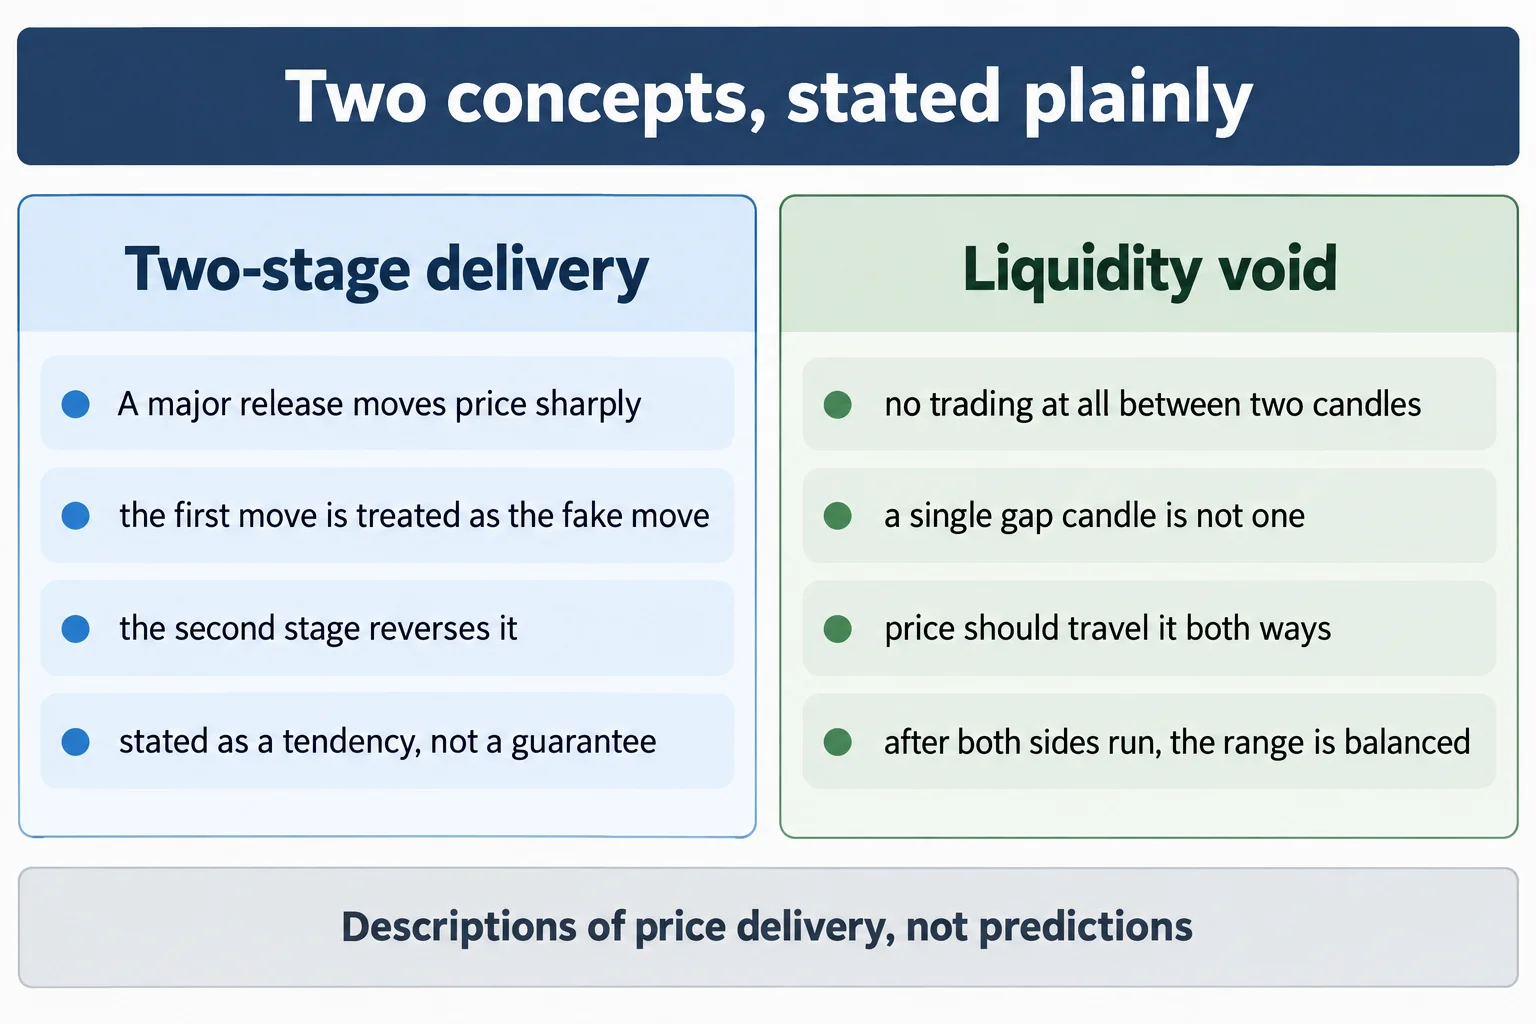
The centrepiece of the review is his interpretation of major news events. From 19:36 he describes nonfarm payroll and FOMC rate announcements as a “two-stage delivery”: the first move after the release is treated as the fake move, and the second stage reverses it. For this session he identifies the 8:30 a.m. decline as stage one (21:45) and the subsequent rally as stage two, then repeats the framework near the end of the recording (47:17).
Two things in his own account are worth separating from the pattern claim. First, he states the move as a tendency rather than a certainty – “not all the time, predominantly yes” at 47:45 – and elsewhere says nonfarm payroll can surprise him. Second, the reason he gives for respecting it is risk, not accuracy: he describes roughly 175 handles covered in about two minutes (20:19) and says a stop-loss will not work as expected in that first minute. The 175-handle figure is his own description of the move; the article cannot verify it against the chart.
Silver Bullet Timing in the ICT Market Review
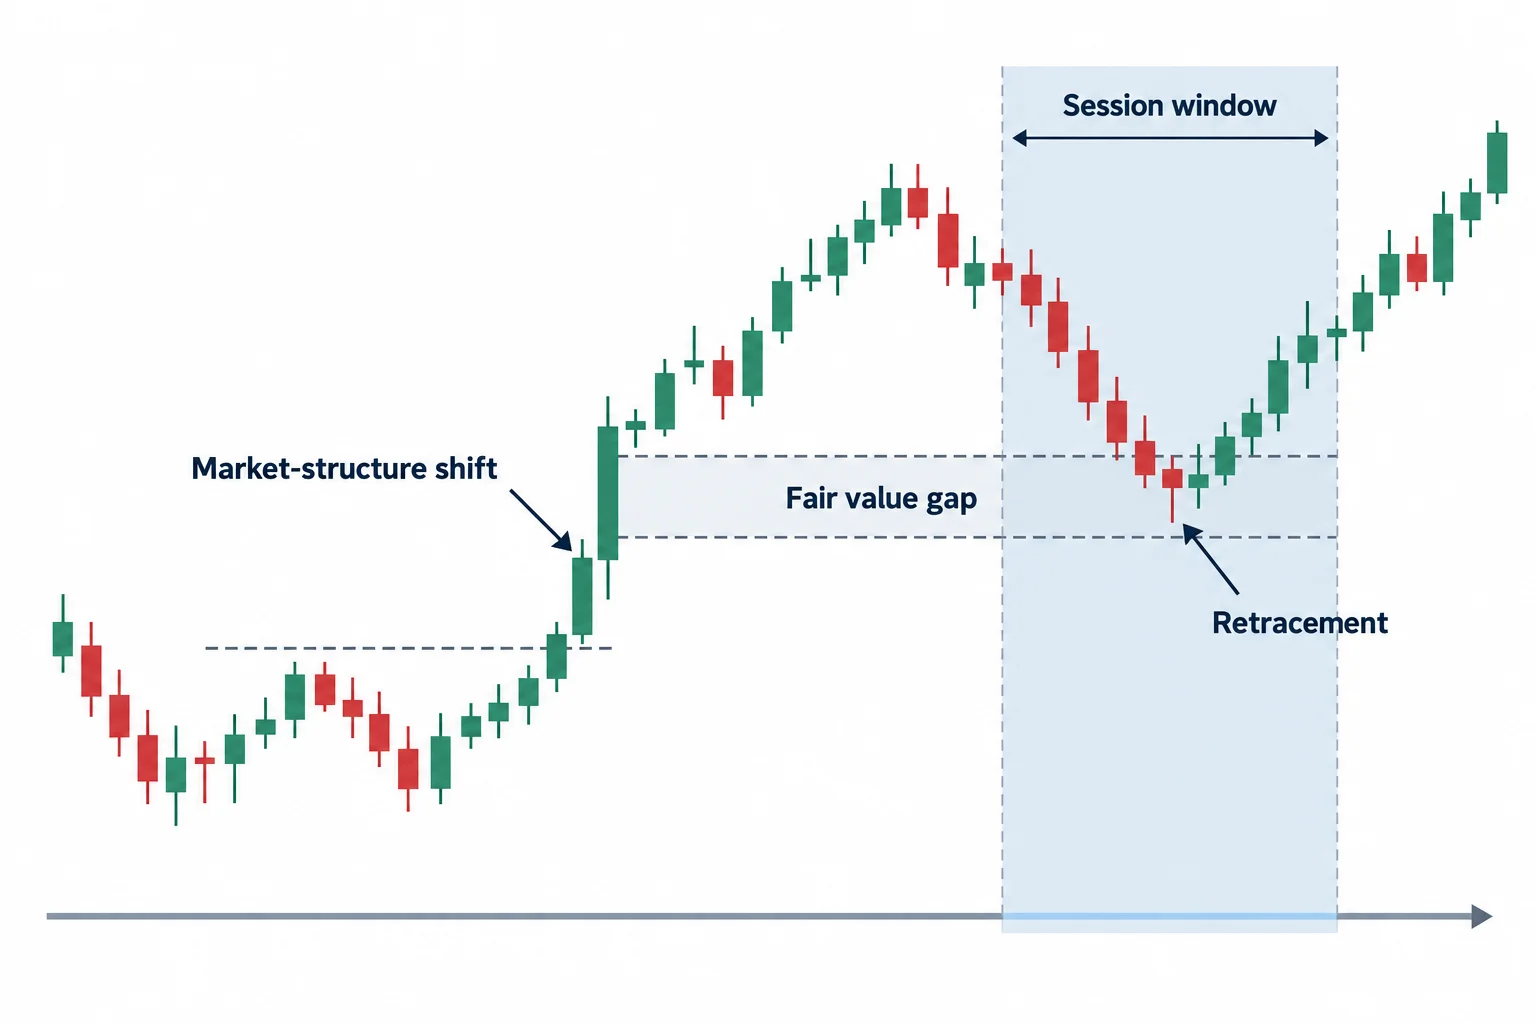
He then works down to a one-minute chart at 24:11 to show what he calls a Silver Bullet: a market-structure shift followed by a retracement into a fair value gap. The detail he emphasises at 27:45 is that the gap itself does not have to form inside the 10:00 to 11:00 window. As he states the rule, the setup is the retracement into the fair value gap occurring between those hours; the gap can sit outside and before them. This is a specific correction he makes to how the pattern is often described, and he tells viewers to go back and listen to the original recording rather than take his summary on trust.
He says the objective for that example was a return to the previous day's settlement using regular trading hours while the chart is toggled to electronic trading hours (28:43), and that as a Silver Bullet he is looking for a minimum of five handles (29:07). He also shows a second, later instance in the 2:00 hour (29:26).
This is the practical reason session settings matter. Regular and electronic hours are not the same series: on CME futures, regular trading hours are the reduced 08:30-15:15 CT session while electronic trading hours are the full session, and that difference is exactly what makes an opening-range gap computable. TradingView's help pages set out that distinction.[3] The ES contract that these levels belong to is the E-mini S&P 500 future, quoted at $50 times the index, so a single index point is fifty dollars.[2]
Nasdaq Liquidity in the ICT Market Review
On the Nasdaq he states a directional bias and then explains what it depends on. He says the rally may have been engineered to take out short sellers and collect trailing buy stops (31:41), that he is bearish rather than bullish on it, and that any longs within that framework would have to be intraday scalps against his higher-time-frame view. He gives the invalidation too: if price trades above the highlighted inefficiency and then shows support there and rallies, he will concede that something underneath was missed (32:32). He also says it is good for viewers to see him get it wrong.
The most transferable part of the recording is his definition of a liquidity void from 35:27. A wide single candle is not, in his terms, a liquidity void. He reserves the term for an interval where no trading occurred at all between two candles – no fills, no closes, nothing booked between the low of one and the high of the other. His reasoning is that such a range has only been delivered one way, so he expects it to be re-delivered in the other direction before it becomes what he calls a balanced price range (37:46).
He is candid about the status of these ideas. While explaining that grading a range is not the same as quarter theory, he asserts that his framework is what the algorithm is doing and that everything else explains it only in hindsight (46:06). That is a claim about his own method. The transcript contains no test of it, and the void and balance concepts are descriptive of chart structure rather than measurable predictions.
S&P Trade Execution in the ICT Market Review
The last section is a walkthrough of a reported position rather than a prediction (50:10). He says he had a limit exit resting just below the opening-range gap high because he expected price to run up and close that gap, and that he was asleep and did not watch it happen (39:24). He reports the exit at 14,856.25, deliberately placed below the level he was aiming for (50:53), and he gives the reason: on a prior occasion a limit order near a target had not filled because of a one-tick spread (55:44). He states his entry as 14,775, between the consequent encroachment levels of two wicks that he reads as 14,770.75 and 14,783.75 (53:40), and he insists the recording is not market replay because it shows the execution as it happened.
Two limits on that account belong in the article. The prices, the fill and the outcome are his own statements from his own screen; there is no statement, no third-party confirmation and no cost or slippage treatment here, and the video is a market-analysis recording rather than an audited track record. He also says himself that he was too tired to watch the session and that missing the setup entirely would have been acceptable, which is a description of one discretionary trade taken on one instrument, not of a system being demonstrated. The CFTC's advisory on trading systems describes exactly why this distinction matters: hypothetical or reconstructed results may not reflect a trader's ability to absorb losses, stops may fill worse than assumed or not at all, and spreads may not appear in the prices used.[4]
He closes by saying he is aiming at a shaded fair value gap for a setup in the following week and that he is fine with being wrong about it (51:31), then asks viewers to rest, keep an eye on the Middle East, and stay aware of the week's scheduled releases (57:28).
Limits of the ICT Market Review
As a worked example of process, the review has four consistent steps: fix the higher-time-frame direction, read the calendar for event risk, list the specific gaps and levels that would matter, and state in advance what would invalidate the idea. He applies the last step repeatedly – to the Dollar Index with the gap-open scenario, to the euro with a specified high, to the Nasdaq with the inefficiency that would prove him wrong.
What it does not establish is that any of this produces results. The targets he says were delivered earlier in the week are his own recollection of screens, not statements this source can check. The two-stage delivery and the liquidity void are definitions of how he reads price, offered with reference to one week's charts. The reported S&P entry and exit are a single discretionary trade on a single session. And the one performance comparison in the recording is between his description of the move and what he expected, not against any benchmark. The CFTC notes that about two out of three retail foreign-exchange traders end each quarter in the red,[5] which is the relevant baseline for anyone reading chart-based instruction as a route to profitability.
For readers working through the Mentorship 2023 material, the most useful thing to take away is the ordering rather than any level: context, then calendar, then levels, then the condition that would prove the read wrong – and an explicit refusal to treat a retracement as a reversal without pre-defined evidence.
Watch the Original ICT Market Review
This article draws on the timestamped English captions of the recording, which YouTube generated automatically. The chart markings the review depends on are only visible in the video itself, so it remains the primary source for every level discussed above.
Watch the original recording on YouTube
The video cannot be played inside another website. When its embedded player was loaded and clicked from a BestProps page on 15 September 2026, the player itself reported “Video unavailable. Playback on other websites has been disabled by the video owner.” and stayed on a “Watch on YouTube” prompt with no playback progress at all, while the public watch page reports normal playability. That is why no embed is left here rather than a silent dead player.
Watch ICT Mentorship 2023 \ October 07, 2023 Market Review on YouTube ↗
The recording runs about 57 minutes 54 seconds. It is titled “ICT Mentorship 2023 – October 07, 2023 Market Review” and was published on the channel The Inner Circle Trader on YouTube on 7 October 2023.
ICT Market Review Resources
These are the outside sources checked for this article. The CME page is the exchange's own contract specification for the future whose levels are discussed, and the CFTC pages are regulator and investor-education material on how trading systems and results are presented. The TradingView page is third-party documentation of a charting platform's session settings and is labelled here as unofficial and untested for any trading purpose. None of these sources assesses ICT, this review, or the two-stage delivery and liquidity void ideas.