
Key takeaways
ICT’s July 6, 2022 market review covers the US Dollar Index, EUR/USD, GBP/USD, September 2022 E-mini S&P 500 and Nasdaq futures, and gold in one 21 minutes 13 seconds session.
Read the full summary
ICT’s July 6, 2022 market review covers the US Dollar Index, EUR/USD, GBP/USD, September 2022 E-mini S&P 500 and Nasdaq futures, and gold in one 21 minutes 13 seconds session. ICT targets 107.61 on the dollar after price traded into the 106.42 hourly imbalance, swept sell-side liquidity and rallied, saying a hit would end his trading week. EUR/USD analysis features a three-Indians daily pattern, downside expansion through the 1.03403 old low, displacement, an institutional order flow entry drill, a SIBI and bearish breaker, while GBP/USD illustrates correlated-pair SMT divergence and includes a correction to an inaccurately anchored chart box. Index futures expire quarterly in March, June, September and December, making September the active contract in July until roughly the second week of September, when December takes over. For the FOMC minutes, ICT favored the S&P because its relative equal highs remained uncleared while Nasdaq had already taken its comparable highs, treated the 2 p.m. release as a new session open, waited for a Judas swing below that price into an order block and fair value gap, and describes a rally through 3857.75 toward 3874. Gold remained bearish with dollar strength, using a Judas swing above the midnight open and two negative Fibonacci projections for downside objectives, though ICT was uncertain the deeper target would trade. All figures come from an automated Whisper large-v3-turbo transcription without human caption or chart verification.
How we researched this article
BestProps used document-based research from primary firm sources, checked September 25, 2026. The complete source list, scope, limitations, and commercial-state record appear near the end of this article.
In the ICT Market Review for July 06, 2022, the speaker combines his YouTube and private-mentorship sessions into one recording because he says an unexpected commitment will take his attention the following day. He applies his framework (liquidity, fair value gaps, displacement, market structure shifts and intermarket divergence) across the dollar index, EUR/USD, GBP/USD, the September 2022 E-mini S&P 500 and Nasdaq futures, and gold. The discussion is partly retrospective and partly forward-looking: what follows attributes each expectation to him rather than presenting it as a result.
On the source. The watch page lists this recording as public, titled “ICT Market Review – July 06, 2022”, published 6 July 2022 at 16:52 PDT, and listed at 1,273 seconds, about 21 minutes 13 seconds. The source behind every timestamp link here is an automatic speech-to-text transcription of the recording’s own audio, produced locally with a Whisper large-v3-turbo model, not human-verified captions. Its timestamps are automated, no visual verification of the charts was possible, and the transcript is not reproduced here. Every figure below is what the source is transcribed as him saying, presented as his chart narration rather than audited market data.
ICT Market Review of the Dollar Index and EUR USD
He starts on the daily dollar index and describes what he calls an SMT divergence: the dollar was making higher highs while EUR/USD was not producing the corresponding lower lows he would have expected against it, with the euro shown as an overlay. He places the dollar inside a fair value gap and inside what he calls a primary bull trend, says the midpoint of the imbalance had been reached, and identifies the final objective he refers to as 107.61. He tells viewers he will be looking for it, reminds them the following day is a Thursday, and advises them not to push too hard or force anything. He adds a clear rule: if that level is hit, he is done for the week and will not consider anything on the Friday (0:46, 0:52, 1:03, 1:17, 1:36).
On the hourly chart he marks the imbalance he refers to as the 106.42 level, says price traded down into it after New York midnight, and that the drop into the fair value gap brought the market to what he calls a discount. He then describes the opening, a run on sell-side liquidity with the candles purged, and a quick move back up toward the midpoint between the two levels he names. He notes these are levels he has been watching for weeks (1:46, 1:54, 2:02, 2:11, 2:20).
Turning to EUR/USD, he describes a “three Indians” pattern on the daily chart and the lower prices he had been looking for, then range expansion to the downside. He compares the lows between the euro and the dollar to make his divergence point, describes heavy distribution inside a fair value gap in the form of what he calls a SIBI, a break lower, and an attack on sell-side liquidity. On the hourly chart he points to an optimal trade entry and a shift in market structure, then to large range candles expanding below the sell-side liquidity at an old low transcribed as 1.03403, which he identifies as a previously marked relative equal low (2:35, 2:46, 3:01, 3:11, 3:21).
He recalls telling viewers the previous night that they would have to play it by ear at midnight, and lays out two branches: price runs into the area and tries to rebalance it before selling off, or it runs above the level and then drops during the London session, which he says could set up a run back into the 10340 level. What he says actually happened was a small shallow run above relative equal highs to take buy-side liquidity and reach the midpoint of the gap (3:34, 3:40, 3:53).
On the 15-minute chart he refines two fair value gaps and describes a single candle leaving a small portion open between one candle’s high and another’s low, with buy-side liquidity resting above relative equal highs that he calls retail resistance. He says the market dropped at midnight, left what he calls relative equal lows, and then rallied. His reading is that this engineered sell-side liquidity, that price ran up to the buy-side liquidity and closed the fair value gap, and that what followed was a Judas swing, a break down, and an attack on sell-side liquidity running aggressively into the morning session with several lower lows. He marks the New York midnight opening price and extends it in time, calling the result his classic sell-day scenario (4:05, 4:26, 4:52, 4:57, 5:17).
Moving to the five-minute chart he points to the break lower, displacement, what he calls an institutional order flow entry drill, and a smaller fair value gap left open. He then gives a selection rule for the reference candle: he wants the down-closed candle with the most body, and he says he looks through the stop run rather than treating every nearby candle as the reference. He repeats that he is not using supply-and-demand zones, takes that candle’s range and extends it in time, and calls the result both a SIBI and a bearish breaker. He describes price hitting it and dropping lower, then trading back up into a small fair value gap (which he calls a nice entry) before the approach into the New York morning hours and lunchtime (5:24, 5:40, 5:49, 6:00, 6:07).
ICT Forex Market Review of GBP USD Divergence
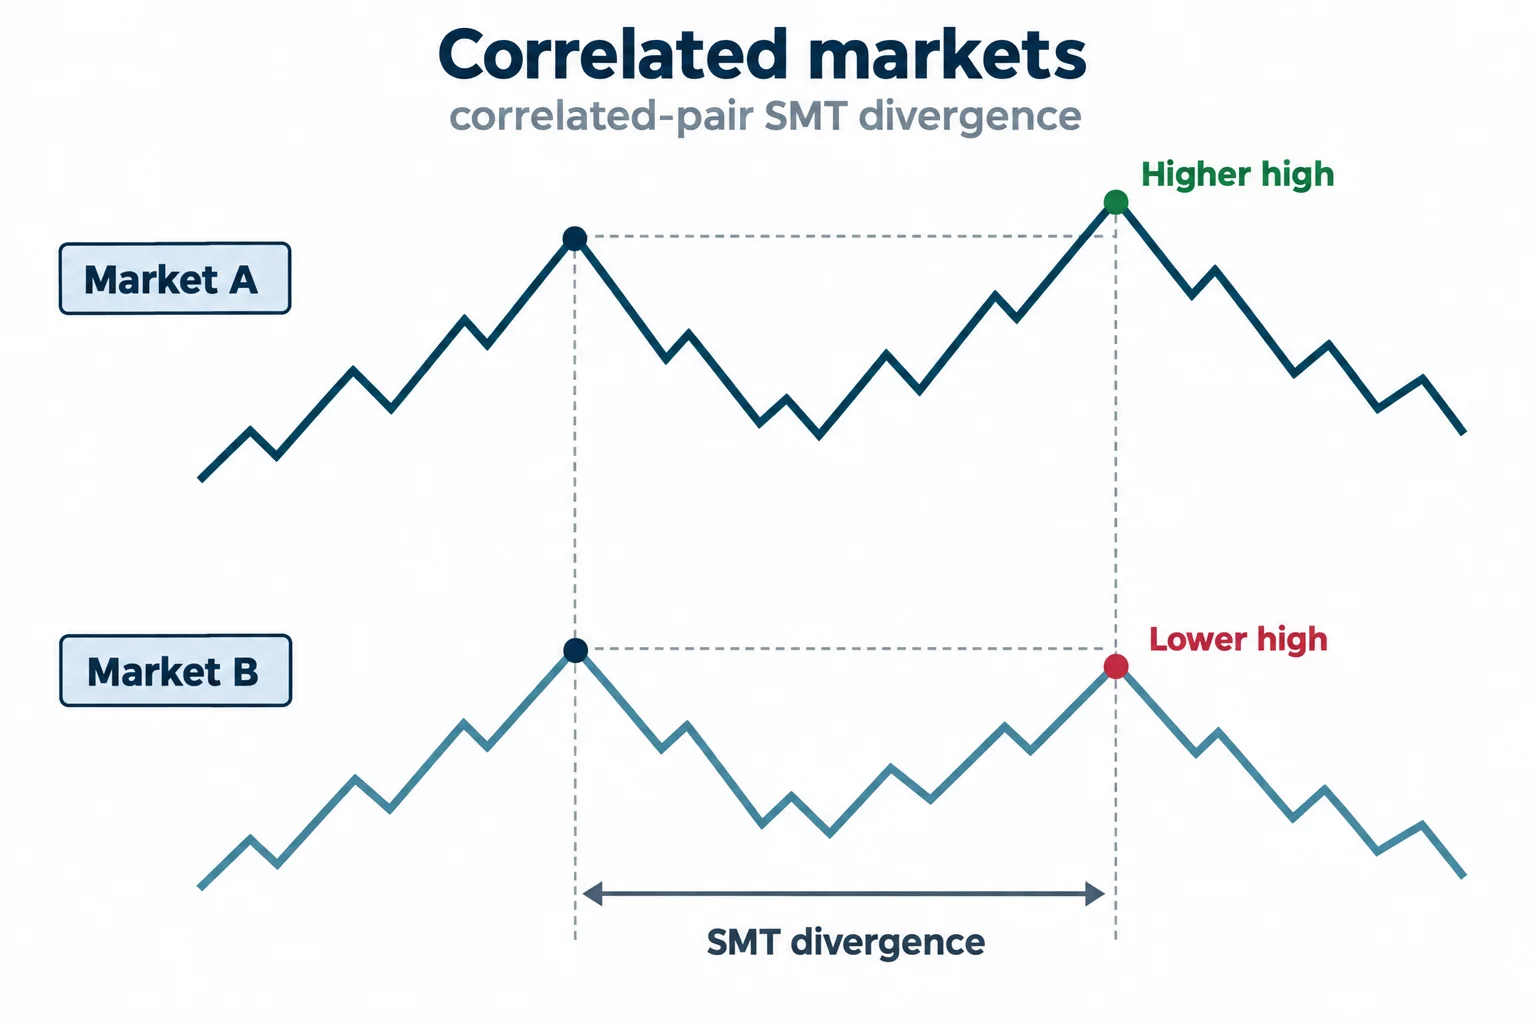
On the pound he introduces what he calls correlated-pair SMT divergence, using the dollar and euro as his example: two closely related instruments where a crack appears in the relationship. He looks for higher highs on one and a lower high on the other, and he names currency pairs where he applies it. With sell-side liquidity marked as the objective beneath an earlier low, he describes price cascading down into that level (6:26, 6:33, 6:51).
He then stops to correct his own chart. He says he does not have the box drawn correctly, that it should be anchored differently and should not be touching that level, and that the price there is actually slightly less than the one the box appeared to touch. He tells viewers to check the hourly pound chart on their own data feed and anchor from one point to another to see what he means, then describes what he would have looked for: a break lower on sell side, a return up into the fair value gap at the old low, a rebalance of it, and then a move down to hack the sell-side liquidity resting below that low. He calls the outcome a nice little distribution day on the pound (7:00, 7:06, 7:13, 7:39, 7:56).
That self-correction is worth keeping in the record. It limits how precisely the setup can be reconstructed from the narration: the speaker himself says a drawn boundary did not match the data, so the article does not reproduce the box. On the lower time frames he describes an hourly fair value gap rebalanced during the London session, buy-side liquidity purged, displacement, a shift in market structure, then further breaks and consolidation before the move into New York attacking sell-side liquidity, followed by a return into a range around a level he refers to as 1934 and the old daily low (8:10, 8:25, 8:35, 8:50, 9:05).
ICT Index Futures for September 2022 in July
Moving to the September-delivery E-mini S&P 500 and Nasdaq contracts, he answers a question he says appears repeatedly in the comments: why look at September when it is not yet September. His explanation is that contracts expire, that the June 2022 contract he had been trading has since expired, and that September is therefore the front month or most active contract until roughly the second week of September, after which the December 2022 contract takes over for both indices. He says there is no July or August index futures contract, and lists the contract months as March, June, September and December (four per year, one per quarter) with the roll going to the next month in that order on expiry (9:14, 9:29, 9:38, 9:58, 10:10, 10:36).
He then returns to the charts. On the daily S&P he points to an imbalance he describes as his interest for the remainder of the week, adding that price might not get up there, and notes a comparable but different-looking setup on the Nasdaq with a gap he says they have been monitoring for close to a month. He frames a fair value gap from one candle’s low to another candle’s high, says he used that level that day, and specifies that the thinner line on the lower time frames is the low of the gap rather than an order block. Once again he notes that he cuts through candles rather than treating them as supply-and-demand zones (10:46, 10:49, 11:02, 11:11, 11:26, 11:40).
ICT July 2022 Market Review of FOMC Minutes
The central index lesson begins with relative equal highs. He says the S&P had what he calls unfinished business at those highs ahead of the FOMC minutes, while the Nasdaq had already cleared the comparable area days earlier, and that he had mentioned this on his prior video. He then connects the two: the S&P had not yet made its way to that buy-side level, there was also an imbalance in the form of a fair value gap, and he expected a run up into that area. He anticipates the obvious objection that this is hindsight and states directly that it is not (11:49, 11:55, 12:06, 12:19, 12:45).
On the hourly chart he marks relative equal highs run through on FOMC and the level he refers to as 3840 alongside the old gap low, and notes a fair value gap price dropped into earlier in the day. He calls the whole day choppy and aimless, then says he will go deeper into the chart to show what could have been anticipated. On the 15-minute chart he identifies the last down-closed candle before the run as the order block, describes the release opening, rallying, pulling everyone in that direction, then being sunk back into the order block before the move higher, and says the Nasdaq did the same thing twice. He marks the old relative equal high from the daily chart that had not been traded to, and calls it unfinished business (12:54, 13:25, 13:41, 13:49, 14:00, 14:24).
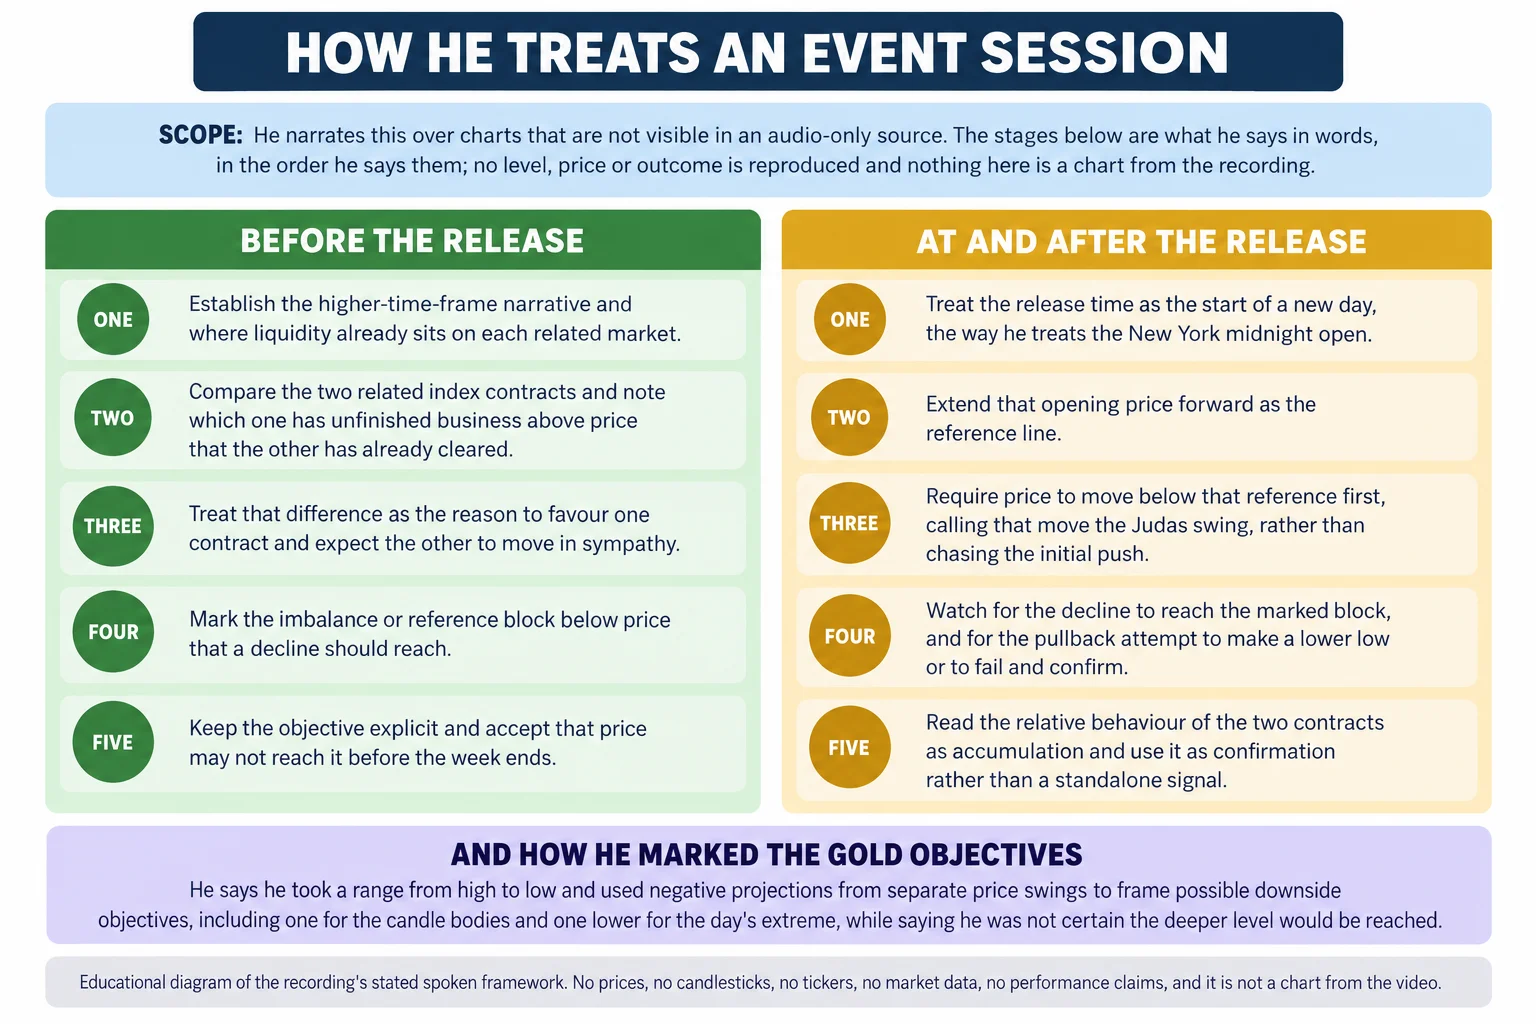
He then lays out his event-session procedure explicitly. Because the S&P had unfinished business above, he says buy side was the likely objective, which means the level he refers to as 3857 and a half or higher. He tells viewers to treat the 2 p.m. release as the beginning of the day and to regard everything before it as irrelevant, the way he treats the New York midnight open. His method is to take the opening price at 2 p.m., extend it in time, and, operating with a bullish bias, wait to see price drop below it (that drop being the Judas swing) rather than chasing the move. He says he wants to see the decline reach the order block, and he describes a false attempt to go below the low, leaving a higher high (14:32, 14:49, 15:03, 15:09, 15:16, 15:23, 15:29).
The comparison between the two indices is the reason he gives for preferring one. He says the S&P hinted ahead of time that it was the one to be in because it had a reason to go higher, that the Nasdaq had been above its relative equal highs for a day or so while the S&P had not, and that the S&P therefore had to catch up, a sympathy relationship he expects to resolve in price before the release. He calls this smart money accumulation without an indicator, supply-and-demand or harmonic pattern, and says the S&P should fail to make a lower low when the Nasdaq made its own lower low into its order block. He points to a stop run below the opening price in the order block and into the fair value gap, a second pass at the order block, and then what he describes as an explosive rally into the relative equal high he calls 3857 and three quarters, followed by a move into a level he reads as 3874 even, above an hourly S&P imbalance (15:44, 15:53, 16:16, 16:23, 16:47, 16:51, 17:47, 18:01).
Those are the levels as he reads them aloud from his own charts. The recording does not contain statements, broker records or independent data that would let a reader confirm the chart values, any entry, any fill or any result, and none is claimed here.
ICT Gold and Dollar Market Downside Targets
Gold is the last market on his list. He explains that he has been drawing attention to the area because it ties to the continuation higher he expected on the dollar, and he is candid about how he presents an uncertain view: he says he sometimes does not have a hard bias but still has to tell his community what he believes will happen, and that this is not offering a plan A and a plan B or claiming credit whichever way the market moves. He says liquidity below had already been reached, that the bias remains bearish because price has not yet gone below the relative equal lows, and that he believes the next draw on liquidity is lower, while stating that he is not certain it will go below that level yet and that he considers the objective realistic to continue into the Thursday (18:14, 18:31, 18:58, 19:15).
On the intraday chart he describes the overnight drop at New York midnight as something he was not interested in, and instead waits for a rally above the opening price, which he calls the Judas swing when it then breaks down. He offers two ways to look for a short: using a short-term swing low with displacement and a run up into a level, or waiting until the New York session. He then measures a dealing range, requires the entry to be above the midpoint, and describes price returning into the fair value gap and delivering down toward an objective (19:26, 19:31, 19:38, 19:43, 19:47, 19:58).
He is specific about how he arrived at the two downside figures: taking a high-to-low range and applying a negative two standard-deviation projection to get the level he associates with the bodies of the candles, and then anchoring the same tool from one point down to a low to arrive at what he calls almost the ultra low of the day, a negative three projection. He describes these as two price swings projected down, says it looks like it could roll over, and adds a preference: he would rather the market stay heavy and attack the level below than pump first, and he closes by naming that as the objective for the week (20:14, 20:22, 20:32, 20:38, 20:49, 21:03).
The projection mechanics are the part most dependent on the original charts. He names the anchors in words but the source provides no chart images, so the article does not attempt to reconstruct the specific levels or claim any outcome from them.
ICT Market Trading Takeaways
Across all five markets the same shape of argument recurs, and it can be separated from the proprietary terminology:
- Establish a higher-time-frame narrative and an explicit objective before dropping to a lower time frame.
- Identify where liquidity rests around earlier highs and lows, and treat it as context rather than a guarantee.
- Use relative behaviour between correlated markets as supporting evidence, not as a standalone signal.
- For scheduled events, define the reference session boundary and price line in advance, then wait for a retracement instead of chasing the first move.
- Expect price to reach some objectives and not others; in this recording he says as much about the S&P imbalance and about the deeper gold level.
- Correct your own chart work when it does not match the data, as he does with the pound box.
The recording is a dated example of how the speaker organises a multi-market review around context, objective, session timing and confirmation. It is not a demonstration that the framework is predictive, and the terms it uses depend on his own definitions and markings. This is educational commentary, not investment advice or a performance claim.
Watch the ICT July Market Review
ICT Market Review – July 06, 2022
The Inner Circle Trader · watch page lists publish 6 July 2022 16:52 PDT · 1,273 seconds, about 21 minutes 13 seconds · public, not unlisted. This recording is the primary source for every timestamp link on this page.
The recording is not embedded here. An embedded player was tested directly on 16 September 2026 from a BestProps page origin at bo