
Key takeaways
This ICT index futures PM session review for July 5, 2022 compares the September S&P and Nasdaq contracts across the daily, hourly, 15-minute, five-minute and one-minute charts (0:04 , 0:22).
Read the full summary
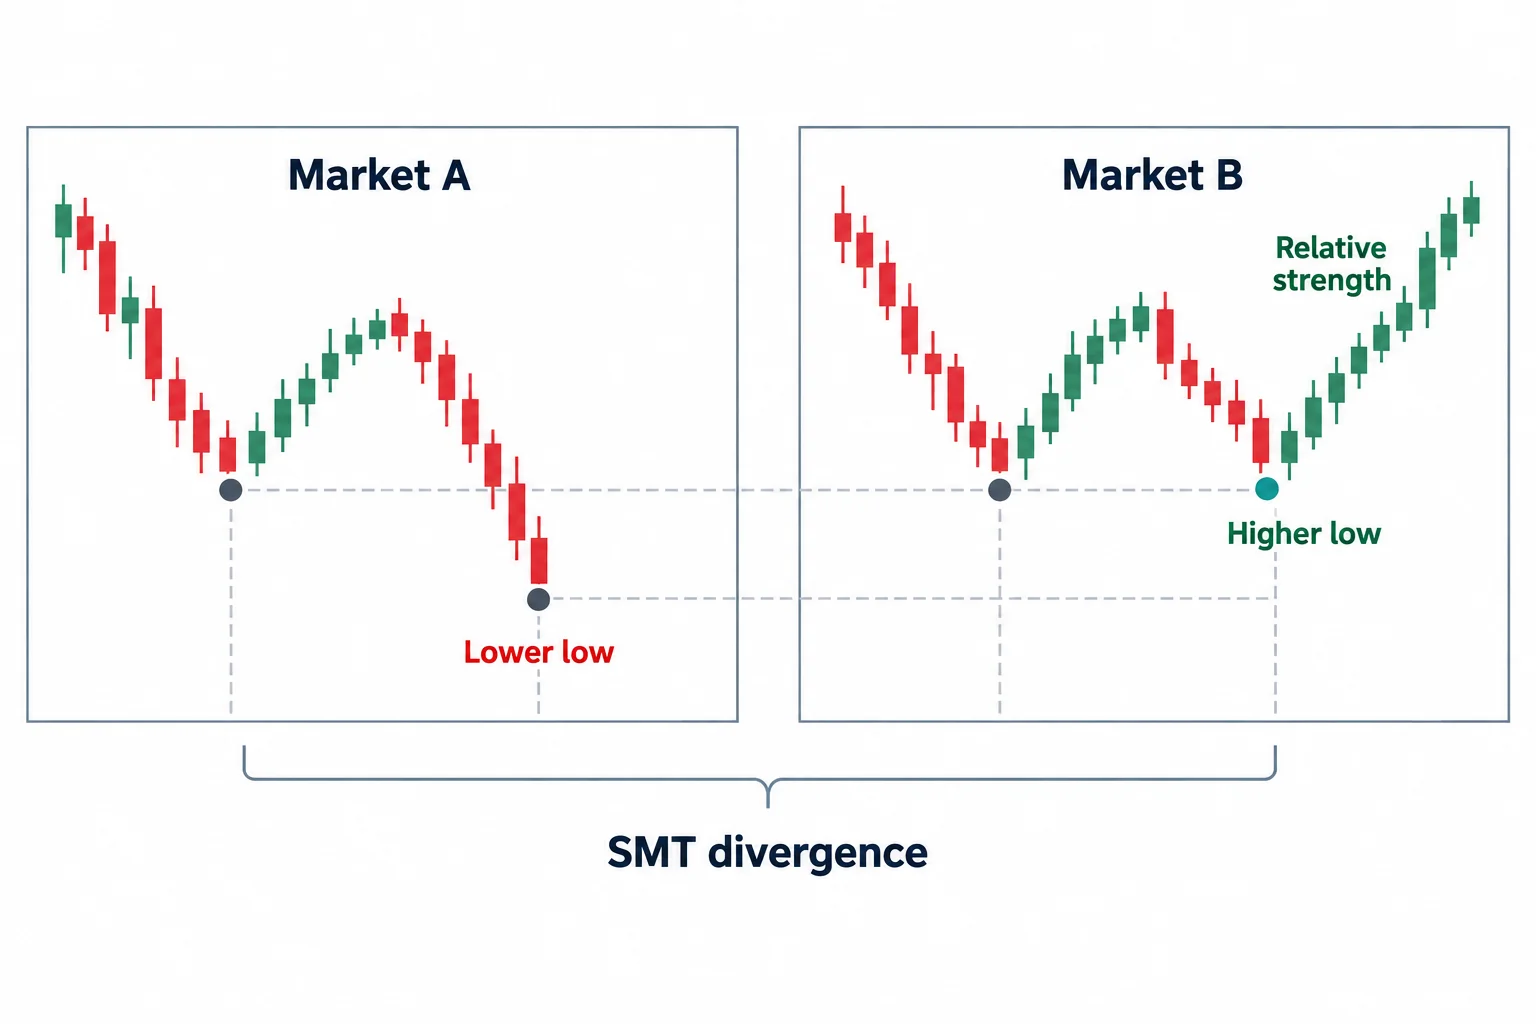
This ICT index futures PM session review for July 5, 2022 compares the September S&P and Nasdaq contracts across the daily, hourly, 15-minute, five-minute and one-minute charts (0:04 , 0:22). Both had reached an imbalance, and on the hourly views one market made a lower low while the other made a higher low, a disagreement he calls an SMT divergence and reads as the latter being the relative-strength leader (1:04 , 1:15 , 1:22). He is explicit that he does not mean a relative-strength indicator: he is measuring one market against the price action of the other (3:02 , 3:07). Because the other contract had been the weaker of the two, he moved his focus to the one that held up (6:20), and for the afternoon session he defined as 1:30 to 4:00 p.m. New York time (5:16) he describes a proximity entry inside the last up-close candle (5:46 , 5:52) and explains why the same structure qualifies for him as a bullish breaker (6:10 , 6:15). He reports going long, about two points of adverse movement, and scaling out of a twelve-contract position with the first two exit steps named (7:55 , 8:01), says he had expected only a modest retracement, and says he took no further trades (8:26 , 8:32). The remaining exit detail is unclear in the audio, so no complete result is reconstructed; the recording is his own narration of charts it cannot show and evidences no verified fill, account result or repeatable edge.
How we researched this article
BestProps used document-based research from primary firm sources, checked September 25, 2026. The complete source list, scope, limitations, and commercial-state record appear near the end of this article.
This article is a transcript-grounded summary of one recording: ICT Index Futures PM Session Review – July 05, 2022, published on The Inner Circle Trader channel. The watch page lists the publish timestamp as 5 July 2022 at 15:36 PDT and a length of 599 seconds, about 9 minutes 59 seconds, and the video as public. The recording opens by calling it the July 5th 2022 index futures review and works with the September 2022 S&P and Nasdaq contracts (0:04).
The source behind every timestamp link is an automatic speech-to-text transcription of the recording’s own full audio, produced locally with a Whisper large-v3-turbo model. It is not a human-verified caption track. Its provenance header records that the timestamps are automated and that there is no visual chart verification, so ambiguous wording and numbers are flagged in place rather than silently corrected. The transcript is not reproduced here and stays private.
Two recognition points. The transcript renders one phrase as “S&T divergence” (1:15) and elsewhere as “S&P divergence” (1:15); in this series the term he uses is SMT divergence, and it is read that way here because the surrounding sentences describe an intermarket comparison between the two index contracts. The phrase rendered as “cell side” or “cell sign” (2:10 , 5:29) is the sell side, again read from the context of the sentence it appears in. The instrument levels quoted below come from the automated transcription and are recorded as spoken, not as verified market data.
One limitation shapes the whole piece. This review is a reconstruction of the speaker’s stated reasoning from the spoken transcript. It should not be read as proof that the concepts provide a repeatable trading edge, and the recording does not independently establish order execution or profitability for any trade it describes.
ICT Index Futures PM Session Review July 5: The Two Contracts Compared
He opens on the daily charts of both September contracts, side by side, and notes that each had reached an imbalance during the session (0:22), with the Nasdaq described as having been more overzealous (0:29). Before stepping down through the charts, he asks viewers to compare the previous day’s low with the current day’s low in both markets and to say whether they can see a difference (0:37), promising to make it clearer on the lower timeframes (0:51).
On the hourly charts he lays out the comparison (0:56): one market prints a lower low and the other prints a higher low (1:04). He calls that an SMT divergence and identifies the market that failed to make the lower low as the relative-strength leader on the upside (1:15 , 1:22). He then makes a definitional point that matters for reading the rest of the session: he is not talking about a relative-strength indicator (3:02), but about one market’s behaviour measured against the price action of the other (3:07).
He also explains how viewers can check the calls themselves. He credits a viewer for the tip that links copied from Twitter can be pasted onto a chart to show exactly when a post was sent (1:34 , 2:03), and uses that to point at where he had been asking about sell-side liquidity on the 15-minute view (2:10), noting that the lows he named were both tagged (2:16). His framing of what follows is conditional rather than predictive: once price reaches such a level, what he waits for is continuation or a rejection that suggests the move is not going to continue (2:38).
The Candle-Level Divergence and the Shift in Market Structure
The second layer of his reading is on the faster charts. He points out the lows at 9:30, 9:45 and 10:00 and says there is another SMT divergence among those individual candles, giving him two instances: one around the significant 15-minute low and one across the individual candles (3:17 , 3:22). He asks viewers to check the pattern on their own charts rather than accepting his marked-up example, and to log and journal it (3:34 , 3:43).
From there he describes price rallying, retracing and working higher through lunch, with an imbalance and a fair value gap that price drops into and taps again alongside relatively equal lows (3:54). He characterises the combined picture as two divergences and what looks to him like an accumulation phase, then says price ran higher and a shift in market structure formed during lunch (4:04 , 4:13).
That is where the contract decision is made. He says he waited for the afternoon and that he was not interested in the contract that had made the lower low while the other had not, so his focus moved to the other one (6:20). He offers this as his answer to a question he says he is asked constantly, which is how he knows when to change gears between the two contracts. He defines the afternoon session he is discussing as 1:30 to 4:00 p.m. New York local time (5:16), and states his objective as a return toward the daily-chart imbalance and a move above relative equal highs (8:26).
The One-Minute Entry, the Proximity and the Bullish Breaker
On the one-minute chart he describes relative equal lows with sell-side liquidity presumed beneath them (5:24 , 5:29), and the sequence he says had already happened by the time he got to the chart: price dipping into the fair value gap, rallying, dropping down to clear the relative equal lows and hitting the gap once more (5:31).
He then names what he did. A proximity entry, in his usage, means using what has already happened rather than chasing a fresh breakout: he says he is buying on the understanding that while he is inside that candle range he is not chasing price, because the market has already run to rebalance and clear stops, so there is no reason for that low to be taken again (5:46 , 5:52 , 6:03). He describes himself as inside what he calls a bullish breaker (6:10), defines the structure as a low, a high and a lower low inside a bullish market (6:15), and says that while it can be traded after price goes above the intervening high (6:20), he can also use it without waiting for that break (6:24). He says that is what he did, accumulating a long position while price sat in the last up-close candle (6:29).
He then walks through the entry on the chart, pointing at the low of that up-close candle as the level in question and at the toggle marking where in the candle he went long (6:56 , 7:11). His stated logic is a sequence he repeats: sell-side cleared inside a bullish market, so the market should rally (7:20). He adds that he could equally have taken a later, larger version of the same pattern, and tells viewers not to be discouraged if it is their first time seeing it (7:32 , 7:41).
Reported Exits, the Deeper Retracement, and the Gold Cross-Reference
The trade management he reports is brief and specific: a little retracement, about two points of movement against him, then a rally, with a first partial of a twelve-contract position (7:55), then two more exit steps he names (8:01). He says the move entered the shaded daily imbalance (8:11) and traded above the relative equal highs on the hourly chart (8:14). He then says the retracement went deeper than he was expecting, that he was looking for a particular area rather than that depth, and that he was fine with it and took no more trades (8:26 , 8:32).
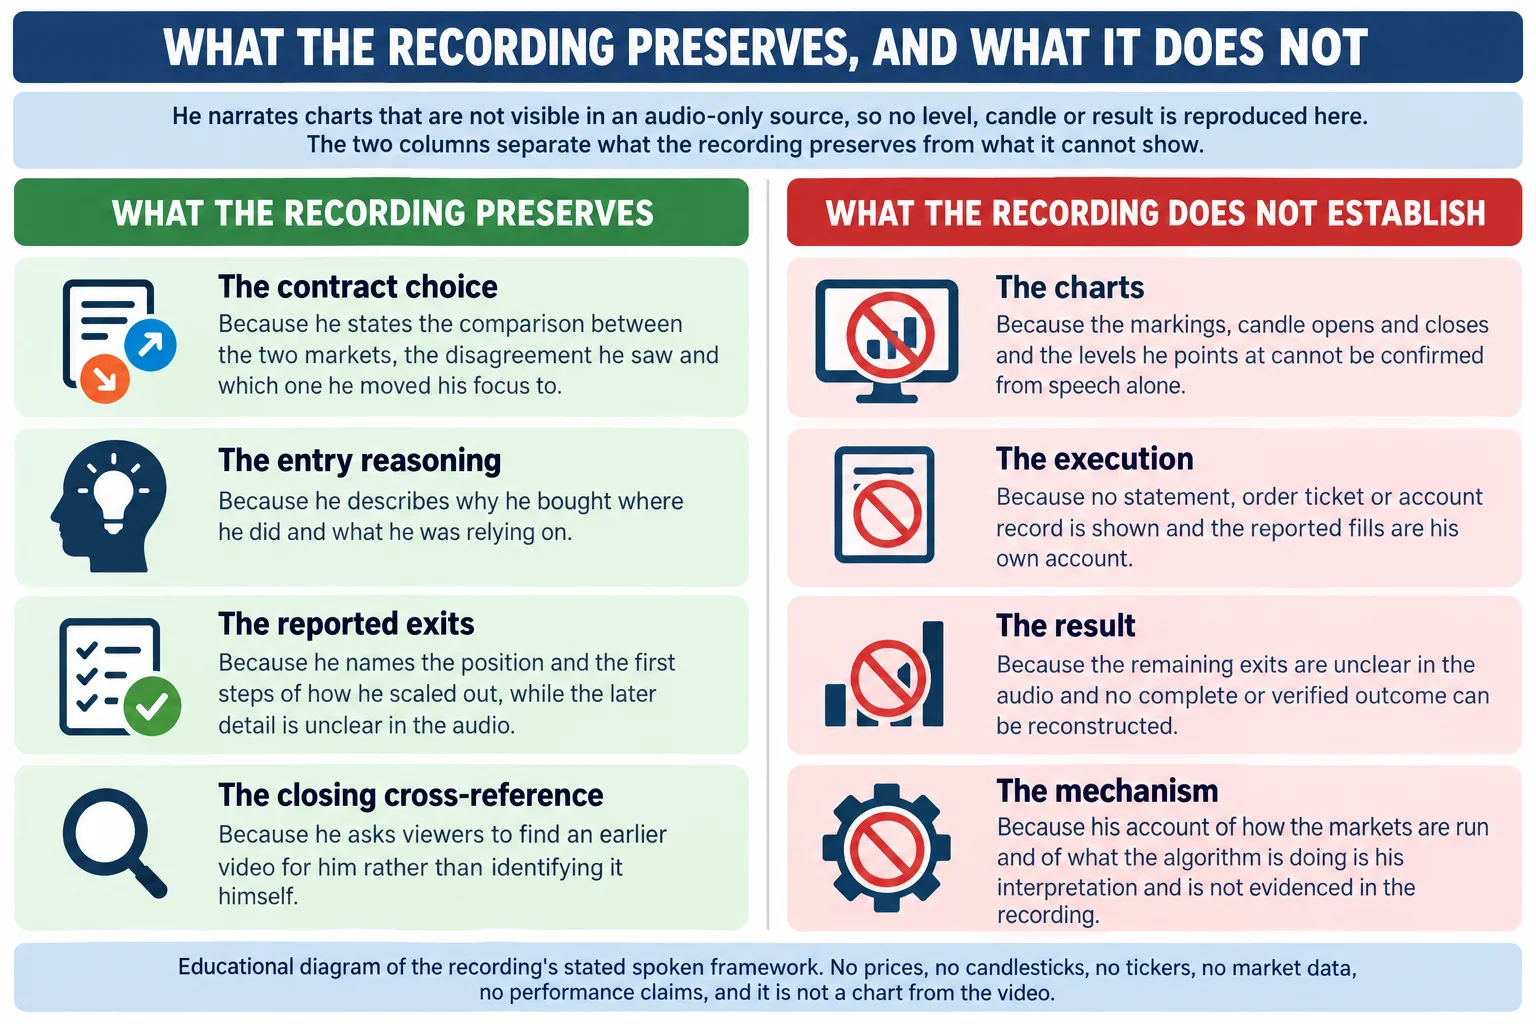
Two things belong with that account. The first is that the automatic transcription becomes unclear while he lists the remaining exits, so no reliable final exit or complete profit calculation can be reconstructed; what is reported here is only what the audio carries clearly. The second is that the reported entry, exits and drawdown are his own account of his own trading. The recording shows no statement, order ticket or account record, so nothing here should be read as verified execution or as evidence that the method is profitable.
The session also briefly refers back to an earlier discussion in which he says he was bullish on the dollar index and expected gold to go lower with sell-side liquidity swept (8:52 , 9:05 , 9:12). He asks viewers to find that earlier video for him rather than identifying it himself (9:17), and he invites them to check their gold charts against what he had said (9:48). Because the reference is not identified and the charts are not part of this source, it is recorded here as an unresolved cross-reference rather than as a documented forecast result.
What the Session Teaches and What It Cannot Establish
Read as education rather than as a trade call, the session is a worked example of how the speaker combines several ideas into one directional narrative: a higher-timeframe imbalance, an intermarket divergence, liquidity resting around similar lows, a fair value gap, a market-structure shift, and the structure he calls a bullish breaker. The practical content he adds is about selectivity between correlated instruments — comparing two markets and trading the one that is behaving relatively better — and about documenting the pattern on your own charts instead of taking his marked-up example on trust.
What the recording does not supply is any independent evidence that the comparison works, that the levels printed as described, that the entries and exits occurred at the prices he states, or that the outcome would repeat. Those are the speaker’s interpretations and reports, and they are presented here as such.
Watch the source recording
ICT Index Futures PM Session Review – July 05, 2022
The Inner Circle Trader · watch page lists publish 5 July 2022 at 15:36 PDT · 599 seconds, about 9 minutes 59 seconds · public, not unlisted. This recording is the primary source for every timestamp link on this page.
The recording is not embedded here. An embedded player was tested directly on 16 September 2026 from a BestProps page origin: the frame loads and then reports “Playback on other websites has been disabled by the video owner”, with no playable stream and no duration reported. The link above opens the recording on YouTube itself.
Resources
These are the sources checked while preparing this article. The two CFTC pages are the regulator’s fraud advisories on forex and on commodity trading systems sold online, and the Investor.gov page is the SEC investor-education entry on day trading. None of them evaluates this speaker, tests any of the concepts named in the review, verifies a level or a result, or endorses anything said in the recording. Any ICT, smart-money or third-party indicator, script, note set, chart annotation or re-upload circulating outside the publishing channel’s own page is unofficial and untested here.
- [1] ICT Index Futures PM Session Review – July 05, 2022 — The Inner Circle Trader (primary source; watch page read 16 September 2026, published 5 July 2022 at 15:36 PDT, listed at 599 seconds).
- [2] The Inner Circle Trader — official YouTube channel (read 16 September 2026) — the publishing channel for the 2022 mentorship index reviews this recording belongs to.
- [3] U.S. Commodity Futures Trading Commission — Fraud Advisory: Foreign Currency (Forex) Fraud (read 16 September 2026) — warns that the forex market is volatile and carries substantial risk, and that promises of profit are a common scam marker.
- [4] U.S. Commodity Futures Trading Commission — Fraud Advisory: Commodity Trading Systems Sold on the Internet (read 16 September 2026) — notes that hypothetical trading results are typically simulations over historical data rather than real fills.
- [5] U.S. Securities and Exchange Commission, Investor.gov — Day Trading (read 16 September 2026) — the regulator’s plain-language warning that day trading is extremely risky and can result in substantial losses in a very short period. Background only; it does not address this lesson.
Primary source: ICT, “ICT Index Futures PM Session Review – July 05, 2022”, The Inner Circle Trader; watch page publish 5 July 2022 at 15:36 PDT, listed at 599 seconds. The transcript used was local automatic speech recognition of the recording’s full original audio and is not human-verified captions, so ambiguous wording is qualified rather than corrected silently. The recording’s charts are not reproduced anywhere on this page.
This commentary is for education only and is not investment advice. Futures trading involves substantial risk, and neither the video nor this summary establishes that any pattern, level or model will be profitable.