
Key takeaways
ICT demonstrates a paper-traded August 17, 2020 EUR/USD setup on TradingView’s five-minute chart, using New York time and the Interbank Price Delivery Algorithm framework to form a bullish daily bias, treat the sweep below the August 16 low as a sell-side liquidity purge, and enter long after price returned to the Interbank Dealing Range and…
Read the full summary
ICT demonstrates a paper-traded August 17, 2020 EUR/USD setup on TradingView’s five-minute chart, using New York time and the Interbank Price Delivery Algorithm framework to form a bullish daily bias, treat the sweep below the August 16 low as a sell-side liquidity purge, and enter long after price returned to the Interbank Dealing Range and a bullish order block. The IDR uses the session high and low around eight a.m. through the eight thirty a.m. to eleven a.m. New York window, while the Optimal Trade Entry zone is the 62% to 79% retracement and requires three to five confirming algorithmic signatures rather than Fibonacci alone. ICT targets institutional EUR/USD levels ending in .80, .50, .20, and .00, with the example aiming for 1.1880, reaching about 1.1880 and 9 pipettes, and exiting at 1.1879 and 4 pipettes after capturing approximately 50 or more pips with progressive partial exits and no premature stop adjustment. Relative equal highs provide buy-side liquidity, bullish order blocks provide support after the sell-side purge, and the move above equal highs is classified as a sweep because the daily bias is bullish. Key walkthrough sections cover the midnight reset at 27 minutes 33 seconds, IDR at 41 minutes 9 seconds, Optimal Trade Entry at 44 minutes 30 seconds, institutional levels at 46 minutes 26 seconds, order blocks and equal highs at 48 minutes 24 seconds, and trade management at 51 minutes 5 seconds. ICT says the executions are educational paper trades, not live-account results or regulated financial advice, and presents them as proof of methodology execution rather than a trading endorsement.
How we researched this article
BestProps used document-based research from primary firm sources, checked September 25, 2026. The complete source list, scope, limitations, and commercial-state record appear near the end of this article.
Watch the primary source: ICT EUR/USD: Real Institutional Trading Example (Aug 17, 2020) the full annotated walkthrough on the five-minute EUR/USD chart.
Supporting timestamp links:
- 27:33: Midnight reset and daily high/low determination
- 41:09: Interbank Dealing Range (IDR) definition
- 44:30: Optimal Trade Entry: 62–79% retracement zone
- 46:26: Institutional price levels (.80, .50, .20, .00)
- 48:24: Bullish order blocks and relative equal highs
- 51:05: Trade management and partial exits
ICT Forex Trade Insights in Action
In this lecture, ICT walks through his August 17, 2020 EUR/USD trading example in detail, the same example he first shared as a live recording on that date. He shows the five-minute chart step-by-step and reveals the decision-making framework he was working within, including the daily bias, session structure, specific price levels, and trade management rationale. The lecture is a candid explanation of real market-making concepts drawn from his 1996 origin work, presented as evidence that the methodology is actionable, not merely theoretical.
Throughout the video, ICT makes clear distinctions between what he is demonstrating and what he is not: the executions shown are paper trades on TradingView’s paper-trading application, not live account results, and the lecture is structured to illustrate institutional concepts without providing regulated financial advice. He explicitly frames this as “proof of authorship and execution” rather than a live trading endorsement.
The lecture also serves as a rebuttal to critics who claimed ICT never showed real executions. ICT states he deliberately uses paper trades because, as he explains: “as soon as I start talking live funds then I’m in a dangerous part of education and I’ve already had a run-in with the Commodity Futures Trading Commission back in the 90s.” He further challenges other educators: “if you can prove that you made a hundred thousand dollars in trading in 2019 after taxes I will pay you one million dollars real money real [account]. I even showed the bank account. Not one person, not one could do it.”
ICT Institutional Market Delivery Concept
The central claim ICT puts forward is that the high and low of each 24-hour trading day in the FX market are algorithmically predetermined by central bank-level institutional participants before the New York trading day begins. He describes this as the "Interbank Price Delivery Algorithm" (IPDA), a recurring, time-driven process that books and delivers price across the trading day within a predictable structure.
ICT frames this as the foundation of his entire methodology: "I can see what's going to happen 90% of the time before it happens." He qualifies this by noting he does not trade every day. He cherry-picks days with all the structural signatures he looks for. He also emphasizes that while he calls it an "algorithm," this is his description of the systematic behavior of institutional order flow, not a claim about any specific coded system.
Key premise: “If you think about what we’ve seen in recent years with the euro and Swissy where it was de-pegged, go back and look at your charts and you’ll see that central banks can do whatever they want to do. No one polices the central banks. No one. No one audits them. No one sets the rules and says you can and cannot do this. This is their playground. This is their storefront.”
ICT Forex Daily Market Bias
ICT teaches that the daily bias (bullish or bearish expectation for the day) can be identified by analyzing the prior day’s price structure before the current trading day starts. On the August 17 example, the prior day (August 16) had established certain highs and lows that informed the bias heading into the new day.
He specifically identifies the low of August 16 as a reference point: "Midnight on the 17th, prior to that, low, so this is the lowest trading point on the 16th and we transitioned into the New York midnight hour. At this moment, this is when all the banks come online and reset and peg the daily high and the low. Whether you want to believe it or not, that's really what goes on at this moment. The highest high and the lowest low of the next 24 hours is going to be predetermined."
ICT Midnight Reset and Predetermined Ranges
At the midnight hour (New York midnight transitioning from the 16th to the 17th), institutional participants reset and establish the framework for the upcoming day. ICT describes this as the moment when "all the banks come online and reset and peg the daily high and the low." He frames the prior day's high and low as structural reference points that inform the new day's direction.
ICT Forex Market Liquidity Sweeps and Purges
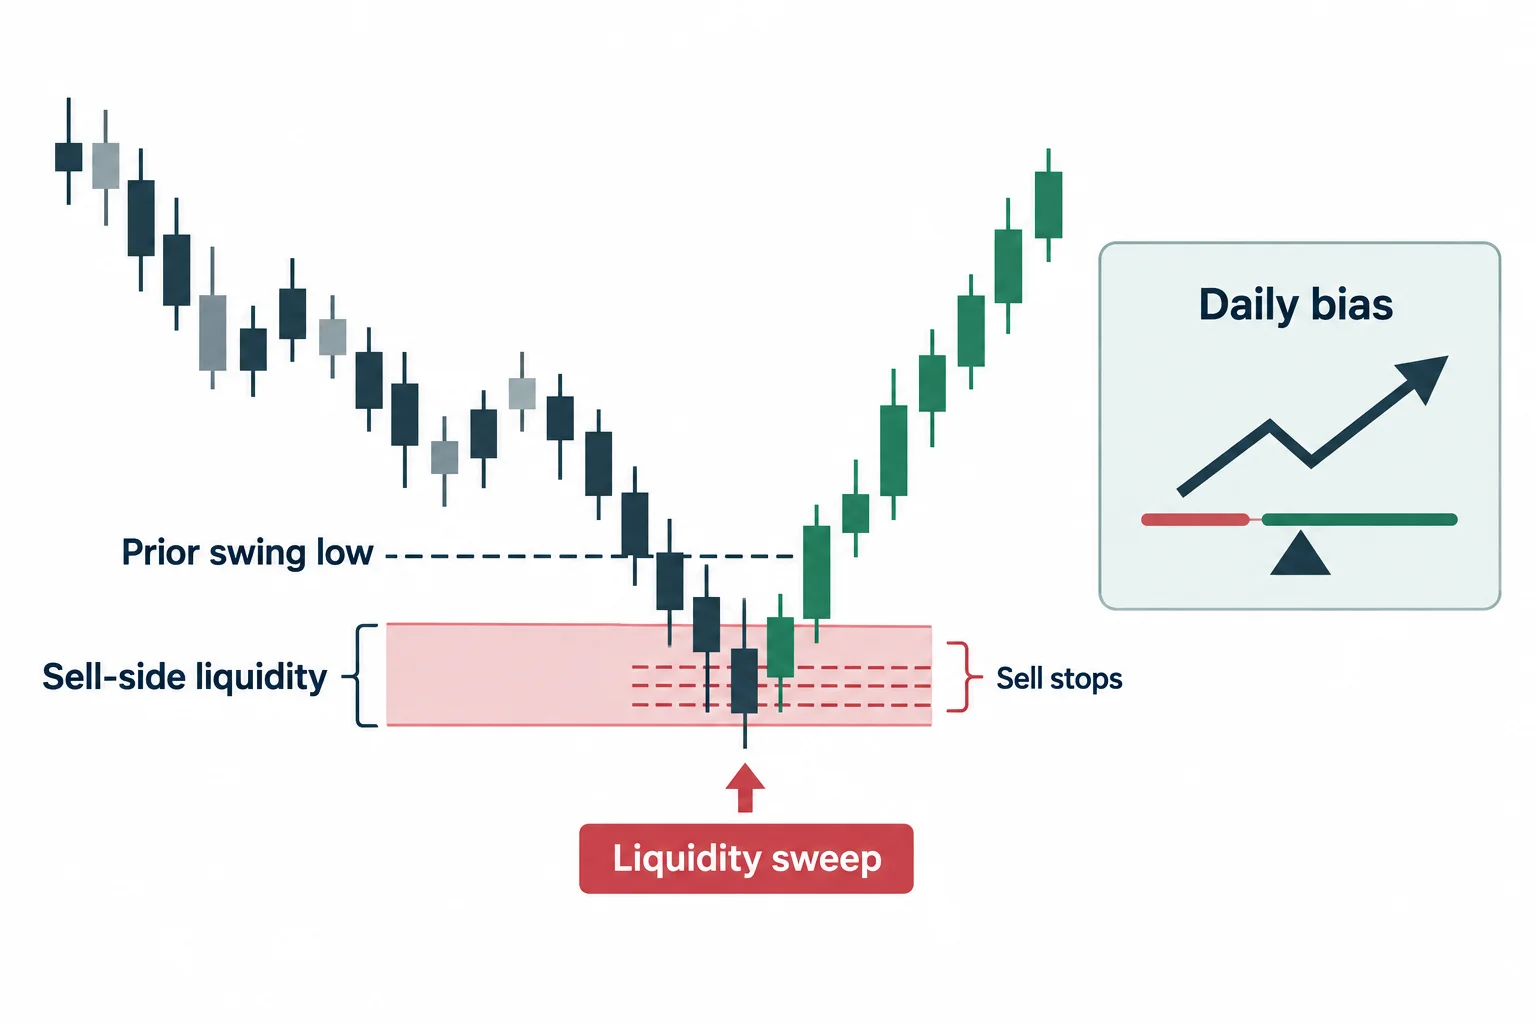
One of ICT's core distinctions in this lecture is the difference between a liquidity sweep and a liquidity purge, a distinction tied directly to the daily bias. Both involve price running through zones where retail stop-loss orders are clustered, but their implications differ depending on the directional context of the day.
ICT Sell-Side Liquidity Sweep
A liquidity sweep (or “stop run”) occurs when price breaks below a prior swing low, triggering sell-stop orders clustered below that level. This clears liquidity and can cause a short-term move in that direction, but the daily bias may still be intact. ICT describes the initial move down on August 17: “It continues into a small consolidation, trades just slightly above the 16th high, and then trades aggressively lower down into 4:30 a.m. New York time. It runs the previous day’s low. Resting below this is sell-side liquidity. What is sell side liquidity? It’s sell stops, orders to sell short on a break below that level. Once it goes below that, it purges that liquidity.”
ICT Sell-Side Liquidity Purge
A liquidity purge occurs when a stop run below a prior low is consistent with the daily bias, meaning institutional participants are not reversing direction but are simply clearing excess sell-side orders before continuing in the primary direction of the day. ICT explains: "Sweeping stops can still be traded lower in this example here. Much in the same way this high here, it's swept and then goes lower. But the daily candle is predetermined to be bullish." He clarifies in his notes: "Stop sweeps above an old high or below an old low. They can still be traded through at a later time. A purging of liquidity is in line with the daily bias."
On August 17, the sweep below the prior day's low was a purge, not a reversal, because the daily bias was bullish. ICT states: "The previous low on the 16th is swept. When that is swept and the daily bias is bullish, this is no longer just a sweeping of stops (purging of stops)." The subsequent bullish price action confirmed this interpretation.
ICT Forex Interbank Market Range
Once the 8:30 a.m. New York time news embargo lifts, institutional algorithms begin calibrating price within the New York session's internal range, what ICT calls the Interbank Dealing Range (IDR). The IDR is defined by the highest high and lowest low formed between 8:00 a.m. and the start of the New York 8:30 news window, through the early NY session up to approximately 11:00 a.m.
ICT explains: "Between 8:30 and 11, that's your New York session. And we have a high here. And prior to that high, we have this low. So this low and this high (this is your interbank dealing range). Your interbank dealing range high here and your interbank dealing range low here." He clarifies why he uses the 8:00 candle low rather than a later low: "At 8 o'clock, at 8 o'clock, that's this candle here. Its low is only here. At 8:10, we have this low. So you have to use that low for your dealing range low."
ICT stresses that all timing in his methodology uses New York time on TradingView: “If you are setting your TradingView time to this, try not to use your local geographic time like your local whatever it is time-wise where you live and reside, don’t set your TradingView to that. You want to set it to New York time. If you do that, everything in your charts will be in alignment with how I teach and how the actual interbank algorithm delivers.”
ICT Forex Optimal Trade Entry Zone
Within the IDR, ICT identifies the optimal trade entry zone as the 62% to 79% Fibonacci retracement of the range, a premium/discount zone where price tends to reverse in the direction of the daily bias. ICT demonstrates this on the August 17 chart: "From this low to this high, you're waiting for it to retrace down into an optimal trade entry, which is the 62 to 79 percent retracement level."
He notes that the Fibonacci tool is a teaching and illustration aid, not the core skill: "The Fib is just a way of providing a framework for new students. I don't sit down and put a Fibonacci on a chart before I take a trade. I use it to help illustrate to my students a range that that is a premium or a discount, and simply meaning, are we overbought, oversold without the use of an overbought, oversold indicator? There is no indicators on my charts."
He also clarifies that he does not always enter solely on the optimal trade entry zone. He looks for multiple overlapping confirmations: "I mentioned already the FIB is not the secret. That's not what it is. I'm not entering always just on optimal trade entry. I'm looking for other factors." ICT states he requires "three to five specific signatures" that confirm the algorithmic price delivery before taking a trade: "If I don't get them, or let me say it this way, if I don't have a number of them (what number?). Three to five specific signatures that I look for in the algorithmic price delivery. I won't take the trade."
ICT Institutional Forex Price Levels
ICT identifies the .80, .50, .20, and .00 price levels in EUR/USD (and analogous levels in other pairs) as primary institutional price objectives. These levels act as key turning points and targets because large institutional orders are clustered at round-number price levels: “Your .80 level, your .50 level, your .20 level, and your .00 levels are all institutional levels. Now they are not the only institutional levels, but predominantly they are the ones. If you have them on your chart, you’re going to see key turning points and targets being traded to at these levels.”
He demonstrates this on August 17: "Above these relative equal highs, if we're bullish, and we are, reaching above these (an institutional price level, a .50 level or an .80 level or a .00 level). If you use that as a target, many times you're going to get really, really close to the daily high and the low. Again, it's not exactly at .80, it's not exactly at .50, it's not exactly at .20, but they are your general rules of thumb."
On August 17, the EUR/USD daily high reached approximately 1.1880, matching the .80 institutional level. ICT shows the alignment: “What’s the high on this candle here? 1.1880 and 9 pipettes. So we were off by eight pipettes with the fib, but still reaching for the .80 level.” The actual exit was at 1.1879 and 4 pipettes.
ICT Forex Order Blocks and Equal Highs
ICT describes a bullish order block as a down-close candle within the IDR that acts as a support zone when price retraces back into it, specifically after the low of the range has been swept and purged. On August 17, he identifies the entry zone: "It trades down into relative equal lows here and a high prior to that low being ran. So this low that took out liquidity here (this is a bullish breaker, this candle right here)."
Relative equal highs (REH) represent buy-side liquidity above the IDR high. Retail traders often see a double-top pattern at REH and expect a reversal down. ICT explains how institutional algorithms exploit this: "So traders are gonna look at that as what retail resistance. That's a double top baby, you can get short and hold for the lows down here to be taken out because guess what supports down here? So it's going to trade down there because that's how trading ranges work." He candidly admits: "I fell for all that stuff too."
Because the daily bias was bullish, running above the REH was not a buy-side purge but a sweep. Price reached the area, cleared buy stops, then reversed. ICT notes: "Now this run above is not a purging of buy side liquidity. Why? Because the daily candle is expected to be bullish. So this is a sweeping on stops."
ICT Forex Trade Execution and Market Management
ICT narrates the actual trade sequence on the five-minute chart: after price swept the August 16 low (purge, not reversal), traded back into the IDR, and reached the optimal trade entry zone within a bullish order block, he entered long. His entry was in the zone of the last up-close candle prior to the range low, combined with the order block context.
He managed the trade with patience: "I'm waiting for price to show me it wants to go higher, and as long as it's doing that and price is booking higher, the algorithm is doing what I think it's going to do. So I'm in alignment. I'm not offside, I'm in alignment with IPTA, the Interbank Price Delivery Algorithm. As it trades down to this level here, I'm waiting for it to launch." He deliberately did not raise his stop prematurely: "Notice also I'm not in a hurry to raise my stop."
His target was the .80 institutional level at 1.1880. The paper trade exited near 1.1879: “I was waiting for that limit move. You can see it in the recording. It just simply would not let me out at the 1.1880 level. But, whatever. I collapsed it and it retraced. Very close to the .80, huh? 1.1879 and 4 pipettes.” ICT captured a move of approximately 50+ pips from the entry zone to near the target.
The partial exits were taken progressively as price moved in his favor: “And then finally collapsing it.” He describes the partial management approach as standard practice rather than holding a full position to the target.
ICT Trading Example Clarification
ICT is explicit that these executions use TradingView's paper-trading function, not live funds: "Every example you see me showing you on TradingView, when you watch the trade examples, I'm actually using the paper trading application on TradingView because everyone will understand that that example was a paper trade. It was not taken with live funds, and it's also not indicative of future results." He adds: "I absolutely am not a fan of that when you're a student. You're minimum a year away, period." The lecture is educational illustration, not financial advice or a verified live trading record.
ICT Forex Market Insights From the EUR/USD Trade
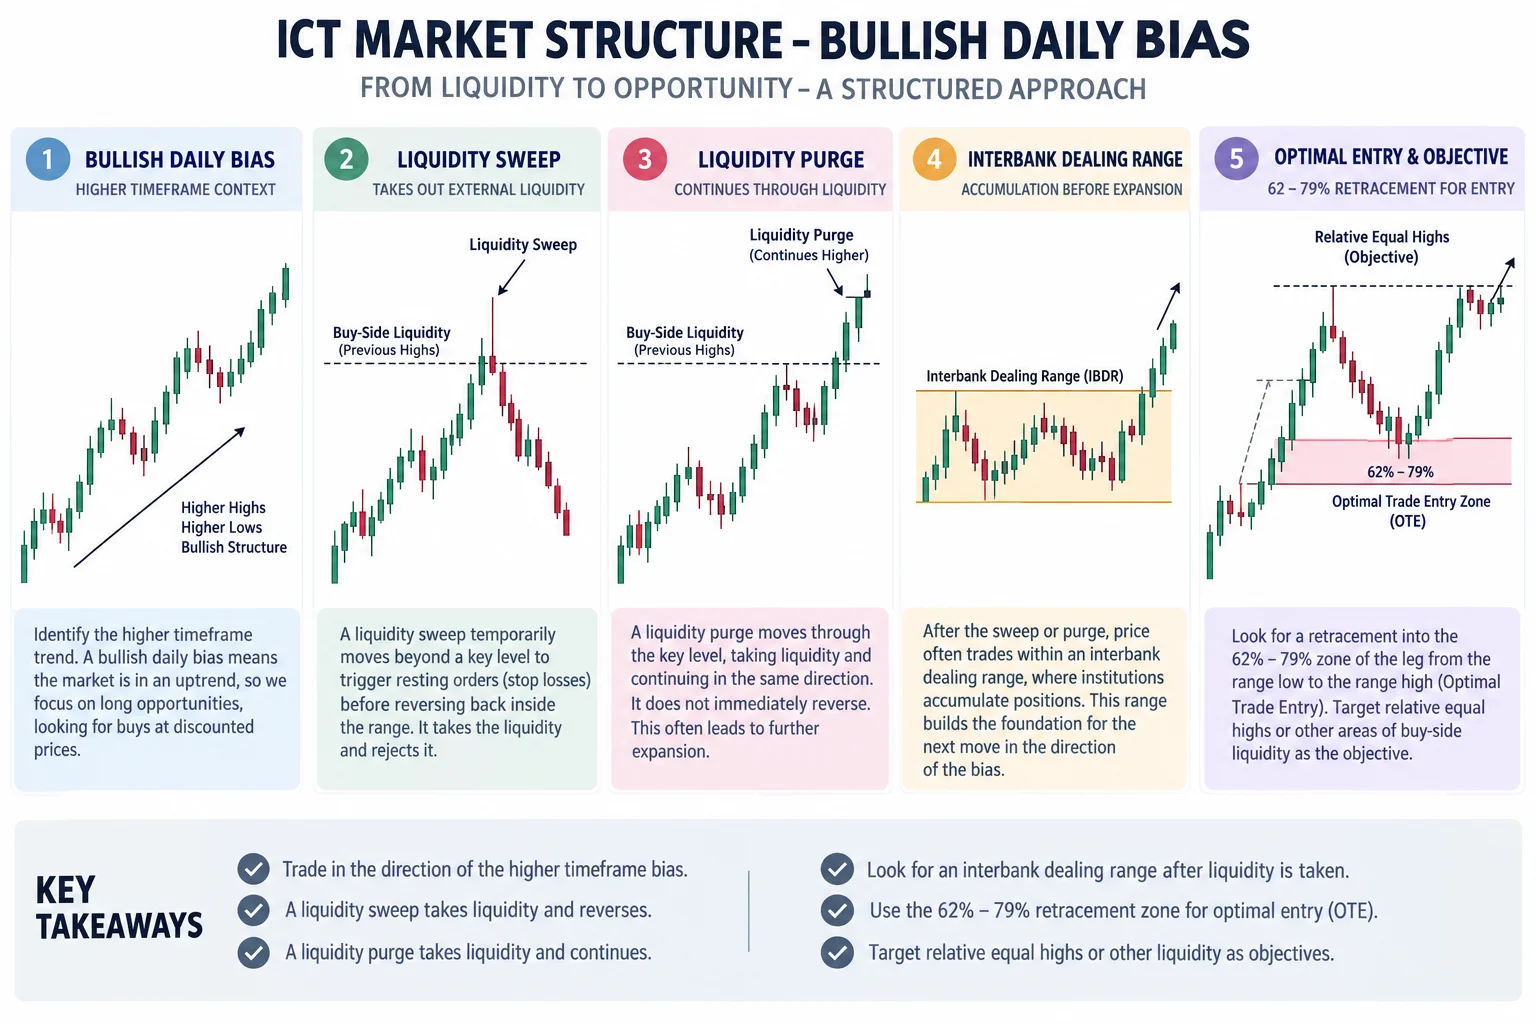
- Daily bias is established before the trading day begins The predetermined high and low of the day are identified through the prior day's structure and the midnight reset behavior.
- Distinguish sweeps from purges A liquidity run consistent with the daily bias is a purge and signals continuation; a run against the daily bias may be a sweep leading to a reversal.
- The Interbank Dealing Range sets the NY session structure The 8:00–8:30 to 11:00 range defines the IDR high and low, which frames optimal entry zones.
- Optimal entries require multiple confirmations ICT looks for three to five overlapping signatures before engaging; the 62–79% retracement zone is one component, not a standalone signal.
- Institutional levels (.80, .50, .20, .00) are key targets These round-number price zones align with daily highs/lows and provide objective profit objectives.
- Bullish order blocks form after purge conditions A down-close candle following a liquidity purge within a bullish daily bias identifies a high-probability long entry zone.
- Management is patient and systematic Stops are not moved prematurely; partial exits are taken as price moves in favor rather than holding a full position to the target.
ICT Forex Concepts for Systematic Market Precision
This August 17 EUR/USD lecture is notable because ICT walks through the entire decision tree (from daily bias identification through the NY session structure, IDR definition, entry confirmation, and trade management) in real time on a five-minute chart. He is transparent about what he is doing and why at each step.
The lecture also carries a meta-message: ICT is demonstrating that the concepts he teaches are grounded in a coherent, repeatable framework. He invites students to recreate the annotated chart in their own platform and cross-reference it with the original August 17 trade recording. The combination of the annotated five-minute walkthrough and the original execution recording gives a fuller account of how the framework translates into actual market engagement.
As ICT summarizes: "If you can dispense your disbelief and accept for the sake of this discussion that the high and the low is predetermined, imagine what opportunities open up to you. It's not the lottery anymore, is it? It's something that repeats over and over and over again." Whether or not one accepts the full IPDA premise, the structural methodology described (session ranges, retracement zones, institutional levels, and liquidity context) represents a systematic approach to intraday FX analysis that can be evaluated on its own merits against price data.
ICT Forex Market Resources
Primary source: ICT, “ICT EUR/USD: Real Institutional Trading Example (Aug 17, 2020),” uploaded September 21, 2020. The executions shown are paper trades on TradingView and are not live account results. This content is for educational illustration only and does not constitute financial advice.
Investopedia: Liquidity: General overview of liquidity concepts in financial markets. Note: ICT’s specific application of liquidity dynamics to intraday FX and his institutional framework are not endorsed or verified by this resource. https://www.investopedia.com/terms/l/liquidity.asp
Investopedia: Fibonacci Retracement: Explains standard Fibonacci retracement levels (23.6%, 38.2%, 50%, 61.8%, 78.6%) and their use in identifying potential support and resistance zones. Note: ICT’s specific application of the 62–79% zone within his methodology is not part of the standard Investopedia framework. https://www.investopedia.com/articles/forex/081515/how-use-fibonacci-trade-forex.asp
Babypips: Fibonacci in Forex: Educational resource on how Fibonacci tools are applied in forex trading, including retracement and extension levels. No