
Key takeaways
ICT’s 32 minutes 34 seconds lesson presents his personal daily-to-four-hour analysis routine, not a validated system or recommendation.
Read the full summary
ICT’s 32 minutes 34 seconds lesson presents his personal daily-to-four-hour analysis routine, not a validated system or recommendation. He first takes commercial hedgers’ highest and lowest net positions from 12 months of COT data, or six months if needed, and uses the midpoint as his own zero line, then carries monthly and weekly bias into the daily chart. Open interest matters only when it falls about 15% or more at a higher-timeframe discount array, which he calls extremely bullish, or rises about 15% or more at a premium array, which he calls extremely bearish. He reads institutional order flow through up-close and down-close daily candles, forecasts weekly profiles from the economic calendar with stated confidence near 60% on Monday and 70% if Tuesday moves against his view, tracks Sunday open and Monday midnight New York open, confirms with SMT divergence between correlated markets such as the dollar and cable, frames structure with daily breakers and mitigation blocks, and maps available premium and discount arrays into the four-hour chart before rounding levels to the nearest ten or five. A bullish bias requires price to reach a discount array at a relevant time of day, while a bearish bias requires a premium array, so bias does not mean trading every day. ICT says the lesson contains no charts, admits he can be wrong, and reports two or three low-resistance liquidity-run setups that failed.
How we researched this article
BestProps used document-based research from primary firm sources, checked September 24, 2026. The complete source list, scope, limitations, and commercial-state record appear near the end of this article.
This article is a source-grounded reading of 0:10, the third lesson of the August 2017 mentorship release and part of the core-content month covering short-term top-down analysis. The recording runs 32 minutes and 34 seconds, the watch page gives an upload time of 29 October 2022, 1:08 p.m. Pacific, and the article is built from the recording’s full 888-segment timestamped English caption track rather than from its title or description. It is a description of one trader’s analytical routine (how he says he arranges his own work), not evidence that the routine produces a repeatable edge, and not a recommendation to copy it.
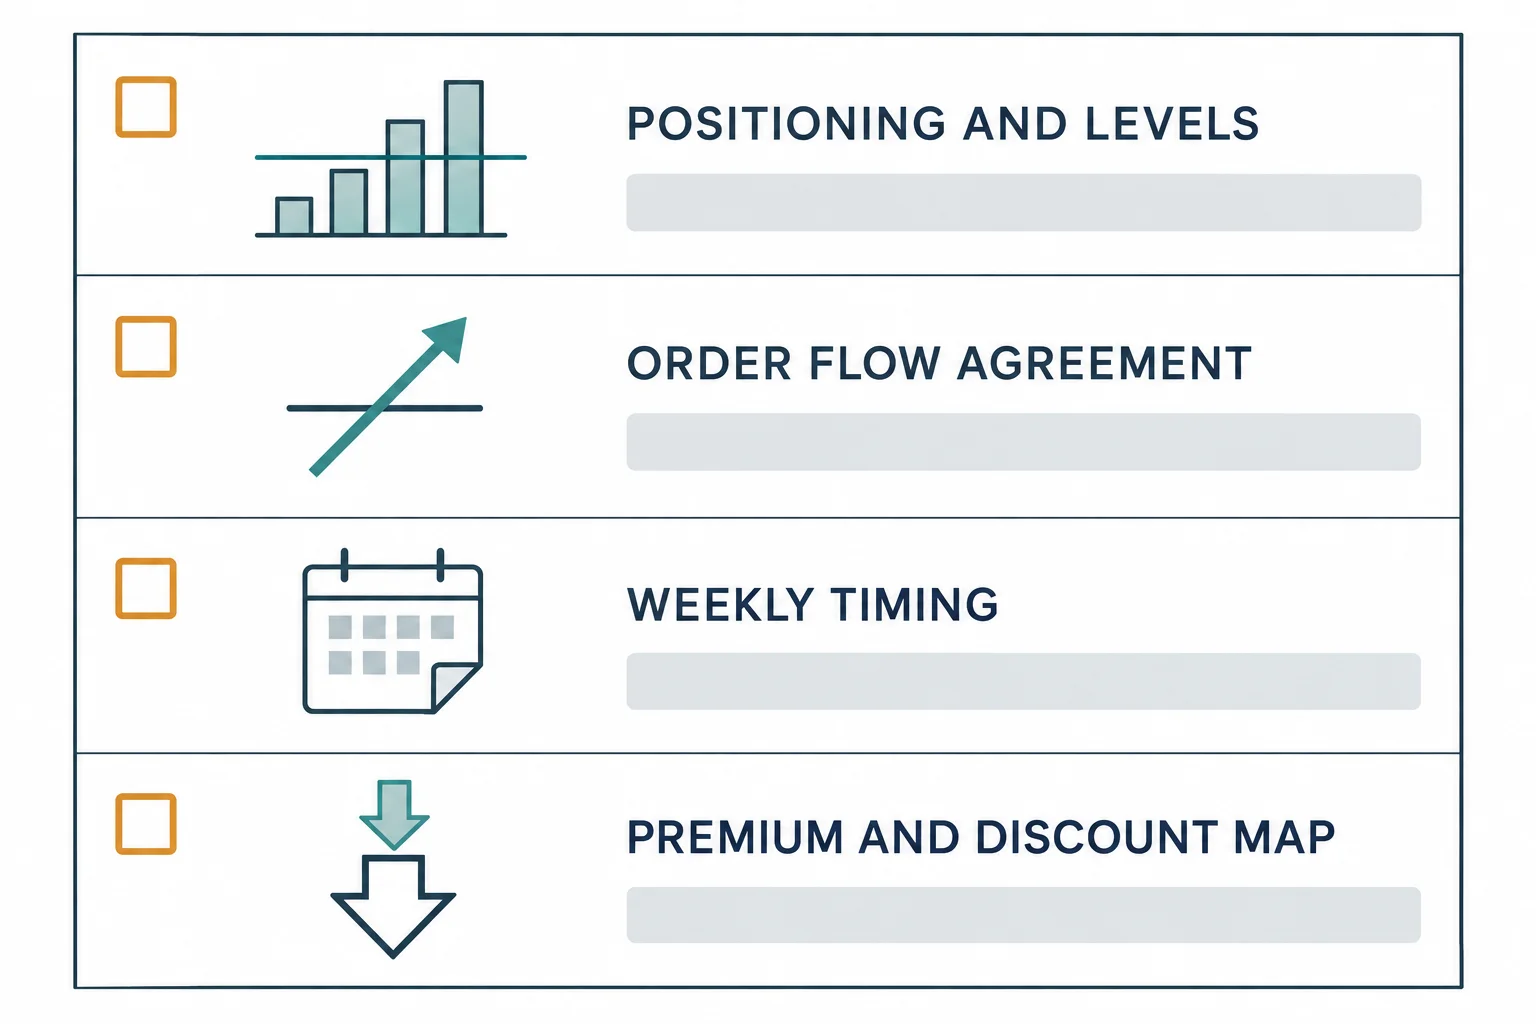
How ICT Short Term Analysis Frames the Lesson
He opens with a disclaimer about scope. At 0:39 he says the material is “my specific approach to it” from among all the ways the concepts could be used, and that it is not meant to imply this is the only way (0:46). At 0:58 he calls it his personal approach after more than twenty years, and says the monthly and weekly presentations he made in the two lessons before this one are all the higher-timeframe work he does (1:08), “what you’re about to see here is all I do” (1:23).
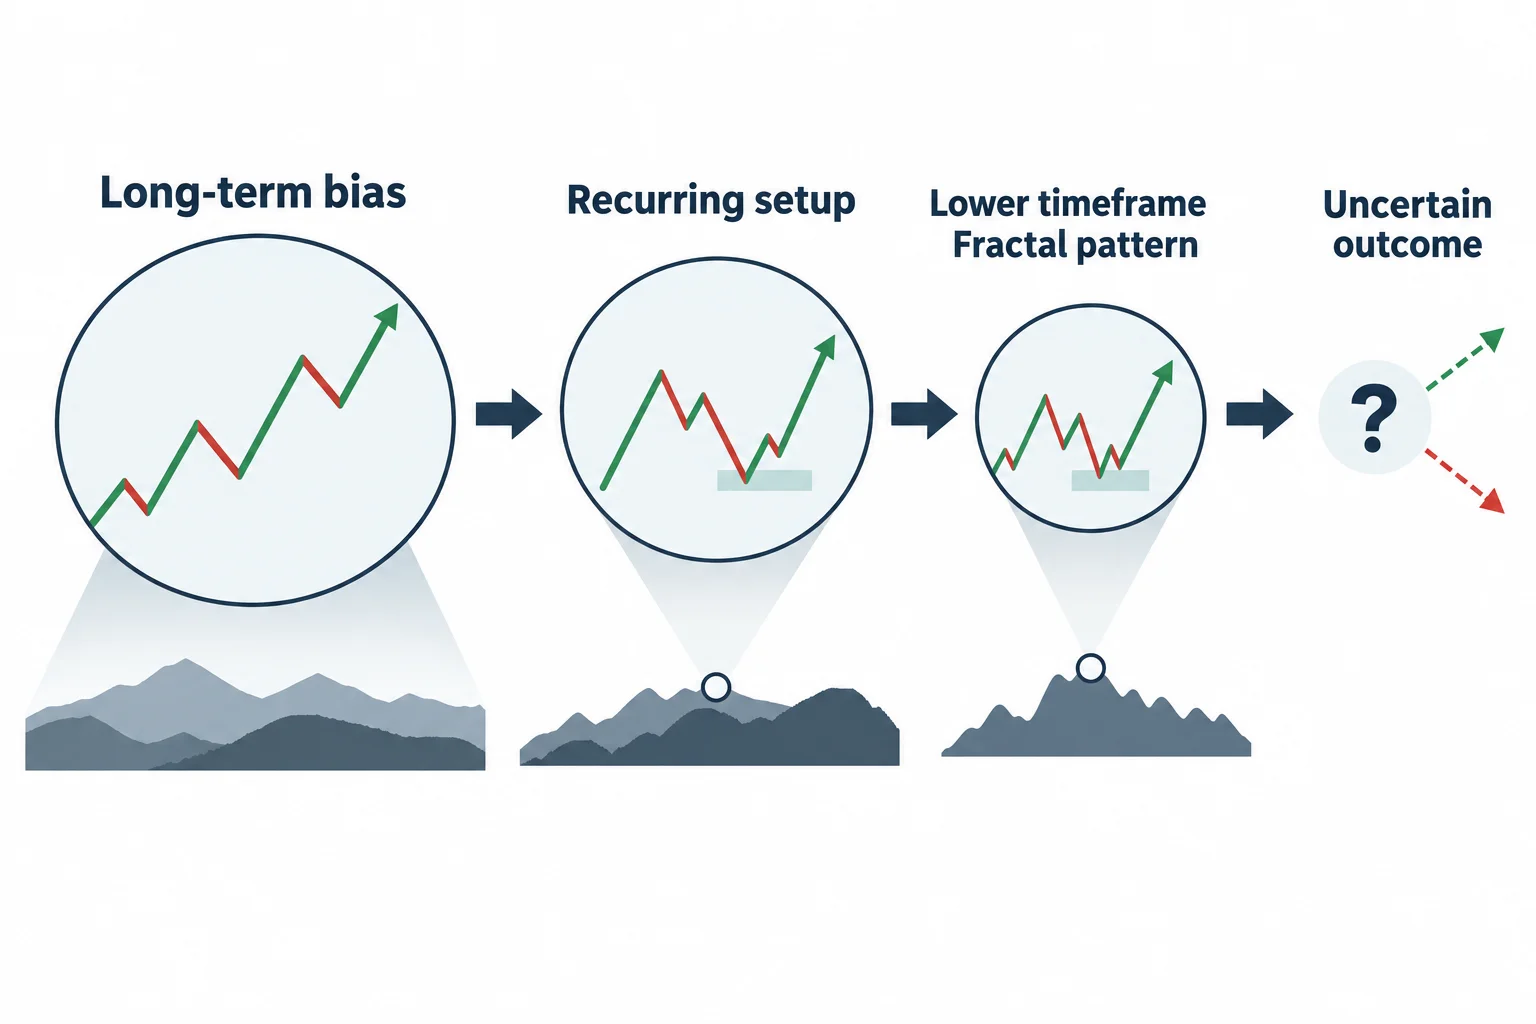
He sets the internal structure at 1:56: look for a long-term condition or bias, look for a recurring stage or setup, then move to a lower timeframe and execute on the same pattern, “so everything is fractal” (2:14). He is also explicit that this is not a certainty machine. At 2:31 he says he is “always unsure just like anybody else” about the outcome and that he has to be selective rather than forcing a view every day (2:47, 2:56). He adds that there is a specific time window worth focusing on and that trying to trade every day is what he associates with retail behaviour, whereas the larger participants wait for conditions and levels they have already determined (3:05).
The ICT Daily to Four Hour Analysis Workflow
ICT Commercial Hedging Comes First
He starts on the daily chart by asking what “smart money” is doing, using Commitment of Traders data for the market in question, he names the 30-year Treasury bond as his example (3:53, 4:38). He takes the highest high and lowest low of the commercial hedgers’ net position over the preceding 12 months, or six months if that range is too narrow to read, and divides it in half (4:57, 9:45, 5:03). That midpoint becomes his own zero line: above it he treats the reading as bullish, below it as bearish, regardless of where the published zero line sits (4:54, 5:05).
That convention is worth labelling clearly. The transcript states the rule and nothing more; it contains no test of it, no sample of past readings, and no evidence that commercial positioning at a 12-month midpoint predicts direction. It is his framework for organising an opinion, and it is presented here as such.
Carry Monthly and Weekly ICT Analysis Down
At 5:15 he says all monthly and weekly analysis has to be carried into the daily timeframe, because that is what supports a belief that the bias is bullish or bearish, and that he prefers the daily to confirm it (5:27). He warns against reading lower timeframes in isolation: without knowing what the daily implies, what looks bullish on a four-hour or hourly chart may be a setup to be short from the daily perspective (12:37, 12:48).
How ICT Uses Open Interest in Two Situations
Open interest is the next input, and he is specific about how rarely he uses it. He says he is not concerned with it before reaching the daily chart (10:46), and once there he applies only two conditions: a decline of about 15% or more while price is at a higher-timeframe discount array, which he calls extremely bullish, and an increase of about 15% or more while price is at a higher-timeframe premium array, which he calls extremely bearish (11:04, 11:15, 11:20). If neither condition is met he does not refer to open interest at all (11:28, 11:34).
ICT Daily Order Flow and Institutional Sponsorship
At 11:41 he describes the candle behaviour he reads as institutional order flow. When the monthly or weekly is bearish he wants the daily finding resistance at up-close candles and moving through down-close candles; when the higher timeframes are bullish he wants support at down-close candles and movement through up-close candles (11:51, 11:57, a bullish example at 12:05). He calls the daily order flow the most important one to know and says that if a viewer will not look at higher timeframes they should at least start on the daily (12:15, 12:39).
Earlier in the sequence he frames the same idea as sponsorship: at 6:03 he says he wants to see institutional sponsorship behind price action, and that without it a setup is probably low probability (6:10). The captions do not establish that particular institutions can be identified from candles; what they record is a reading convention he applies to price.
ICT Weekly Profiles and the Economic Calendar
He then tries to anticipate which weekly profile is likely, using the economic calendar to frame the drivers (6:23, 6:28), and says that if he cannot arrive at a profile he works from his best assumptions and corrects them later in the week from the calendar (6:36). He also mentions the Monday-Tuesday-Wednesday pattern he likes for a single-shot setup (6:46).
He describes how he internalises the weekly range: typically formed between Tuesday and Thursday, with a Monday low possible, Tuesday and Wednesday carrying the expansion and Friday often a retracement; in a bearish week he pictures Tuesday making the high and Thursday’s New York open making the low, with Friday and Monday acting as consolidation and a possible power-three enclosure (14:23). He is direct about the limits: the calendar is the only forecasting aid he has (14:50), there is no cookie-cutter approach (15:00), and he has never been able to build a systematic way to forecast weekly profiles. By Monday he puts his odds at about 60% of knowing, rising to about 70% if Tuesday goes against him (18:28, 18:41, a later caution at 17:12).
He adds a practical restraint: he prefers to study the whole week’s calendar during the weekend before the market opens rather than on the day (15:22, 17:35), and he is willing to give up the Monday low of the week because he expects Tuesday or Wednesday to offer the entry off it (15:28, 15:42). He also tracks two opening references across the week (the Sunday opening price and the Monday midnight opening price in New York time) and wants to see price move below them toward a discount array when bullish, or above them toward a premium array when bearish (19:08, 20:03, 21:18).
ICT Intermarket Confirmation
At 21:31 he looks for SMT divergence between correlated markets, describing a dollar making a higher high while the cable fails to make a lower low, or a failed higher high in the dollar after a lower low in the cable, which he links to a liquidity run on stops and a possible long (21:47, 22:02). He says he looks for this specifically between the daily and four-hour charts because that is where he considers it most effective (22:04).
Intermarket analysis is offered as confirmation of an opinion already formed, not as a standalone signal, and the transcript provides no measurement of how often the divergence resolves as described.
ICT Market Structure Breakers and PD Arrays
He says he defines current market structure while watching for breakers and mitigation blocks, and that he wants daily breakers more than any other timeframe because they mark where the next intermediate-term swing may form (7:30, 22:20). His suggestion for “training wheels” is to trade between a daily bullish breaker and a daily bearish breaker, since the bulk of the range sits between those two references and the flow tends to be one-directional (22:32, 23:42).
From there he works from the daily into the four-hour chart, marking the premium and discount arrays that are actually present (23:54). He notes that not every array will exist in every situation (a fair value gap, liquidity void or mitigation block may be missing) and that the ones present should be highlighted so that other signals can later be read against them (24:03, 24:08, 24:21). He closes the sequence by calibrating those levels to the nearest ten or nearest five level around the arrays he has marked (24:47, 24:59).
What Daily Bias Means in ICT Analysis
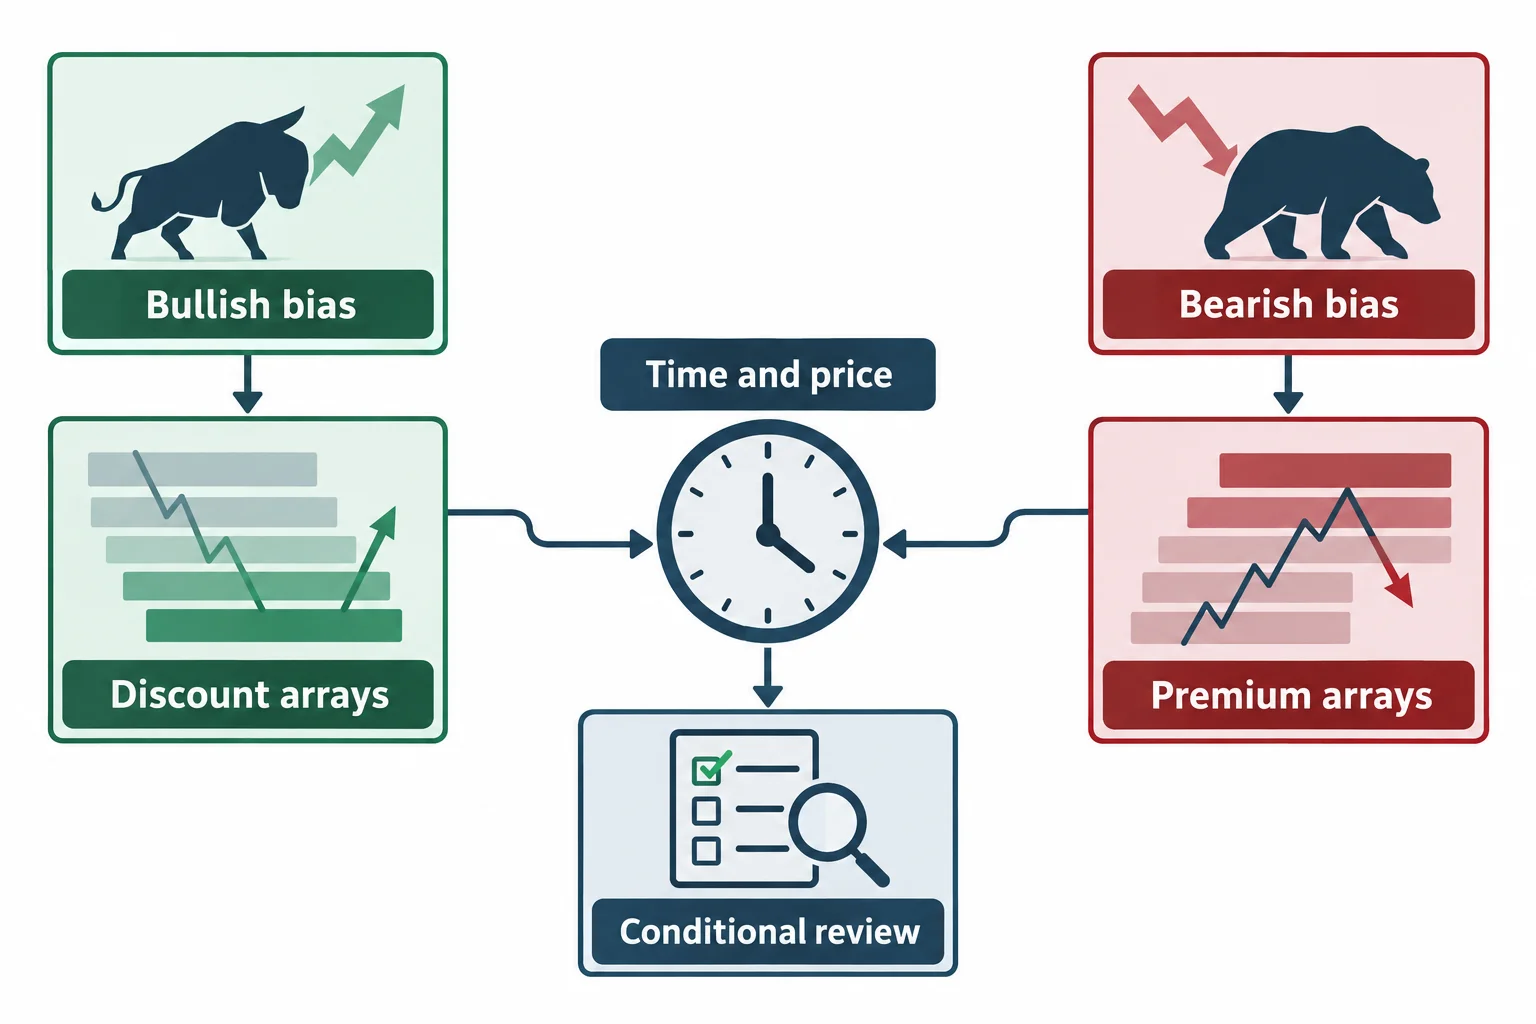
The lesson’s decisive qualification comes at 25:08. He says he is asked constantly how he knows the daily bias, and that people outside his group assume a bullish daily bias means buying every single day, which he calls retail thinking (25:18, 25:28). His answer is that a bullish reading still requires price to reach some measure of a discount array at a specific time of day, and that while the economic-calendar manipulation element is not strictly necessary, it is usually better if it occurs (25:33, 25:42).
He restates it as a rule: bullish means waiting for discount arrays to be traded to and then executing, bearish means waiting for premium arrays to be tagged at a specific time of day, so that time and price meet (26:03, 26:12, a recap of the whole sequence at 26:26). Read plainly, “bias” in this lesson is a filter that narrows which scenarios he will consider, not a forecast of the next session’s direction.
How the ICT Short Term Analysis Workflow Ends
He ends with two admissions that shape how the lesson should be read. First, at 27:42 he says he has provided no charts and no hand-holding, and that written study material does nothing for someone who has not worked through the earlier months. The analysis has to be done repeatedly (27:47, a later note on written material at 30:56). Second, at 29:16 he says a strong opinion is not an invitation to put money in or to copy him, and that he can still be very wrong (29:22, 29:30): he has used the phrase low-resistance liquidity run on setups that did not pan out, and he counts two or three of them (29:36, 29:44).
He compares it to a roulette table where the green can always come up and says a loss somewhere is unavoidable rather than something to fear (29:52, 30:05). He also points to the PD array matrix as what he considers the missing element for people learning his concepts, and to the question of which order block to use as answered by working from the entire timeframe structure down (32:11, a mention of market-maker buy and sell profiles at 31:21). The next lesson, he says, is where he gives his own trading patterns (the setups he says he actually trades (28:45, 28:59)), and he signs off until then (32:30).
Watch the ICT Short Term Analysis Recording
Watch the original lesson on YouTube
This recording cannot be played inside another website. Its embedded player was loaded from a BestProps origin and clicked on 15 September 2026: it reported “Video unavailable” and “Playback on other websites has been disabled by the video owner”, with no duration and no playback progress. The recording’s own watch-page data agrees that it is not playable in an embed, so no iframe is placed here. The video itself is public and available directly on YouTube.
Watch ICT Mentorship Short Term Top Down Analysis on YouTube ↗
ICT Short Term Analysis Sources and Further Reading
- ICT Mentorship Core Content (Month 12, Short Term Top Down Analysis) the primary source and the only recording used here. Uploaded 29 October 2022; watch page read 15 September 2026. Use the timestamp links above to compare each step with what he actually said.
- The Inner Circle Trader YouTube channel the publisher’s own channel, where this core-content month and the lessons it refers back to are posted. Unofficial reuploads and summaries are not the source used here.
- CFTC (Commitments of Traders) The regulator’s own reports and explanatory material for the COT data this lesson builds its first step on, including the commercial-versus-speculator categories. The page does not validate the 12-month midpoint rule he applies to it.
- CFTC (Fraud Advisory: Commodity Trading Systems Sold on the Internet) Regulator guidance on retrospectively presented methods and on the execution and risk assumptions such presentations tend to omit. Relevant to reading any stated sequence of analysis steps as a system.
BestProps is not affiliated with the Inner Circle Trader or the CFTC, and no source listed here endorses this article. Commercial hedging, COT midpoint, open interest, institutional order flow, weekly profile, SMT divergence, breaker, mitigation block, PD array and premium and discount array are used as descriptive terms for what the recording teaches. The thresholds, the session timings, the probability estimates and the analysis sequence are the speaker’s own conventions, and nothing here tests whether they work: this lesson contains no charts and no results by his own statement. This is independent educational commentary, not official ICT material, not a tested trading system and not investment advice. Leveraged futures and forex trading involves substantial risk and is not suitable for everyone.