
Key takeaways
ICT Mentorship Core Content Month 12 Intraday Top Down Analysis is a roughly 65-minute lesson uploaded 30 October 2022 in which ICT presents his personal top-down routine, forming directional bias and classifying PD arrays on the four-hour chart using prior monthly, weekly and daily analysis, then selecting the 60-, 30-, 15- or five-minute chart according…
Read the full summary
ICT Mentorship Core Content Month 12 Intraday Top Down Analysis is a roughly 65-minute lesson uploaded 30 October 2022 in which ICT presents his personal top-down routine, forming directional bias and classifying PD arrays on the four-hour chart using prior monthly, weekly and daily analysis, then selecting the 60-, 30-, 15- or five-minute chart according to which one clearly shows fair value gaps, order blocks and breakers while avoiding one-minute charts. He favors bullish longs or bearish shorts on Monday through Wednesday, reassesses Thursday and Friday with the economic calendar if the expected move fails, focuses on London and New York opens, identifies 3 a.m. to 10 a.m. New York time as the main volume window, and generally closes most or all intraday positions from 10 a.m. to 11 a.m. Range projections require overlap with 15- to 60-minute PD arrays, including one, two or three Central Bank Dealers Range standard deviations, Asian range levels, combined-range flout projections and five-day average daily range extensions at 127% and 162%. He expects continuation while the four-hour has not reached the targeted premium or discount array and a possible reversal once that extreme is reached during New York. The method reduces entries to an internal-range retracement into a fair value gap or premium or discount area, using levels around 62%, 70.5% and 79%, or an external-liquidity raid beyond a prior high or low, described as his Turtle Soup variation, with a breaker as the fallback after a missed raid entry. His core advice is to master one recognizable setup and do nothing when it is absent. The lesson supplies no verified fills, account figures, realized profit or loss, success rates or independently validated levels, uses nonstandard terminology, relies on narrated demo and chart examples including gold and Japanese yen, and explicitly notes that demo results do not transfer directly to live trading because spreads become visible with real funds.
How we researched this article
BestProps used document-based research from primary firm sources, checked September 24, 2026. The complete source list, scope, limitations, and commercial-state record appear near the end of this article.
This is a transcript-grounded explanation of one speaker’s stated method. He describes it himself as his personal approach rather than a general rule (0:38). The captions are the source for what he says and for the definitions he gives; the reviewer did not watch the charts, so no displayed level or example is verified here. Terms such as PD array, fair value gap, order block, breaker and Turtle Soup are his own working vocabulary, not standardised exchange classifications, and nothing below is a recommendation to trade.
ICT Intraday Analysis on the Four Hour Chart
He states the purpose of the lesson up front: to determine how the four-hour perspective affects a given asset, to identify directional bias from that chart, and to classify PD arrays so they can assist with key levels and what he calls a complete institutional analysis on a four-hour basis (0:50). Notably, the four-hour is not treated as a standalone chart. He says the insights and analysis ideas he has already formed on the monthly, weekly and daily charts are carried into it, and from there into the intraday charts (4:08).
He then lists what the sequence considers once that bias is set: the day of the week and the anticipated weekly or daily profile; the time of day and the session windows he calls kill zones; the Central Bank Dealers Range and the Asian range; and potential intraday profiles, PD arrays and average daily range projections (2:09 and 3:49).
ICT Intraday Analysis From Four Hours to Five Minutes
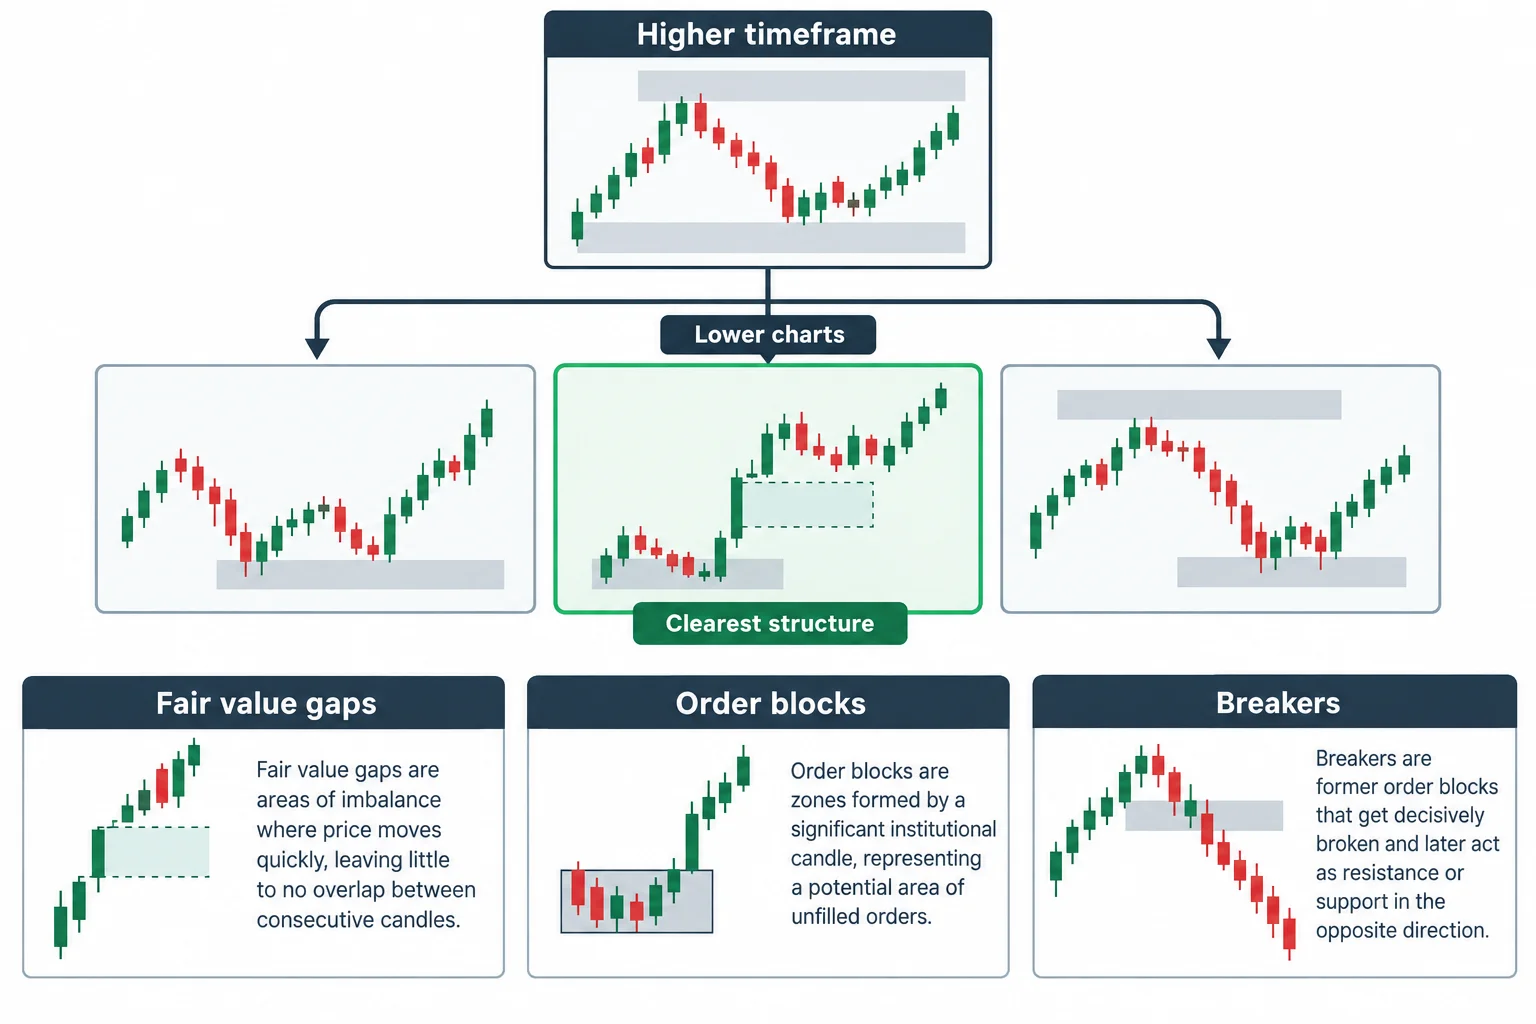
He is explicit that the intermediate step is not fixed. He asks whether, coming down from the four-hour, he should use the 60-minute, the 30-minute, the 15-minute or even the five-minute chart, and says he does not use one-minute charts because he does not like them (4:26). The test he applies is whether the chart shows the price feature he needs: he says he is looking for a timeframe that produces fair value gaps, because a gap visible on the four-hour may not appear on the one-hour but may exist on the 15-minute, where order blocks, breakers and gaps can then be picked out. Higher timeframes smooth price, he says, while lower timeframes create the small pockets of inefficiency he is trying to locate (5:41).
His practical point is that the lower chart is selected for what it displays clearly, not out of habit. He goes on to describe his own preference as moving from the four-hour to the 30- or 15-minute and, where it helps, refining further on the five-minute (5:19).
ICT Intraday Analysis by Day and Session
He ties the day of the week to the directional read. If the higher-timeframe view is bearish he looks for shorts on Monday, Tuesday and Wednesday; if bullish, for longs on the same days (6:21). If that influence does not materialise, he says he looks to late-week scenarios on Thursday and Friday and to what weekly profile might then align, using the economic calendar (6:39). That is a stated response to a failed expectation, not a claim that the expectation itself is reliable.
The window he calls the true day matters to him most. He says the bulk of daily volume occurs between 3:00 a.m. and 10:00 a.m. New York time and that he wants to be positioned ahead of that window or during its first half (7:23). After the New York open he says he lowers his expectations and settles for smaller intraday objectives (7:40). On session selection, the London open kill zone is his first choice: when bullish he aims for the low of the day there, and when bearish for the high of the day; if London does not deliver, he looks to the New York open to reposition or take a new position (7:47). He also says he looks to close the bulk or all of his intraday positions in the 10:00 to 11:00 a.m. New York window (8:25).
ICT Intraday Analysis of Ranges and Overlaps
The lesson leans on standard-deviation projections from several time-based ranges. With a bullish higher-timeframe read, he says he uses one, two or three negative standard deviations of the Central Bank Dealers Range for long entries and looks for 15- to 60-minute discount arrays that overlap those deviations; with a bearish read he uses the positive deviations and looks for 15- to 60-minute premium arrays (8:41). The condition he repeats is that the deviation level alone is not the trade. It has to line up with a price area on the 15- to 60-minute chart.
He applies the same structure to the Asian range, and his preference is specific rather than absolute. Bullish: he wants longs below the Asian range low, though he says anything below the Asian range high still qualifies as what he considers a high-probability long, and he expects the Asian range high to be retested as support for entries or adds. Bearish: he prefers shorts above the Asian range high, accepts anything above the Asian range low, and expects the Asian range low to be retested as resistance (10:22).
A third range he calls the flout. He defines it as the combined time window of the Asian range and the Central Bank Dealers Range, measured as half of the total high-to-low of that combined range, and he says it can be extended through many successive standard deviations rather than one or two, with further levels added as the day’s range grows (12:50 and 14:48). The generated captions render this term phonetically and it is not a standard term, so the spelling should be checked against the video’s on-screen slides rather than taken from this article.
He also uses a five-day average daily range. If the average daily range high is broken on a bullish read, he applies Fibonacci extensions of 127% and 162% from that range as targets, but he says those extensions mean nothing by themselves and must overlap a premium array on the 60- or 15-minute chart; the reverse applies for downside targets and discount arrays (17:29). He is explicit about the limits of all of it: projections are not absolutes and the standard deviations assist rather than guarantee an outcome (19:25).
ICT Intraday Analysis for Bias Reversals and Continuations
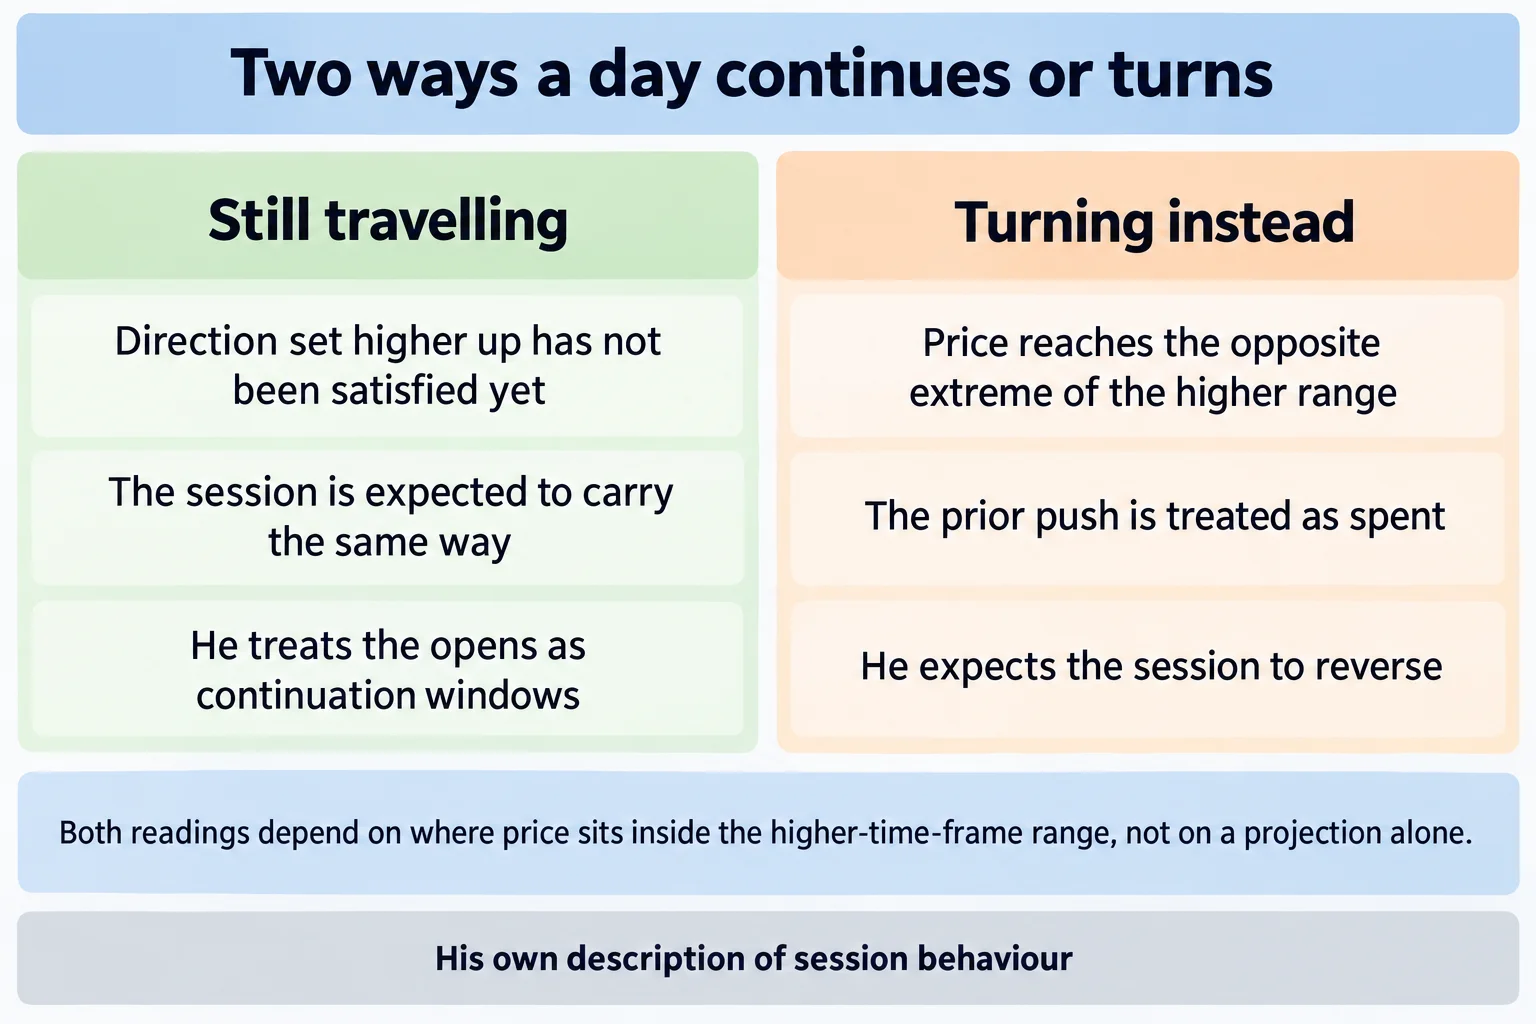
His intraday profile rules turn on whether the four-hour has already reached the extreme he is looking for. If he is bearish and the four-hour has not yet traded into a discount array, he expects the New York open to continue lower; if he is bullish and the four-hour has not yet traded into a premium array, he expects it to continue higher. On the other side, if price reaches a four-hour premium array during the New York session he expects a reversal lower, and if it trades down into a four-hour discount array during that session he treats a reversal higher as likely. Until that extreme is reached, he says London and New York tend to agree on direction and the higher-timeframe momentum continues (15:43). These are his stated expectations about session behaviour, not measured frequencies.
Two further steps complete the routine. He defines the market structure portion he will trade as either internal range liquidity or external range liquidity, then calibrates levels from what he calls the PD array matrix to the nearest ten or five level (17:04). Only after that does he apply the average daily range projections described above (17:29).
ICT Intraday Analysis Setup Types and Fallbacks
He reduces his preferred setups to two. The first is an internal-range retracement: after an impulse move, price retraces into a fair value gap or another discount or premium area. He associates this with his optimal trade entry concept and describes retracement levels around 62%, 70.5% and 79% overlapping a fair value gap or a short-term low where sell stops would sit (28:11). The second is an external-liquidity raid: price runs beyond a prior short-term high or low into a predetermined higher-timeframe area. He calls this his version of the Turtle Soup pattern and credits the inspiration to the Street Smarts book and, later, to work by Linda Raschke (30:15 and 32:51).
If the liquidity-raid entry is missed, he uses a breaker as a contingency: once price has run a short-term high and then trades back down to that level, he treats the reclaimed high as a bullish breaker and uses it as the entry, on the reasoning that the stop run below has already been done (33:47). He describes the same structure in reverse for shorts (45:37). The bullish pattern walkthroughs begin at 26:26 and their bearish counterparts at 40:05 (40:05).
His message about selectivity is the part most likely to be useful to a reader who does not use his vocabulary. He says a technical trader needs only one setup or pattern (21:45), describes the approach as searching for one setup only (26:08), and says he teaches in a demo account specifically so that mistakes carry no financial damage (24:16). He also warns that a gap exists between demo and live results, saying the spread effect becomes visible once real funds are used (49:21).
ICT Intraday Analysis Through the Gold Example
The final part of the recording moves to a gold chart. He says he had covered the monthly and daily breakdown of that market in the preceding week’s live sessions and refers viewers to part two of that recording, which he places around the one hour thirty minute mark (52:10 and 52:22). He then works through the chart using the same vocabulary as the rest of the lesson, including the PD array matrix and stop placement below a level he marks (54:58).
He describes that example, and the earlier Japanese yen discussion, as instances that panned out (23:42). The captions alone cannot confirm the levels he draws, whether any order filled, or what the chart did afterwards, and the recording presents no account figures, no realised result and no frequency data for either pattern. His own framing is that viewers have seen it fail as well as work (61:56), but the article cannot verify either outcome.
Limits of This ICT Intraday Analysis
- No verified result. There is no account, no fill detail and no realised profit or loss anywhere in the recording. The examples are narrated chart reviews.
- No independent levels. Every level, range and projection described above is spoken by the speaker or marked on his own charts. The reviewer read captions and did not see those charts, so none of them can be checked here.
- No frequency data. The recording does not say how often the retracement pattern or the liquidity raid works, how often the projected deviations are reached, or how often his day-of-week expectation materialises.
- No validated terminology. PD array, kill zone, true day, flout, breaker and the rest are his own working labels. The captions garble at least one of them, and they are not standardised or independently defined terms.
- No demo-to-live equivalence. He says himself that pricing differs between a demo and a live account, which is a limitation on how far an example shown in one can be transferred to the other.
Watch the ICT Intraday Analysis Recording
ICT Mentorship Core Content – Month 12 – Intraday Top Down Analysis
The Inner Circle Trader · uploaded 30 October 2022 · about 65 minutes. This is the primary source for this article; every timestamp link above points into it.
The video is not embedded here because playback on other websites has been disabled for it. That was checked directly on 15 September 2026 from a BestProps page origin: the embedded player loads and returns “Playback on other websites has been disabled by the video owner” instead of playing, at both desktop and mobile viewport sizes, so no empty player is left on this page.
ICT Intraday Analysis Resources
These are the sources checked for this article. The publisher’s own channel and site are the first-party record of what ICT releases; the platform page explains the embedding restriction above; the regulator page is general material about trading systems marketed to the public. None of them assesses the speaker, verifies a level or a statement in the recording, or tests the framework described. Any ICT, smart-money or third-party indicator, script, note set or re-upload circulating outside the publisher’s own pages is unofficial and untested here.
- ICT Mentorship Core Content – Month 12 – Intraday Top Down Analysis The Inner Circle Trader (primary source; watch page read 15 September 2026, 65m33s)
- The Inner Circle Trader (official YouTube channel) (read 15 September 2026)
- The Inner Circle Trader (publisher’s own site and free library) (read 15 September 2026)
- YouTube Help (Embed videos & playlists) (read 15 September 2026), platform guidance on embedded playback, relevant to the restriction noted above.
- CFTC (Fraud Advisory: Commodity Trading Systems Sold on the Internet) (read 15 September 2026), general guidance on how hypothetical or simulated trading results are presented to the public.
This is independent educational commentary on one speaker’s own teaching. It is not official ICT material, it is not a tested trading system and it is not investment advice. Leveraged futures trading carries substantial risk.