
Key takeaways
This lesson sets out ICT’s stock-selection routine for what he calls mega-trades — positions he describes as lasting roughly six to nine months or more rather than day trades.
Read the full summary
This lesson sets out ICT’s stock-selection routine for what he calls mega-trades — positions he describes as lasting roughly six to nine months or more rather than day trades. The ingredients are quarterly earnings timing, a seasonal read of the stock market, the direction of the three major US averages, a fundamental screen, and relative strength from sector down to industry group and then to the individual stock. His technical trigger is an SMT divergence between the NASDAQ, the S&P and the Dow: when one average holds a higher low while the others make lower lows, he treats that as institutional buying and screens for stocks showing the same higher low. He demonstrates the screen using Investor’s Business Daily’s IBD 50 and sector-leader lists, works through several named tickers from that period as examples, and states plainly that he is only interested in the buy side. The named stocks, share prices and percentage moves below are what the recording reports happened in 2017 hindsight examples; they are not verified results and not recommendations.
How we researched this article
BestProps used document-based research from primary firm sources, checked September 24, 2026. The complete source list, scope, limitations, and commercial-state record appear near the end of this article.
This article is a source-grounded reading of 0:10, the third lesson of the July 2017 mentorship release. The recording runs 53 minutes and 30 seconds, the watch page gives an upload time of 25 October 2022, 12:00 p.m. Pacific, and the article is built from the recording’s full 1,264-segment timestamped English caption track rather than from its title or description. It is a description of one trader’s research routine and his retrospective reading of charts from 2017 — not evidence of a repeatable edge, and not a recommendation to buy or sell anything.
What he means by a mega-trade
He defines the term at the start: trades that are significant in magnitude rather than small day trades or short-term positions, prolonged in duration and usually lasting about six to nine months or more in the stock market (0:26, 0:38). He also positions the lesson as a segue from the way he defines quarterly shifts in currencies to the way quarterly shifts work in stocks, which he says are closely tied to earnings (0:46, 0:52). His framing is that earnings are reported every three months, so every quarter is a period of anticipation about which companies will move on their numbers (1:40, 1:46).
The five ingredients he combines
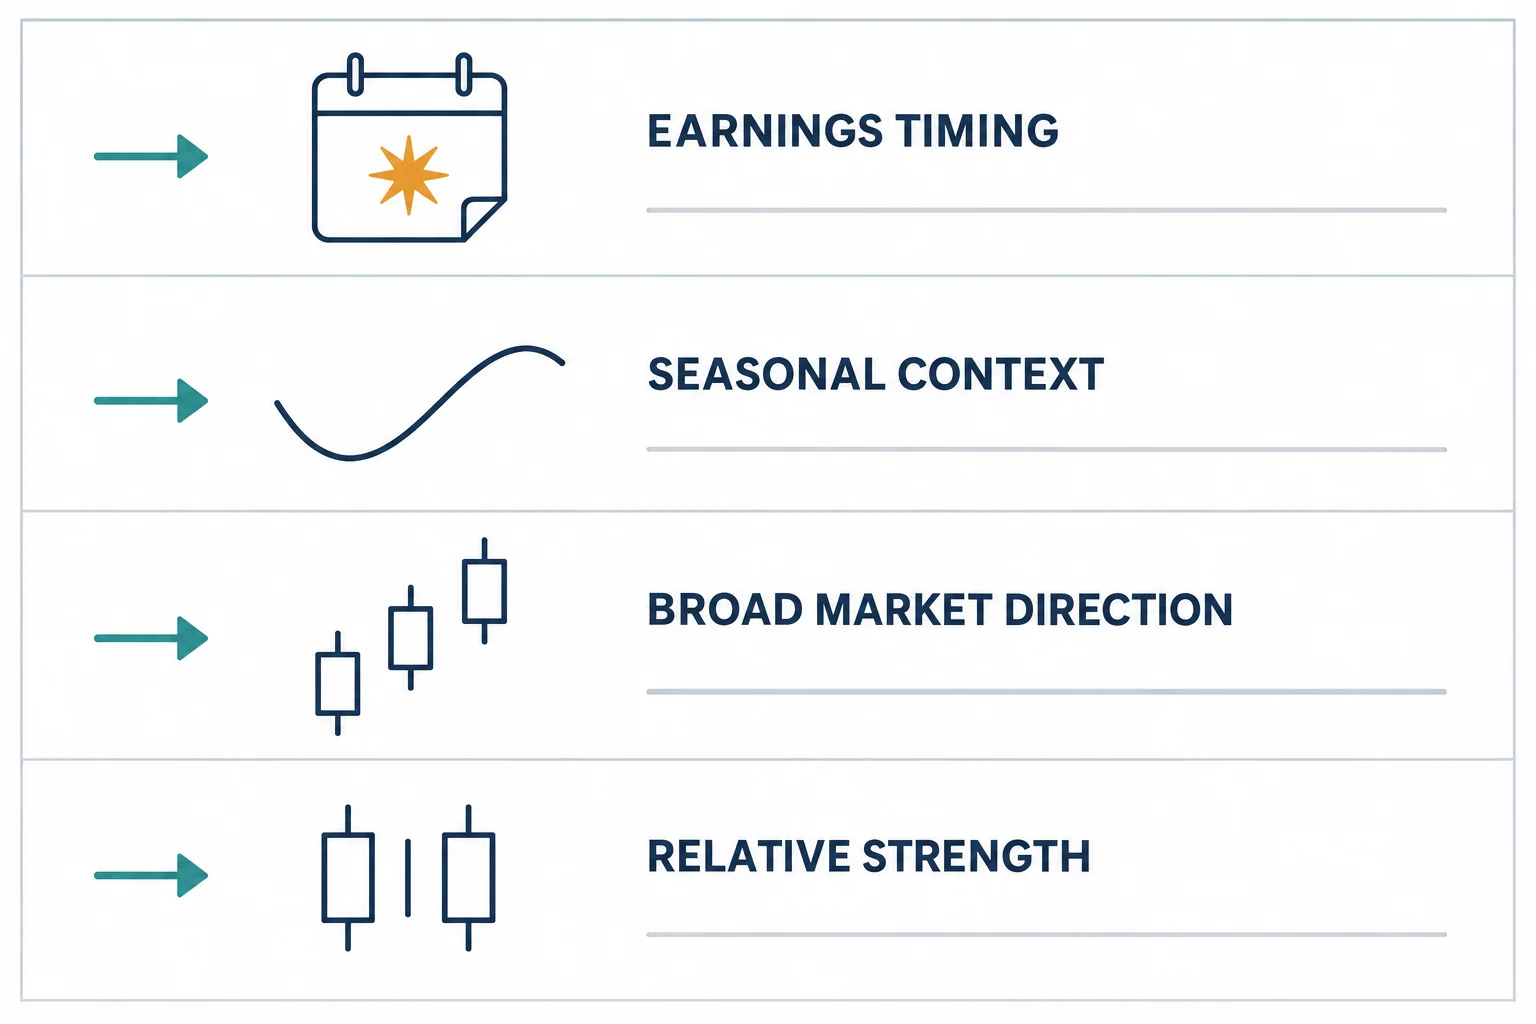
1. Quarterly earnings as the catalyst
He argues that because every public company exists to make money, reported earnings have an outsized effect on price, and that overlapping mega-trade conditions with earnings is what produces the largest moves (1:31, 1:52, a later recap at 20:53). He pairs the March quarter’s earnings releases with the fall quarter’s, and says the latter is the big generator of an end-of-year rally (3:33, 3:50, a summary later at 21:04).
2. Seasonality of the stock market
He describes a generalised seasonal pattern: a low early in the year, a trade up into spring, consolidation through much of the year, and what he calls the best buying opportunity around September to October, sometimes as late as November (2:20, 2:28, 2:34). He warns that markets do not move in lockstep with any seasonal template (3:02), then says the best windows for stocks are the first half of the year and, better still, the fall months into year-end (3:11). The seasonal chart he is looking at is described in the captions as a generalised seasonality graphic; no data series or source for it is given in the recording, so the pattern is reported as his presentation of it rather than as an established fact (2:15).
3. Direction of the major averages
He wants confirmation from the three general averages — the NASDAQ, the S&P and the Dow Industrials — moving up collectively or down collectively, while acknowledging that strong stocks can rise without them and typically accelerate with them (4:26, 4:45, 6:17). His analogy is swimming with the current rather than being a salmon going upstream (5:01, 5:14). He states that the mega-trade process is aimed specifically at buys, arguing that the stock market is predisposed to rise and that institutions are easier to follow on the accumulation side — “the institutions walk around barefooted and we can see them” (5:30, 5:46, 51:57).
Two things are worth separating here. The claim that the market is “a Ponzi scheme … meant to get people to buy into it” is his characterisation, not an analysis the captions support (5:36). And the claim that institutional footprints are visible to anyone who waits is the premise the whole screen rests on; the recording offers examples but no measurement of how often the pattern resolves as he describes.
4. A simple fundamental screen
He is unusually candid about his own limitations here. He says he has almost never looked at fundamentals himself over nearly 24 years because he does not consider himself suited to it, and that he looks instead for shortcuts that borrow the work of people who are better at it (7:38, a later reflection at 17:26). He advises keeping the screen short and simple, and says paid tools are worth it if the alternative is handing your money to a fund manager who will not watch your position the way you would (11:01, 11:10, 11:31).
The screen itself is built on his own admission that he is borrowing someone else’s method. He names Investor’s Business Daily and the CAN SLIM approach associated with William J. O’Neill, saying he has been a paying customer for years and relies on their sector and industry-group breakdowns rather than crunching the numbers himself (9:13, 9:25, 9:52). He also says he has no formal training in stocks and has never been shown how a market maker or a large firm operates — he became convinced of it from watching it over more than twenty years (17:21, 17:37).
5. Relative strength, sector to stock
Relative strength is the piece he spends most of the lesson on. The hierarchy he describes is a bullish market, then the bullish sectors, then the leading industry groups within those sectors, then the strongest stocks inside those industry groups — “the strongest of the strongest of the strongest during a bullish Market” (14:24, 15:09, a summary at 22:27). He says the way to find them is to let IBD do the sector and industry-group sorting rather than building sector heat maps himself (13:59, 14:06). He also uses a horse-racing comparison: back the horse with proven form rather than one arriving with previous injuries, which is his way of saying the leaders have already shown relative strength (15:52, a recap at 16:18).
The technical trigger: index SMT divergence
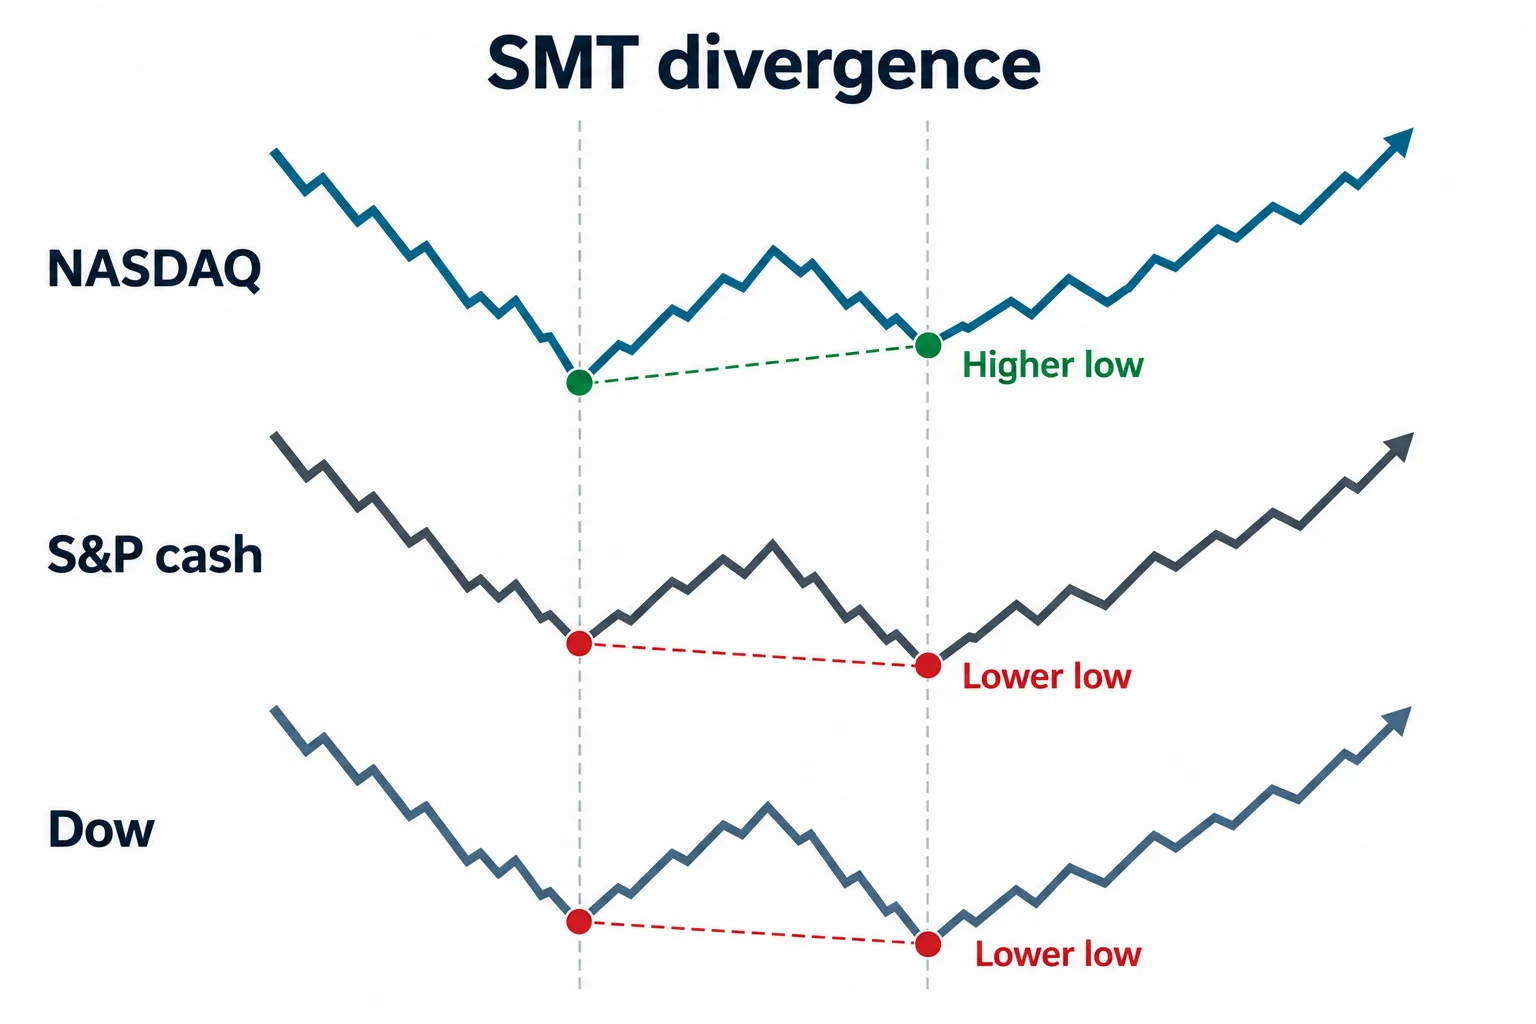
Once a candidate list exists, his trigger is what he calls SMT divergence in the indices. He plots the NASDAQ, the S&P cash and the Dow against each other on a daily basis and looks for the point where one of them refuses to make a lower low while the others do (30:11, a walkthrough of each chart at 29:24, 29:49, 30:05). He says the higher low in one average shows where institutions are accumulating, which tells him which area of the market is being bought — when the NASDAQ holds, he reads it as technology outperforming (48:36, 48:46). He calls this relative-strength divergence the best technical pattern he knows, and says he picked it up from Larry Williams and applied it on top of O’Neill’s fundamental screening (25:15, 48:00, 48:09).
He is specific about timing: he looks for the averages to diverge roughly every three to four months, and says that when it happens you repeat the same sorting procedure (51:57, 52:01, a reference to the quarterly shift at 25:24). He describes the divergence as a signal that has “real institutional sponsorship” behind it — his interpretation of the pattern, not something the captions establish independently (25:29).
The screen in practice, and the names he worked through
The demonstration runs on Investor’s Business Daily’s site. He goes to the leaderboard and the IBD 50 list, which he says is now sorted by a composite rating rather than the top 100 it used to be, and explains that the composite blends earnings-per-share rating, relative strength, industry-group relative strength and accumulation/distribution (25:56, 26:43, 36:17). He says he wants a composite rating of 98 or higher, and that he prefers share prices above roughly $20, ideally $25, because it keeps him in names with more room to move (36:10, a price-preference repeat at 36:55, a note on option leverage for higher prices at 46:30). He also flags how much faster this is than his old method of sorting the tables for relative strength ranks of 90 or better, which he says took him a couple of hours on a weekend (26:05, 28:16, 28:27).
He then goes through candidates from the list on barchart.com comparison charts, checking each one against the same higher-low test. The examples and the outcomes he reports to camera are listed below exactly as stated in the recording. The captions here are auto-generated and the tickers he spells out are partly garbled, so each ticker is reproduced as he spelled it and the reading of each one is qualified where the captions are unclear.
- Facebook (FB) — his primary worked example. In an April window he highlights Facebook holding a higher low while the Dow made a lower low, while the NASDAQ also held a higher low as the Dow and the S&P made lower lows. He reports a run from about $140 to $165, roughly $24 and change a share (18:20, 18:50, 19:04, a second pass later at 45:03, 45:13).
- Lite — spelled out in the recording as “l-i-t-e”. He says it made a lower low at the same time as the Dow’s lower low, so despite a good run in price it would not have qualified, because he wants the higher low (31:10, 31:17).
- “ntri” — he says it had already gapped away from a consolidation and that the gap could easily close on a retracement, so it was not a good candidate. He notes price still came back to the top of the gap, found support, left the gap open and rallied anyway (32:03, 32:15).
- “stmp” — he says it had a nice rally but was making lower lows at the time of the Dow’s lower low, so it would not have been selected either (33:22, 33:27).
- “a-n-e-t” — he says this one would have been a selection: price was already consolidating through the divergence period, and he reports a move from about $130 to $160, around $32 a share (34:04, 34:17, 34:26).
- “ctrl” — he says it had a higher low and a nice technical look, but he would not have liked it because it traded below $20 a share, against his stated preference for $25 and above (35:28, 35:33).
- Fox Factory Holding (FOXF) — composite rating 99, share price between $25 and $80 as he was screening. He reports a higher low with the Dow making a lower low, a move from about $27 up around $10 a share, and calls that roughly a fifty per cent return (37:07, 37:12, 37:33, 37:44).
- “ads” / YY — he says it made a lower low, so it would not have been one to pick (38:13, 38:17).
- Paycom Software (PAYC) — he reports a higher low around $50–58 a share rallying to over $73, which he calls about a forty per cent increase, and then asks what the options would have paid on such a move (39:03, 39:06, 39:11).
- PayPal Holdings (PYPL) — he reports a higher low during the divergence, a consolidation, then a gap up to new highs, moving from about $42 to $59 a share (39:49, 40:02).
- CNC — he reports a higher low at about $70 a share trading up to $86, a sixteen-dollar move (40:37, 40:40).
- Dave & Buster’s (PLAY) — he reports a higher low on the divergence, from about $60 to $73 a share, roughly a thirteen-dollar gain (41:20, 41:26).
- PRA Health Sciences (PRAH) — he reports a higher low and a move of about fifteen to seventeen dollars a share (41:53, 41:57, 42:01).
- Activision Blizzard (ATVI) — he reports a higher low formed during the divergence, price breaking out with a gap, going sideways and consolidating again, moving from about $49 to $62 a share (42:35, 42:51).
- “m-a-s-i” — the one he calls out as a likely loser. He says it was already extended with no real consolidation, gave up its rise aggressively and fell away in what he describes as a turtle-soup pattern, and that although it was fundamentally strong it could have been a loss (43:23, 43:41, 43:53).
- Facebook again, from the sector-leaders tab — he repeats the same reading: a clear divergence just above old highs, consolidation, a higher low, institutional buying, and about $140 to $164, a $24 move (45:03, 45:13, 45:17).
- “aaoi” — he says it moved nicely but made a lower low, so it would not have been a candidate, and he notes it left a gap that was later filled to the top before price rallied away (45:50, 45:59).
- Alibaba (BABA) — he reports a higher low at around $112 going to $155, calls it a huge move, and adds that a price over $100 is not a concern because the option gives leverage (46:43, 46:46, 46:30).
- MKS Instruments (MKSI) — he uses it as the counter-example to the screen itself: it is on the list but the price went very weak, which is his point that being on a fundamental list is not a buy signal on its own (47:43, 47:46).
Every figure above is reported by him as a 2017 hindsight example. The captions carry his spoken numbers and no price data, so none of the share prices or percentage moves can be checked against the recording, and the fact that a stock is on a fundamental list tells you nothing about its future price.
The process, restated
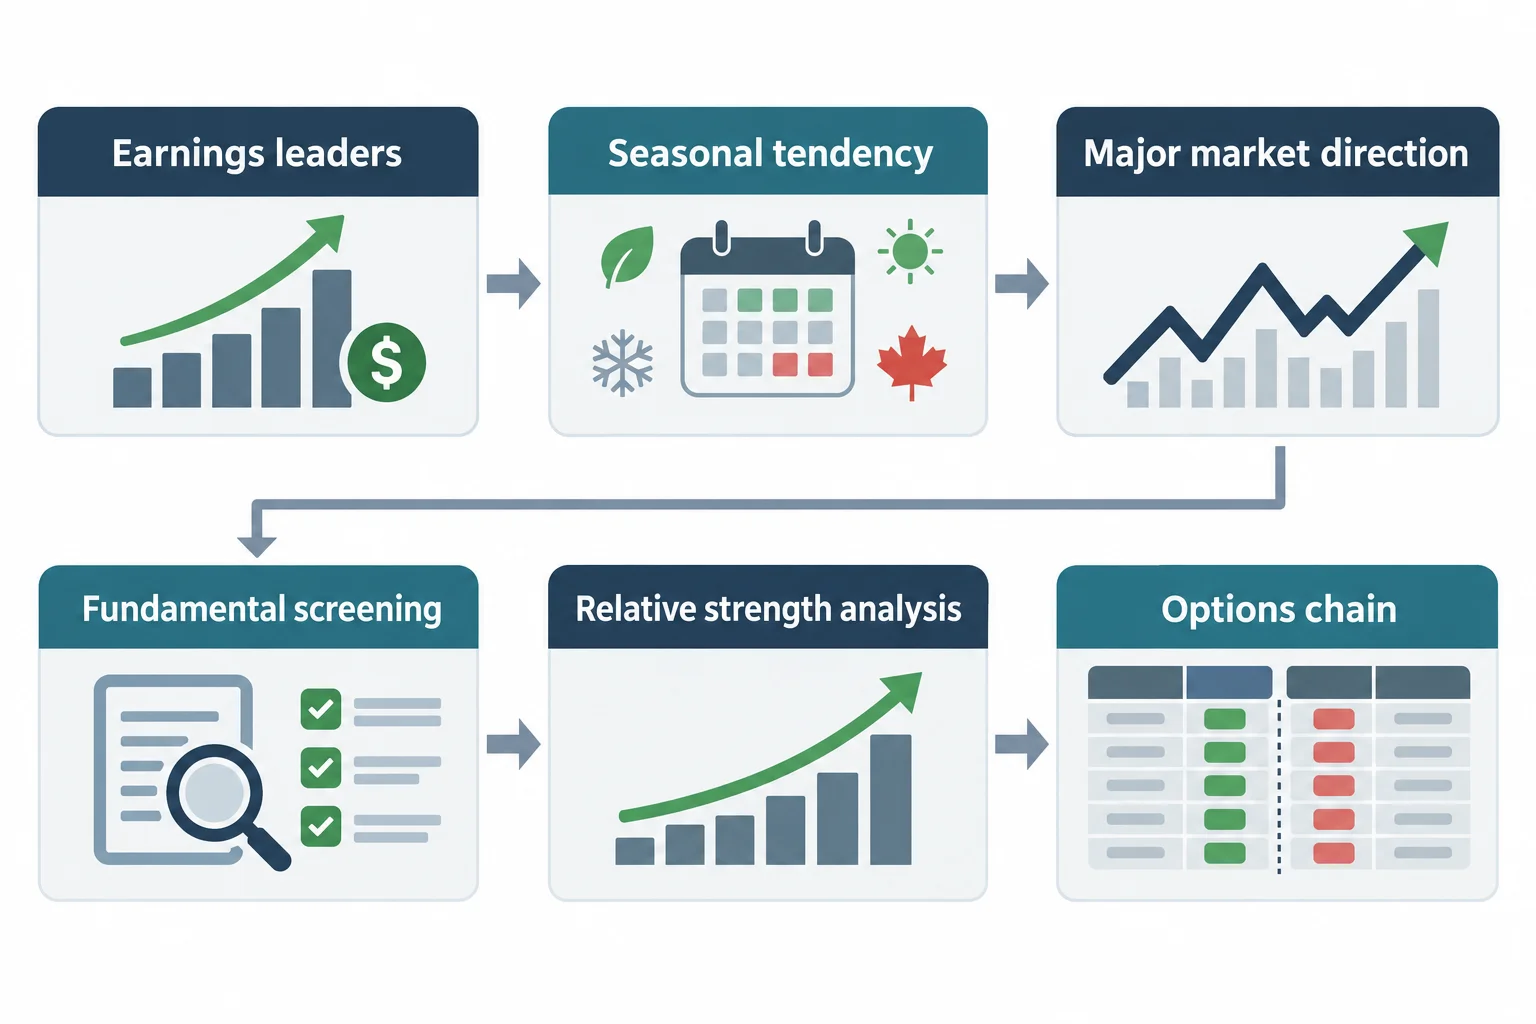
He summarises the routine himself: anticipate new earnings leaders, plan seasonal tendency overlaps for the annual moves, refer to the direction of the major market and whether it is trading higher or poised to, perform fundamental screening, run relative strength analysis to filter leadership by sector and industry group, and only then go to the options chain, where he says the Greeks determine which option and strike to use. The options material, he says, comes in August (20:46, 20:57, a second recap at 27:15, the options note at 22:41).
He also gives the practical rhythm: every year the same way, every quarter the same way, watching for these influences (23:21). He says the spring-to-fall stretch is usually a consolidation period, but that the SMT divergence in the major averages can be used to time buying opportunities within it — a higher low in one average while the other two make lower lows implying short-term bullishness (23:29, 23:40, 23:47). He adds that a divergence alone is not enough: the industry-group and sector leadership has to be there to time it with (28:51).
What he says about the limits, and about copying him
Several caveats in the recording matter more than the examples. He concedes that the method is not a panacea and only stacks odds in your favour (6:51, 4:15). He says he has rarely looked at fundamentals personally and is relying on a paid third-party rating system, that he has no formal stock training, and that he convinced himself of the institutional premise from observation rather than instruction (7:38, 17:26, 17:37). He also notes he is not trying to move anyone into stocks and prefers to concentrate on one asset class himself (17:45, 18:10).
On the second half of the screen, he is explicit that IBD does not teach the SMT divergence and that the pattern came from a different source; he calls the blend of the two his own combination (47:50, 48:00). He says there are ways to sell short and that he will teach it separately in August, but that he is telling viewers to only do this on the buy side, because funds pour money into companies for longer than they take it out (52:07, 52:32, 52:40). He also mentions a third-party screener he saw on YouTube and says he will share the link in a live session rather than in this recording (50:11, 50:52).
Watch the original recording
Watch the original lesson on YouTube
This recording cannot be played inside another website. Its embedded player was loaded from a BestProps origin and clicked on 15 September 2026: it reported “Video unavailable” and “Playback on other websites has been disabled by the video owner”, with no duration and no playback progress. The recording’s own watch-page data agrees that it is not playable in an embed, so no iframe is placed here. The video itself is public and available directly on YouTube.
Source and further reading
- ICT Mentorship Core Content — Month 11 — Stock Mega-Trades — the primary source and the only recording used here. Uploaded 25 October 2022; watch page read 15 September 2026. Use the timestamp links above to compare each step with what he actually said.
- The Inner Circle Trader YouTube channel — the publisher’s own channel, where this core-content month and the lessons it refers back to are posted. Unofficial reuploads and summaries are not the source used here.
- Investor’s Business Daily — the third-party screening service the lesson is built on, including the composite and relative-strength ratings and the sector and industry-group breakdowns he relies on. It is a commercial product, not an independent test of this method, and the recording contains no verification of the ratings it produced in 2017.
- Investor.gov (SEC) — How to Avoid Fraud — the US regulator’s investor education material on assessing claims and promotions. General context for reading any stock-selection method presented with past examples; it does not assess this presenter or any name mentioned above.
BestProps is not affiliated with the Inner Circle Trader, Investor’s Business Daily, barchart.com or the SEC, and no source listed here endorses this article. Mega-trade, quarterly shift, seasonal tendency, SMT divergence, relative strength and institutional sponsorship are used as descriptive terms for what the recording teaches. Every company name, share price and percentage move above is the speaker’s own retrospective account of 2017 examples, reported to camera and not verified here: the caption