
Key takeaways
In “ICT Mentorship Core Content – Month 11 – Commodity Mega-Trades”, a lesson recorded for July 2017 and published in October 2022, ICT sets out a paper-trading screening framework for finding the large annual moves he calls mega-trades in the commodity markets.
Read the full summary
In “ICT Mentorship Core Content – Month 11 – Commodity Mega-Trades”, a lesson recorded for July 2017 and published in October 2022, ICT sets out a paper-trading screening framework for finding the large annual moves he calls mega-trades in the commodity markets. His argument is that a trader should not specialise in one market (2:11), that commodities require some fundamental context such as drought, too much rain or production cuts (9:04), and that delivery-month closing prices are his primary annual search, with a nearby-month premium over distant months treated as an accelerator rather than a requirement (12:16). He uses the dollar index only as directional context and states plainly that commodities and the dollar can move together for a year at a time (15:21), then compares related markets for the one that refuses to make a lower low when he is bullish, or fails to make a higher high when he is bearish (25:38). The illustration is a wheat-versus-soybeans comparison from the first week of July 2017 in which he reports wheat moving 6,500 dollars per contract against 4,800 in soybeans (21:01). The homework is to study the 2016 big movers on weekly charts alongside the dollar index (35:29). The recording offers no tested edge, no verified fill and no performance record; those contract figures are his own hindsight arithmetic read off charts a reviewer cannot see.
How we researched this article
BestProps used document-based research from primary firm sources, checked September 24, 2026. The complete source list, scope, limitations, and commercial-state record appear near the end of this article.
Commodities get a full month of the mentorship for a reason: ICT treats them as a small enough universe to scan systematically, but a wide enough one that a trader watching a single favourite market misses the year’s largest moves. This article works through what he says in the recording, where each point sits in it, and what the source does and does not support.
What he means by a mega-trade
ICT introduces the term near the start (0:53). His definition is a large price swing or trend that produces potential gains which, compared with related markets, outperform them all. He credits Larry Williams as the origin of the underlying idea and says the wording itself is his own.
Two characteristics follow from that definition in his account. These moves are easy to see in hindsight, appearing in every calendar year, and he attributes them to large institutional sponsorship combined with real supply-and-demand factors. He adds a notable concession: while he says he usually disregards supply and demand as a technical approach, in commodities he calls it “an absolute reality” a trader has to have a feel for (1:43). That is his stated view of his own method, not a tested result.
Why he says not to be a commodity specialist
His first practical instruction is to avoid being a specialist or a one-market trader (2:11). The reasoning is opportunity cost: a favourite market can offer plenty of setups yet sleep while other markets are on fire, and a trader watching only that market never sees the larger extrapolated swings. He is explicit that there is nothing wrong with having a bread-and-butter market, only with limiting your scope to it. Commodities, he notes, present a manageable universe to analyse, comparable to the handful of major and cross pairs he follows in currencies (3:16).
The markets he sorts into sectors
He walks the universe sector by sector. In the grains he names soybeans, soybean meal, soybean oil, wheat, corn, oats, canola and rice, then cuts the working list to three — soybeans, Chicago Board of Trade wheat and Chicago corn — explaining that oats and rice are thin markets where limit moves can trap a trader, and that he no longer considers those to be worth watching at all (6:02). The livestock complex is live cattle, feeder cattle and lean hogs, pork bellies having been discontinued. The softs are coffee, cocoa, sugar and orange juice, with cotton as the fibre — eleven agricultural markets in total as he counts them (6:39).
He then treats financial markets — the ones he calls hard and industrious, moved by wars, economic drivers, interest rates and imports or exports. Metals split into precious, where he lists gold, silver, palladium and platinum, and industrial, where he keeps high-grade copper; he again flags palladium and platinum as very thin and included only for completeness, leaving gold, silver and copper as the three to watch. Energy is crude oil, heating oil, gasoline futures and natural gas futures, and he volunteers that he has no experience trading natural gas futures himself (8:11).
His own caveats matter here. A list of contracts written in 2017 says nothing about present-day liquidity, spreads or contract specifications, and his thin-market warning rests on his trading experience in the 1990s rather than on anything in this recording. Anyone using the list today would need to check current volume and margin for themselves.
Fundamental context: headlines, sentiment and the magazine problem
Fundamentals matter for this asset class, he says, but the bar is low: you do not need to wade through crop reports or cattle-on-feed reports, because a simple newspaper headline may be enough to draw a fundamental conclusion (9:04). He illustrates with the mid-1990s US grain rally, when drought, heat and reports of a crop-damaging parasite preceded vertical moves in wheat, soybeans and corn. He cannot recall which parasite it was — a useful reminder that this is a recollection, not a documented study.
He then turns the same mechanism on its head. Looking at the “hot commodities” feature he remembers from Futures magazine, he says the coverage tends to arrive once a market has already been moving, exactly when a reversal is due (11:05). He reads that late, public attention as a measure of sentiment, and treats an extreme in sentiment — extremely bullish or extremely bearish — as a contrarian signal, best used when technicals point the same way (11:47). It is an interesting idea and it is stated as an impression of how magazine coverage behaves, with no sample, count or measurement behind it.
The delivery-month premium he searches for every year
His stated first step each year is to consult delivery-month closing prices, which he says can be read from sources such as Barchart, the Wall Street Journal or Investor’s Business Daily, and to note any commodity whose nearby month trades at a premium to a distant month (12:16, restated at 12:25). Ordinarily the further-out months should carry the higher price; when that reverses, the premium is in the nearby months.
He calls premiums the common ingredient for explosive bull markets and treats this as his primary annual search (13:01). His contrast is between what he calls a commercial bull market, which goes parabolically vertical, and a carrying-charge market that grinds up and down and may take many months to reach an objective. He also states the limit of the filter twice: a premium is not required for a commodity to be bullish, it merely adds to the likelihood of a strong rally (14:10). Anyone who wants to use this in practice should treat it as a simplified description of term structure, not a complete one; the recording does not discuss storage costs, carry, roll mechanics or how to normalise a curve that is not a clean sequence.
The dollar index as context, not a rule
The general rule of thumb he gives is familiar: a declining dollar allows commodity prices to rise, and a rising dollar tends to weigh on them (15:21). He qualifies it immediately. There can and will be periods, lasting as long as a year, when commodities and the dollar move together, and he says he has no method to crack that code. He is candid about the resulting risk: nobody is 100 percent accurate, past performance is not indicative of future results, and the ideas are things he has observed over what he describes as twenty-four years coming up (16:15). He also says outright that if a viewer trades these ideas with live funds, that is their decision, and that he wants neither the credit nor the blame (16:55).
The practical point he draws from this is that the dollar sets a directional presumption and nothing more. The relative-strength comparison inside each sector is what he uses to test that presumption, and the two together are what move a market from “interesting” to “worth a paper position”.
Relative strength: the leader in each sector
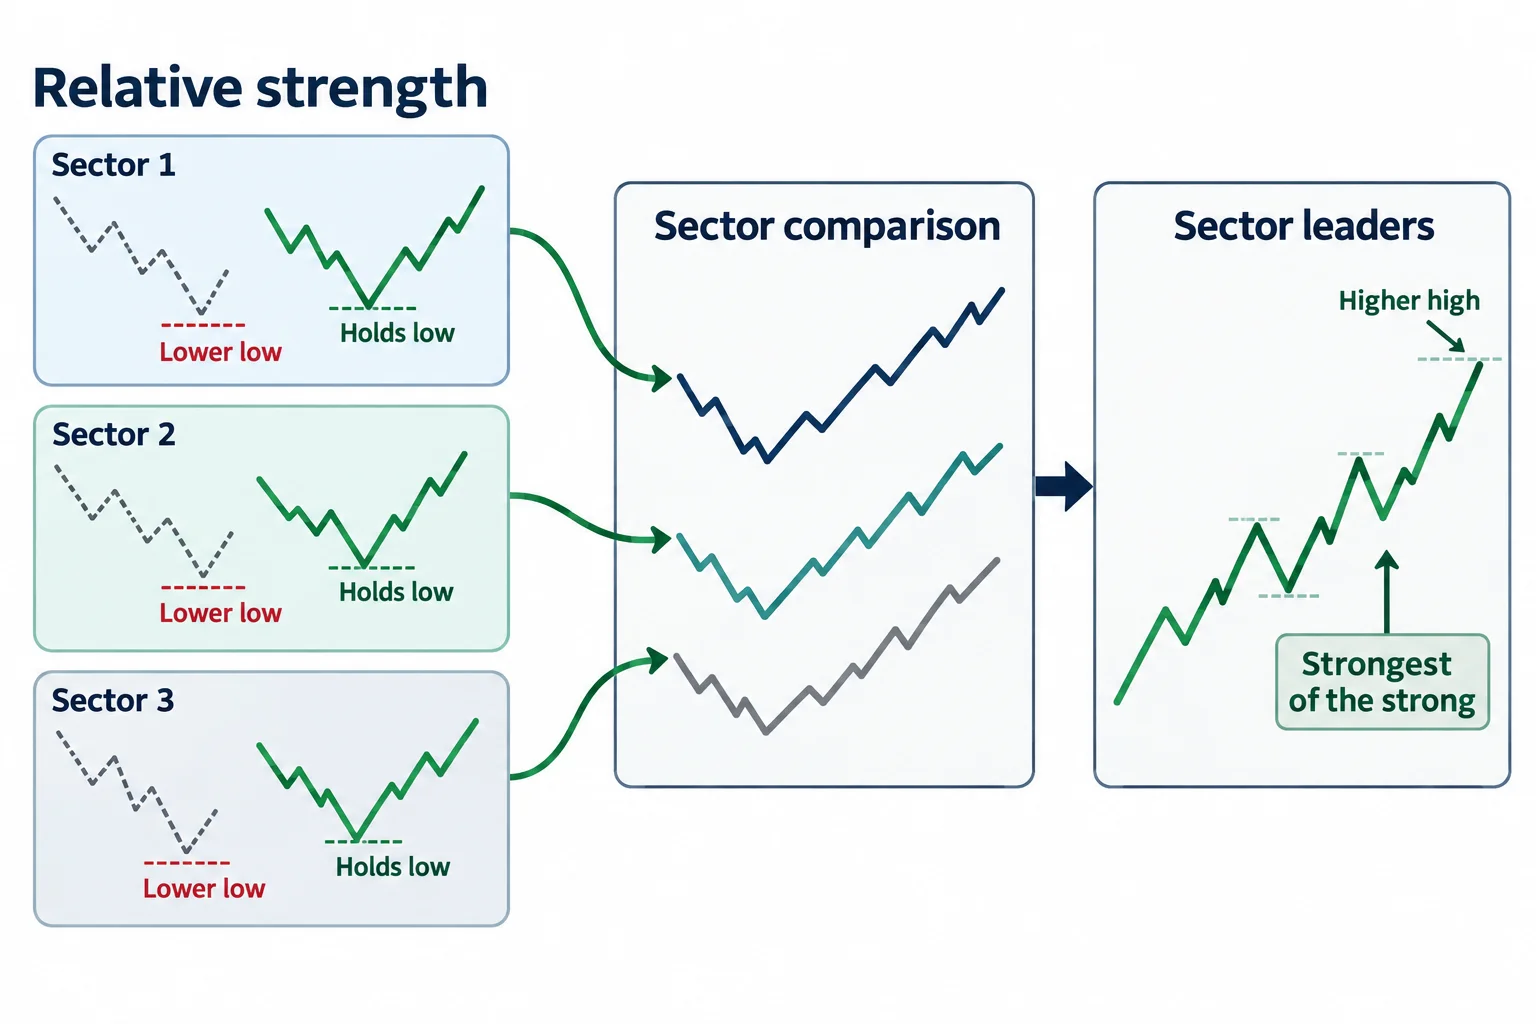
When he expects higher commodity prices in general, he says he filters for markets showing very bullish characteristics; when he expects lower prices, he filters for very bearish ones (17:23). He acknowledges contrarian opportunities exist in either condition but sets them aside to keep the example simple.
The comparison itself is visual. Bullish: look at the lows of related markets and favour the one that refuses to make a lower low while its peers fall. Bearish: look at the highs and favour the market that fails to make a higher high while peers advance, a failure swing he reads as heavy distribution (25:38). Then, once he has one leader per sector, he compares those leaders against each other to find which is breaking highs earlier or finding more support at down-closed candles — his “strongest of the strong”, or the mirror image on the short side (30:03).
What the recording does not supply is a mechanical definition. The phrase “fails to make a lower low” is a judgement made by eye on a chart, and the recording never states how much divergence is enough, over what lookback, or how to score several competing candidates. The step that follows is equally discretionary: he says he would not distribute money evenly across eight leaders, but look for the three that are really outperforming and weight the allocation towards them. That is a hypothetical teaching example, not a demonstrated portfolio, and it does not address leverage, gaps, changing correlations, roll costs or option-specific risk (30:07).
The 2017 wheat and soybean comparison
The worked example in the recording is a wheat overlay against soybeans, current at the time of recording in the first week of July 2017, and he is careful to say that this is not a mega-trade itself but an illustration of how they start (18:25). Corn is left out because it was consolidating. With the dollar described as bearish, he looks for bullish characteristics inside the grain complex.
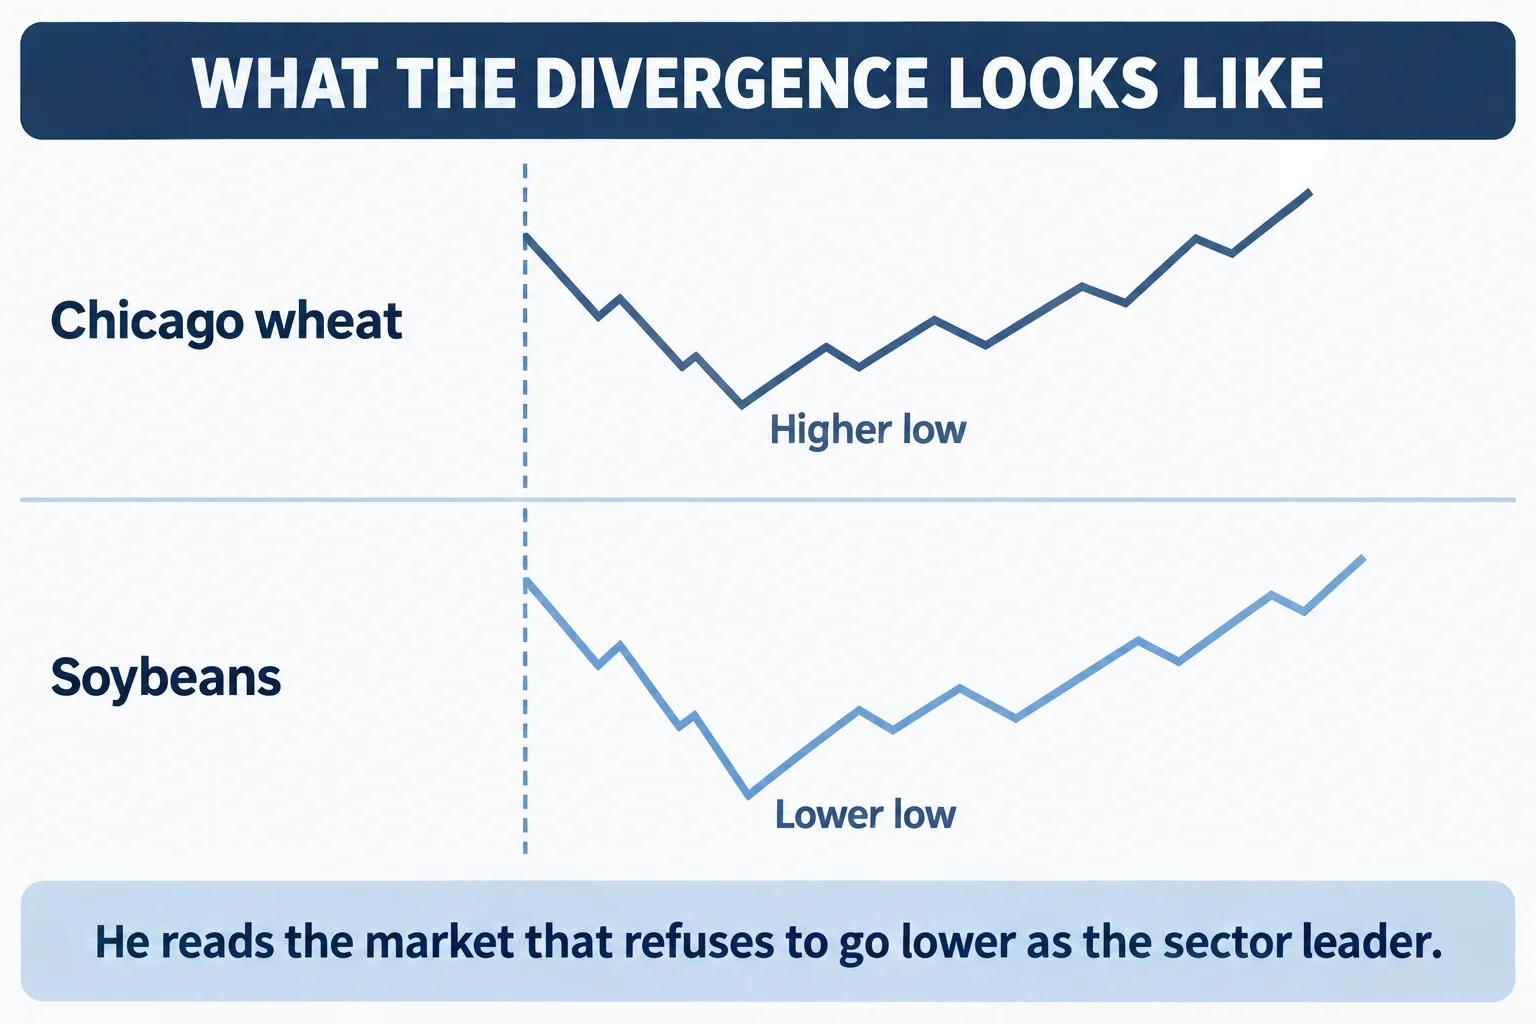
His reading of the two charts is that in the middle of May into early June wheat was unwilling to make a lower low while soybeans fell precipitously, and that after both rallied into around 19 June and declined modestly, soybeans made a lower low while wheat failed to follow. On that basis he calls wheat the stronger grain market (20:24). He reports that wheat then rallied 6,500 dollars per contract against 4,800 in soybeans, and later adds a further roughly one-dollar or five-thousand-dollar-per-contract move in wheat that he says took about a week (21:01, 24:13).
Two things should be kept separate here. The first is his interpretation: that the divergence in the lows showed institutional accumulation, and that open interest falling through May and June while wheat consolidated, with the bottom dropping out of it into July before price traded into a daily bullish order block and “exploded”, was the telltale sign (23:49, 23:55). The second is the contract figures. Those are his own hindsight arithmetic from a chart he was looking at in 2017; this transcript shows the numbers being spoken but cannot show the chart, the entry convention, the data feed, the fill or whether a position was ever held. They are not audited results and should not be read as a track record.
He also repeats a general idea that has no order-flow evidence attached to it in this recording: large institutions and commercial users cannot hide their size, so their activity leaves telltale signs in price (21:10). Whether that is true of any particular move is exactly what the exercise is meant to investigate, and nothing in the source settles it.
The process, restated
He summarises the whole routine in a few lines (24:37):
- Search headlines for something that would spark interest — a dry spell, too much rain, an oil-production cut, a war that could affect supply (24:43).
- Look for markets carrying a premium, without requiring one (25:11).
- Confer with the dollar index for direction — dollar up, commodities down; dollar down, commodities up (25:29).
- Compare relative lows across a sector when bullish, or relative highs when bearish (25:38).
- Filter one leader from each sector (26:02).
- Paper-trade the idea through option prices, where risk is limited to the premium paid plus commission (26:11).
He describes this as a basic and simplified overview that he intends to refine in the August material on commodity top-down analysis. He is honest about the gaps: some portions are deliberately left out to be filled in later, and his instruction for now is to build the mindset first (26:41).
The option-practice point deserves its own caveat, because he states the risk limit accurately but briefly. Buying a call limits the loss to the premium and commission, but options also lose value with time and can expire worthless, and a small account buying options in every sector is still exposed to being wrong in every sector at once. The recording does not discuss expiry selection, implied volatility or the cost of repeated attempts.
The commodity basket and how he would weight it
He starts the basket section from an admission rather than a promise: not every commodity sector will perform well and not every selected leader will outperform as expected (27:26). His argument is that a diversified approach in theory raises the odds of capturing a mega-trade in one or more sectors, and that the magnitude of the winners will many times cover the collateral damage from the losers. He then describes the second pass — comparing the sector leaders against each other, buying more options in the strongest, and allocating roughly half the capital earmarked for the idea to the three most convincing names while spreading the remainder across one market from each of the other sectors (30:03, 30:07).
The “winners cover the losers” claim is an expectation he states, and the recording contains no basket, no results and no failure count behind it. That is the single most important qualification in this lesson: a diversification argument that relies on the size of unknown winners is a hypothesis, not a measured property of the method.
The treasure-seeker mindset and the homework
He names the last section the treasure-seeker mindset and uses it to answer students who find chart study tedious: he compares annual big movers to a treasure hunt, says he has treated it that way since his first day reading Larry Williams, and argues that a calendar year of fresh charts is a fresh hunt (32:18). He is direct about the trade-off — a trader who finds the exercise boring will plateau — and equally direct that he is not trying to talk anyone into trading commodities, only to build a broader read of price action.
He then deliberately withholds examples so the live session can do the work, and sets the homework: with hindsight, study the big movers in the commodity markets across 2016 on weekly charts — the three grains, the three meats, coffee, cocoa, sugar, orange juice and cotton, then gold and silver, then heating oil and crude oil — pairing each with the dollar index and looking for the accumulation or distribution characteristics he has described (35:29, 35:42). He adds that students should look for each sector’s biggest mover and expect an inverse dollar relationship, and notes that he has left currencies, bonds and indices out of this particular lesson because they get their own (36:13).
He also predicts the outcome honestly: some students will come away with nothing fruitful from the exercise, and that is fine, because the point is the confidence that comes from finding the same thing he pulls out in the live session.
How to use the lesson without over-reading it
The most defensible part of this recording is the research routine rather than any single filter. Scanning a bounded universe, insisting on some fundamental context, checking whether a move is confirmed by related markets and by the dollar, and then ranking the survivors is a structured way to organise observations, and the delivery-month premium is at least a concrete, checkable input.
Several limitations go with it. The lesson is a screening and bias-building framework with no entry, stop or exit definition; the discretionary core — “refuses to make a lower low” — is not quantified anywhere in the source; the only worked example is a single grain comparison from one month in 2017; the reported contract moves are hindsight arithmetic on a chart the source cannot show; the basket logic depends on unmeasured winners covering measured losers; and the homework is explicitly a hindsight exercise, which is where selection and hindsight bias do the most damage. Anyone testing the idea should use complete data and pre-defined rules, including the years that did not work. The recording does not establish a proven edge or promise future performance.
Watch the original lesson
This article draws on the timestamped English captions of “ICT Mentorship Core Content – Month 11 – Commodity Mega-Trades”, a recording made for the July 2017 release and published on YouTube on 23 October 2022, listed at about 40 minutes. Captions are a source for the speaker’s words; they cannot verify chart prices, fills or outcomes, and the reviewer read captions rather than watching the charts.
Watch the original lesson on YouTube
This lesson cannot be played inside another website. When its embedded player was loaded from a BestProps origin and clicked on 15 September 2026, the player itself reported “Video unavailable” and “Playback on other websites has been disabled by the video owner.” at both desktop and mobile widths, with no duration reported and no playback progress. That is why no embed is used here. The video is public on YouTube and plays normally on its own watch page.
Watch “ICT Mentorship Core Content – Month 11 – Commodity Mega-Trades” on YouTube ↗
Resources
These are the sources checked for this article. The publisher’s own pages are the first-party record of what ICT releases; the CFTC and Investor.gov pages are neutral US regulatory references for commodity markets and for how marketed trading approaches are described to the public. None of them assesses the speaker, verifies a chart level or a reported contract move in the recording, or tests the framework. Any ICT, smart-money or third-party indicator, note set, script or re-upload circulating outside the publisher’s own pages, and any indicator built on these concepts, is unofficial and untested here.
- [1]