
Key takeaways
This lesson turns the stock year into a seasonal map.
Read the full summary
This lesson turns the stock year into a seasonal map. ICT divides it into three stretches: an earlier high-magnitude stretch he calls directionally bullish, a low-magnitude stretch from May to October that he expects to be more range-bound, and a fourth-quarter stretch he calls primarily bullish — which is why he says he prefers to be a trader of stocks from roughly February to May and from October to year-end. He then reads the calendar month by month off what he says are 20-year, 15-year and five-year averages of the Dow Jones Industrial Average: January bearish, February bullish, March consolidating, April bullish, May bearish, June consolidation turning bearish, July bullish into a midyear high, August consolidating, September split, October making the year’s low before trading higher, November bullish and December a Santa Claus rally. March, June and August are named as the least fruitful months. The second half applies index divergence — comparing the Nasdaq, S&P and Dow futures at nearby highs and lows — to February, March, April and May case studies. He repeats that aberrations happen, that the seasonal framework can fail, and the lesson contains no dataset, no rules and no results.
How we researched this article
BestProps used document-based research from primary firm sources, checked September 24, 2026. The complete source list, scope, limitations, and commercial-state record appear near the end of this article.
ICT Mentorship Core Content – Month 10 – Stock Trading – Seasonals & Monthly Swings runs 21 minutes exactly. He introduces it as lesson one of the final week of the June 2017 mentorship, while the watch page gives an upload time of 20 October 2022 — the recording is a re-release of an older month. The market conditions he describes inside the lesson are 2017 conditions and are treated that way below. This article is built from the recording’s full 521-segment auto-generated English caption track rather than from its title or description.
Where the seasonal data comes from
He credits the seasonal work to Steve Moore at Moore Research and calls it the best seasonal material available to active traders (0:32, 0:38). He is deliberately working from one instrument rather than three: he says he chose the Dow Jones Industrial Average for its seasonal profile because it is a small sample of thirty large companies, and that you could look at the Nasdaq and S&P instead (0:32, 1:04). His own preference is that the S&P is the more accurate picture of the market, so he says he will use the Dow seasonal as a general backdrop and pair it with the S&P going forward (1:27). The captions do not include the underlying dataset, the exact sample windows or the calculation method, so the averages themselves cannot be independently checked from this source.
The three divisions of the year
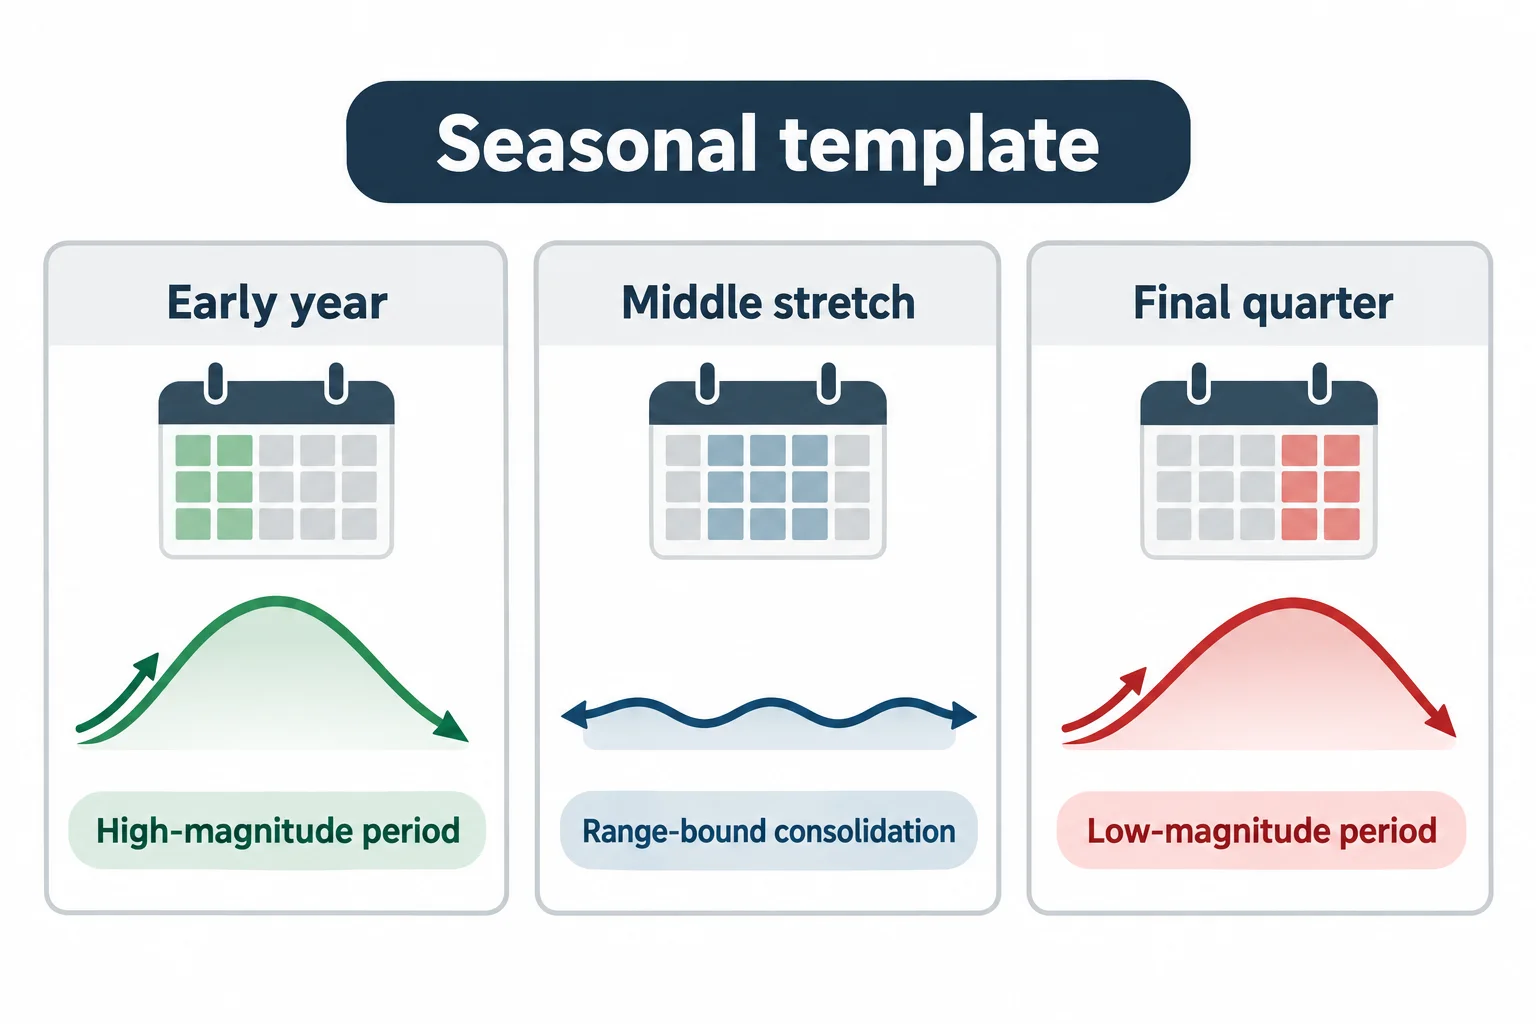
At 2:03 he lays out his framing. The first part of the year is described as a high-magnitude period with plenty of volatility, generally directionally bullish (2:29). The last quarter is described as primarily bullish as well, and he attributes that to the holidays and year-end spending, saying the upward magnitude and velocity in that stretch contrast strongly with the start of the year (2:48).
The middle stretch is the one he calls the low-magnitude period, beginning in May and ending in October (3:42, 3:44). His guidance for it is to use less leverage on trades, to be less active in options, and to expect a range-bound consolidation environment overall; the summer months bring spending shifts as people pay for holidays, so he treats the quiet season as partly cyclical (3:42, 4:12). His summary of the practical conclusion is that he wants to be a trader of stocks from October to the end of the year and from February to May (4:46). Note the tension with his own monthly map below, where May is labelled bearish — the two statements are both his, and the article does not try to smooth them into one rule.
The month-by-month map
From 4:57 he walks the calendar. These are his descriptions of the seasonal averages, not forecasts that every year will follow the same sequence:
- January — typically a bearish month (5:09).
- February — typically bullish (5:13).
- March — seen generally as a consolidation month, with whipsaws both ways; within it he notes the second and third weeks tend to be bearish before a rally into the close (5:18, 12:40).
- April — typically bullish; he adds that it starts with a slightly bearish tone before vaulting higher toward the end of the month (5:23, 14:21).
- May — typically bearish (5:27).
- June — a consolidation month ending with a bearish tone (5:30).
- July — bullish into what he calls the midyear high (5:34).
- August — generally a consolidation month (5:41).
- September — split, bullish in the first half and bearish in the second (5:47).
- October — usually makes the final quarter’s low, though he says that low can also arrive in the second half of September, after which price trades aggressively higher (5:55).
- November — typically bullish (6:13).
- December — generally a Santa Claus rally month, bullish (6:17).
He says the slide compares a 20-year average, a 15-year average and a five-year average, and that the longer and shorter series are closely correlated in where they consolidate and expand — which he takes as evidence of consistency rather than proof (6:36, 6:54). His own caveat is worth quoting in substance: consistency is not high probability, perfection or the absence of risk, and nothing is guaranteed just because the past looked a certain way (7:21, 7:28).
March, June and August, and how the map is meant to be used
He names three months as the least likely to offer high-probability conditions: March, June and August (8:10, 8:14, 8:22). He also pre-empts the obvious objection, saying there will always be an aberration that does not fit the seasonal pattern and that months labelled bullish or bearish will sometimes do the opposite (8:28, 8:45).
The asymmetry he draws is that the seasonal average mostly reflects a market that has tended to be bought and held, so it will naturally show its strongest signals on the buy side (8:57). The bearish months — he names January, May and the second half of September — matter more as a warning: if those months are already weak during a bull market, he says they could spell aggressive selling in a bear market, which is where he would look for weakness in stocks or a bearish S&P position (9:25, 9:42, 9:54).
The four case studies
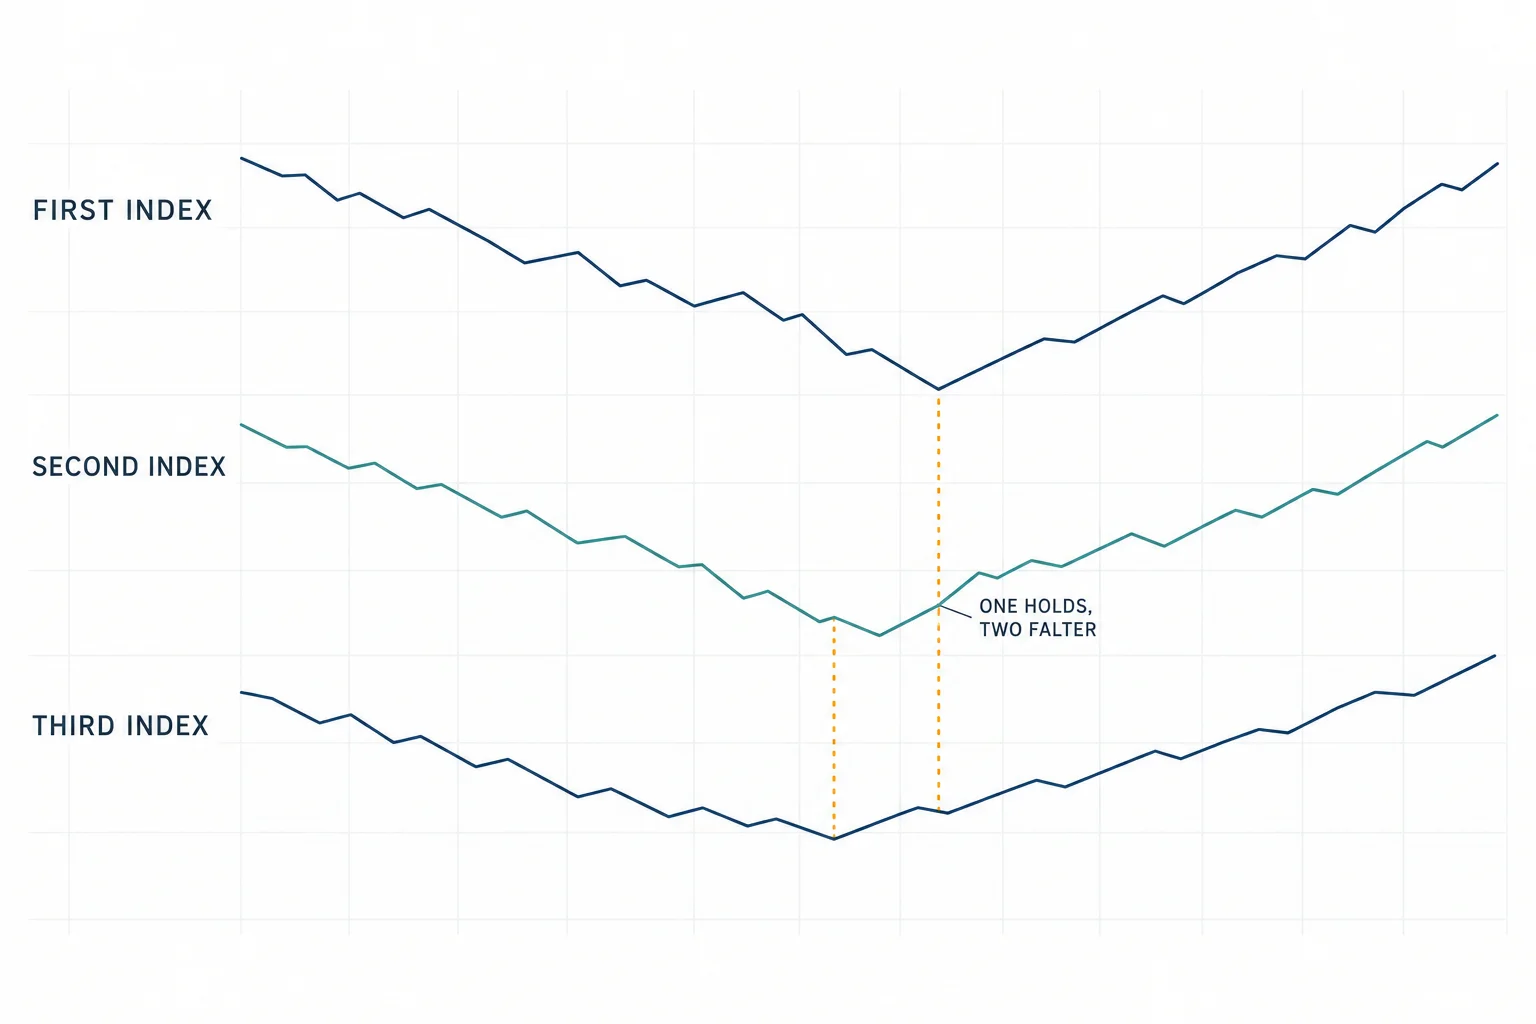
Rather than walk the whole year, he runs four examples and points viewers to barchart.com to pull the month-by-month data themselves, using the March, June, September and December delivery contracts (10:20). Each study stacks the Nasdaq on top, the e-mini S&P in the middle and the Dow at the bottom; he notes the futures are used for convenience and that cash prices would show the same thing (10:51, 11:09).
February (10:51), a month his own map calls bullish. In the second and third days he describes the Nasdaq making an equal low while the S&P and Dow failed to reach it and made higher lows, which he reads as an unwillingness to go lower — his index divergence criterion, and evidence, in his interpretation, of accumulation (11:27, 11:51, 11:59). Later in the month, in the sixth to eighth sessions, he describes the Nasdaq making a higher low, the S&P a lower low and the Dow a slightly higher low, followed by a move higher across the averages (12:02).
March (12:29), which he calls a consolidation month. He points out the weaker second and third weeks and the rally into the close, and describes the Nasdaq making higher highs while the S&P and Dow made lower highs, followed by a sell-off and then a divergence at the lows around the 21st to the 26th — which he deliberately does not mark up, telling viewers to study it themselves (12:40, 12:53, 13:14). His framing is that consolidation does not mean there is no opportunity, only that you have to read the context rather than expect trend (13:37).
April (13:52), which his map calls bullish. He describes the Nasdaq failing to make a lower low while the Dow went lower and the S&P also refused to make a lower low, reading that divergence as accumulation, with the move higher arriving as the month vaults up at the end (14:03, 14:21).
May (14:42), which his map calls bearish. Here the e-mini S&P makes a slightly higher high, the Dow fails to make a higher high and the Nasdaq does make a higher high — non-confirmation at the highs, followed by a sell-off into roughly the third week, and then the small flurry higher into the month’s close that he says matches the seasonal low inside an otherwise bearish month (14:52, 15:07, 15:20).
These are his readings of charts he displayed. The caption track does not carry the chart images, the price levels or the index values, so the divergence descriptions cannot be independently confirmed from this source — and reading non-confirmation as institutional accumulation is his interpretation, not an established fact about dealer behaviour.
His 2017 remark on the tape, and the closing pitch
He flags that May 2017 sat inside a larger consolidation and calls that year’s stock market unorthodox: he says it kept finding higher highs, but with the former leadership no longer participating, so the averages were making highs on narrowing strength (15:37, 15:59). His general conclusion follows from that: he would rather focus on the times the market is predisposed to go higher than trade a market he describes as bubbly (16:16, 16:23).
The last few minutes move away from seasonality into opinion. He argues that retirement and investment accounts are better run as self-directed portfolios, that the firms managing them are not contractually obliged to act in your interest, and that caring about your own money is the reason you will do a better job (16:50, 17:05, 17:48). He describes the market as perpetually attracting new participants who end up with far less than they expected after a crash, and says an investor in stocks still needs to be a trader in them — there are times to be in and times to be out (17:58, 18:33, 18:40). He then asserts that the concepts taught that week will outperform the general averages, and tells viewers to forget conventional ideas about expected annual returns (19:34, 19:52). None of that is supported in the recording by results, and it is presented here as his view rather than a demonstrated outcome.
What this lesson does not establish
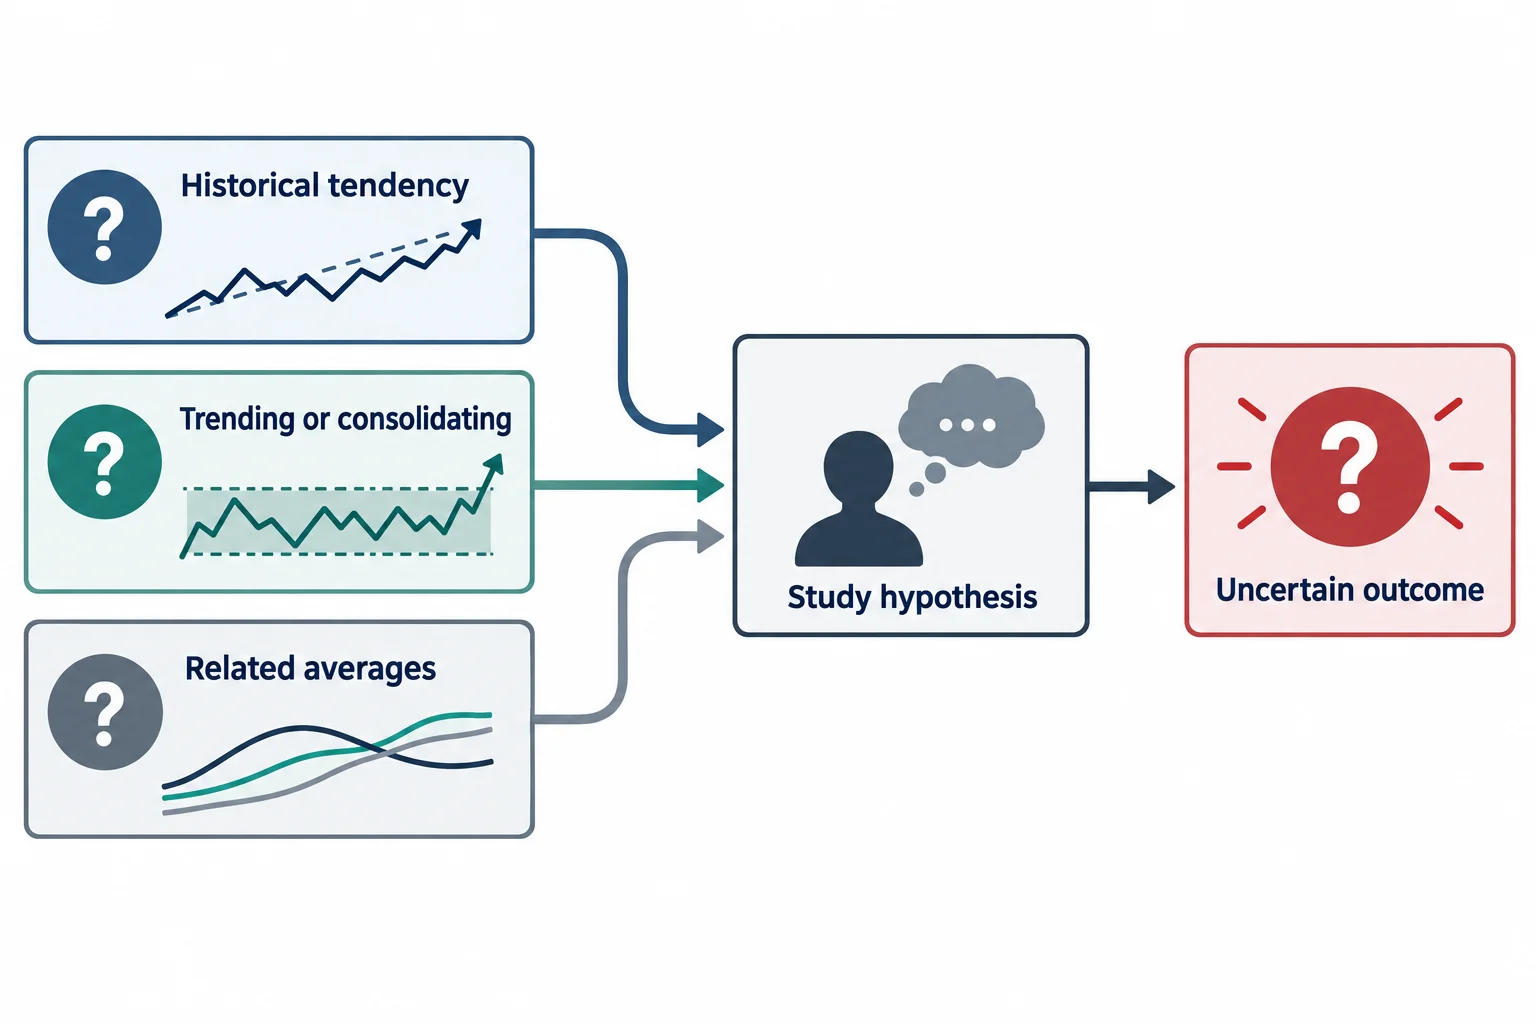
The useful part is organisational: start from a historical tendency for the month, ask whether the current market is trending or consolidating, then check whether the related averages agree with each other. What is missing is what would make it testable. There is no dataset or methodology behind the 20-, 15- and five-year averages, no definition of the magnitude measures, no entry or invalidation rule, no position sizing, and no results of any kind. The outperform-the-averages claim is asserted, not evidenced. The case-study divergences are visual readings of charts the caption track does not include, and the same four months are the only ones examined. Seasonality frames a question here; it does not answer one. He says as much himself, and the article treats the framework that way.
Watch the original recording
Watch the original lesson on YouTube
This recording cannot be played inside another website. Its embedded player was loaded from a BestProps origin and clicked on 15 September 2026 at both desktop and mobile widths: it reported “Video unavailable” and “Playback on other websites has been disabled by the video owner”, the video element never advanced past readyState 0, and no duration or playback progress was available. The recording’s own watch-page data agrees, reporting the video as not playable in an embed, so no iframe is placed here. The video itself is public and available directly on YouTube.
Watch ICT Mentorship – Seasonals & Monthly Swings on YouTube ↗
Source and further reading
- ICT Mentorship Core Content – Month 10 – Stock Trading – Seasonals & Monthly Swings — the primary source for this article. Every monthly label, case study and caveat above comes from this recording’s caption track; use the timestamp links to compare each point with what was actually said.
- The Inner Circle Trader YouTube channel — the publisher’s own channel, where this mentorship month and the lessons it refers back to are posted. Unofficial reuploads and third-party summaries are not the source used here.
- Investor.gov (SEC) — Investment products — the US securities regulator’s investor education hub on investment product categories and their risks, including the difference between investing and active trading. Independent context for reading any seasonal or timing framework; it does not assess this presenter.
- CFTC — Learn & Protect investor education — US regulator material on leveraged retail trading and on promotions built on past performance or historical patterns. General context for reading a seasonality lesson that asserts outperformance without results; it does not assess this presenter or any claim above.
- Federal Reserve H.10 — historical foreign exchange rates — the US central bank’s official historical data releases, included here as an example of how to source primary market statistics rather than relying on an average presented without methodology. Official statistical publishing; unrelated to the equities claims above.
BestProps is not affiliated with the Inner Circle Trader, Moore Research, barchart.com, the SEC or the CFTC, and no source listed here endorses this article. Seasonal tendency, low-magnitude period, Santa Claus rally, index divergence and smart money accumulation are used as descriptive terms for what the recording teaches. The monthly classifications come from averages the speaker credits to a third-party research service and describes only in broad brush terms; the caption track contains no dataset, sample dates or calculation method, so the statistics themselves are not verifiable from this source. The 2017 market commentary and the outperform-the-averages claim are the speaker’s own views, reported as such and supported in the recording by nothing but his assertion. Seasonal patterns can and do fail, and past tendencies say nothing certain about future prices. This is independent educational commentary, not official ICT material, not a tested trading system and not investment advice. Stocks and leveraged products involve substantial risk of loss.