
Key takeaways
In this mentorship lesson, “ICT Mentorship Core Content – Month 10 – Stock Trading – Building Buy Watchlists” (a June 2017 recording published in October 2022), ICT demonstrates how he reduced the 30 Dow Jones Industrial Average components to six names — Apple, Boeing, Disney, Home Depot, McDonald’s and Visa — during the February-to-May seasonal…
Read the full summary
In this mentorship lesson, “ICT Mentorship Core Content – Month 10 – Stock Trading – Building Buy Watchlists” (a June 2017 recording published in October 2022), ICT demonstrates how he reduced the 30 Dow Jones Industrial Average components to six names — Apple, Boeing, Disney, Home Depot, McDonald’s and Visa — during the February-to-May seasonal window. His two filters come first: is the broad market technically poised to rally (1:54), and is the individual stock holding a higher low while the benchmark makes a lower low (2:04). Survivors are then ranked on the weekly chart by how close they sit to a prior high, which he frames as a low-resistance liquidity run (12:15). He narrows the final list to two to four names, mentions affordable call options and quarterly sales and profit growth as extra checks, and is explicit that everything in the lesson is hindsight (15:42) and that the criteria do not mean a pick will be right (20:53). The share prices and moves named below are his own readings off charts from 2017; the captions show the words, not the charts, and nothing in the source tests the method or documents a single fill.
How we researched this article
BestProps used document-based research from primary firm sources, checked September 24, 2026. The complete source list, scope, limitations, and commercial-state record appear near the end of this article.
This is the second lesson of the mentorship’s June 2017 content, and it follows the seasonal material from the first. The video is a worked demonstration rather than a live scan: ICT says he went through all 30 Dow stocks in advance to keep the recording manageable, and notes that the lesson could easily have run three hours (4:35).
The universe he starts from
The screen opens on the full Dow Jones Industrial Average component list (0:25). He says the same approach works on the S&P 500 and the Nasdaq 100 (0:45), and adds that the Dow 30 alone would be enough to generate all the stock trades a student needs (0:49). The seasonal influences per calendar month came in the previous lesson; this one stays on buy watchlists (1:01).
One framing point matters more than the tickers. He says he is not looking for individual monthly trades but for stretches in which the market is likely to want to trade higher (1:18), and that he splits the year into two bullish segments rather than one (1:33). The windows he names are February to May and October to January, both described as ideal long-swing setups (2:14). The earlier free-tutorial version of the material covered the fall; this lesson takes the spring (2:30).
These windows are his seasonal template, not a measured regularity. Nothing in the recording supplies the sample, the years or the failure rate behind the October-to-January block, and the February-to-May emphasis is illustrated with a single year, 2017.
The two filters
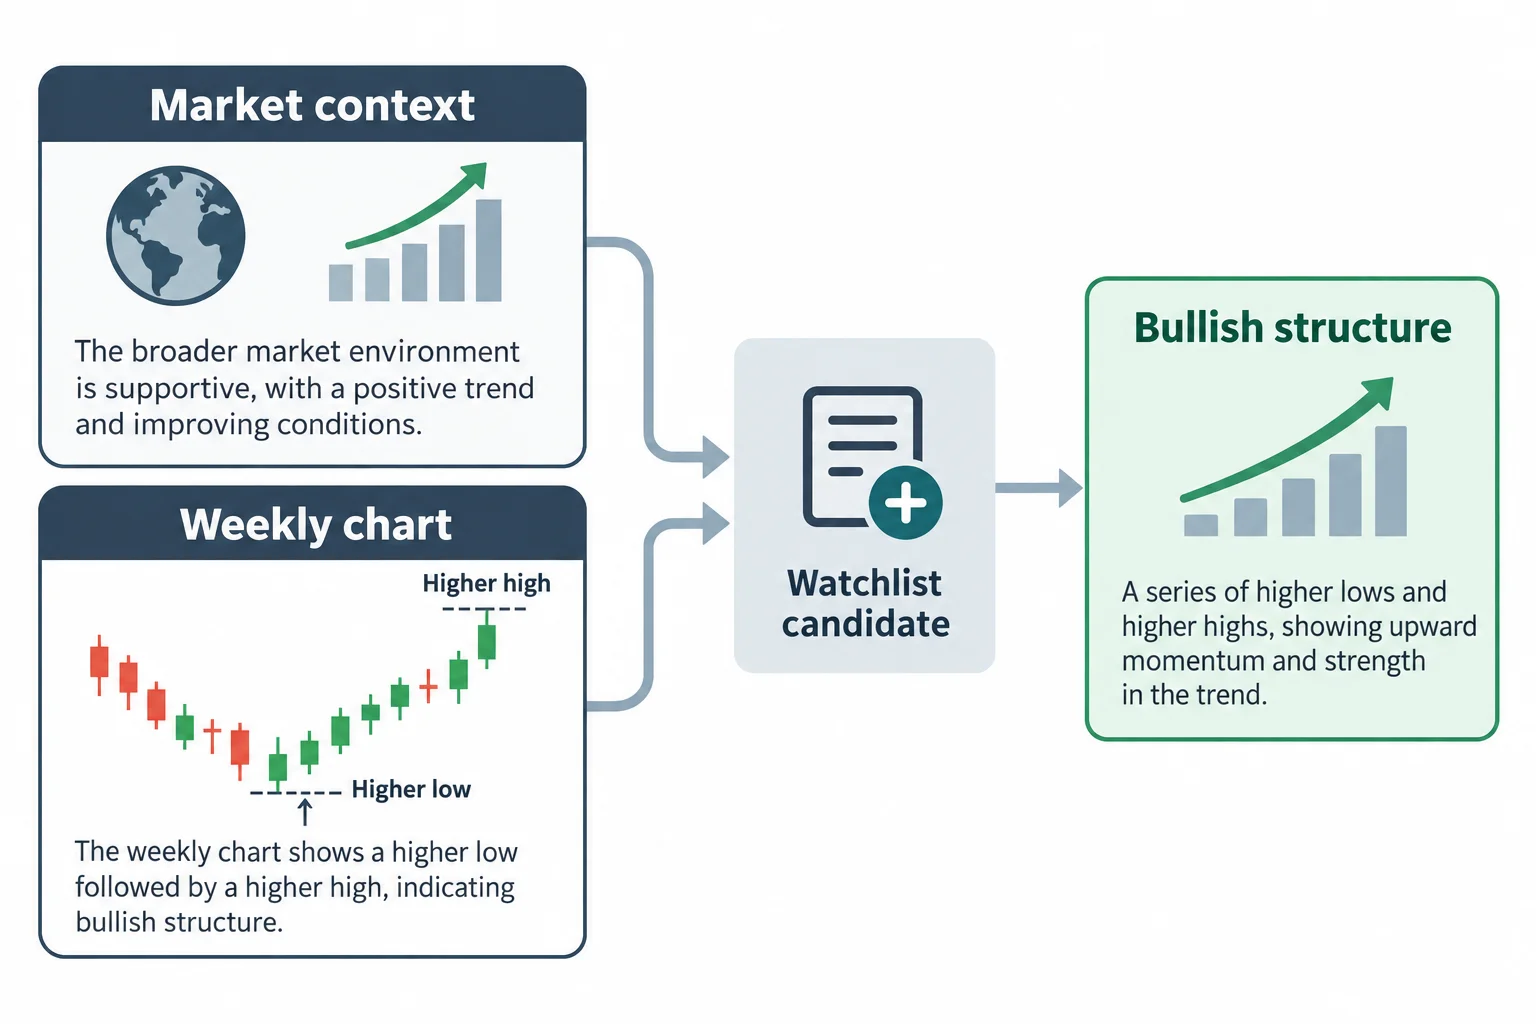
Filter one is whether the stock market is poised to rally — whether it is technically sound to anticipate higher prices (1:54). Filter two is that, during the bullish months, the search is for stocks that have already made a higher low (2:04).
He explains why the direction filter comes first with an old market saying — a high tide lifts all boats — and observes that most index stocks rise when the major market does (2:41). Stocks already trending higher on the weekly chart before the buying condition appears are his preferred material (2:53).
Two further instructions sit alongside the filters. He wants strong stocks with an obvious bullish structure, and names what he avoids: Verizon, GE — which he also calls General Electric — and Coca-Cola, described as safe names, not movers (3:04). He also suggests keeping the final selection to two to four companies (3:23). His exclusion list is explicitly personal and time-bound: he later adds Microsoft and Intel on the grounds that he did not find them exciting at the time of recording, then says his view may change (11:20). No screen produced those names; he did.
Relative strength, index SMT and what the comparison can prove
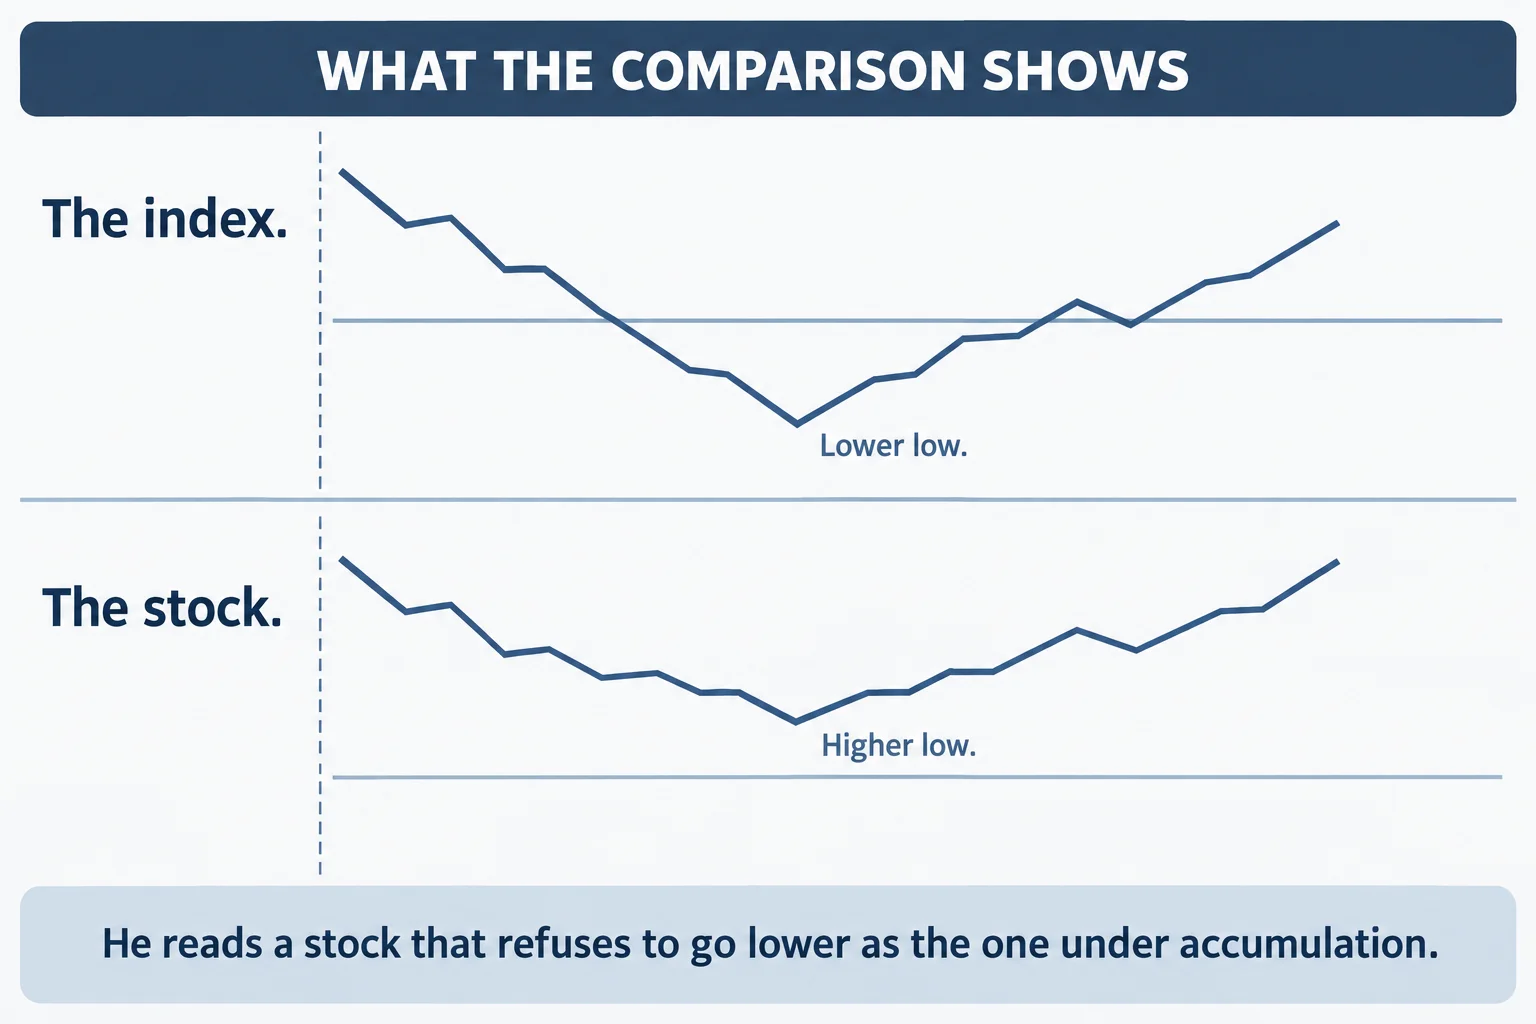
The screening mechanism is comparative. In a bullish month, when the three major averages — Nasdaq, S&P 500 and Dow — are making lower lows, he watches for one of them to fail to make a lower low, which he reads as a change of trend toward bullishness (3:56). At that same juncture he wants stocks making higher highs; when a stock does not confirm, it is discarded (4:13).
He calls the failure of one index to confirm the others index SMT divergence (3:14) and says the same comparison applied to a stock chart will highlight companies under heavy accumulation during seasonally bullish months (3:17). Two things should be kept apart here. The observable part — one instrument declining less than another — is plainly visible on a comparison chart. The explanatory part — that the difference is institutional accumulation — is his interpretation, and a price overlay cannot establish who was buying or why. “SMT” is also his own vocabulary rather than a standard published indicator.
The six Dow names he kept
Working through the Dow 30, he lands on six: Apple, Boeing, Disney, Home Depot, McDonald’s and Visa (11:37). The recurring test is the same in each case — in January 2017 the Dow made a lower low while the stock did not.
Apple. The Dow’s lower low came towards the midpoint of January 2017 while Apple failed to go lower, which he reads as relative strength and buying around 118 to 120 per share (5:19). He reports appreciation from February into May and a decline in June, at the time of recording (5:37). On the weekly chart he points to a 2015 high, down-closed candles supporting buying from April 2016 into February, a run through 135 and movement up to 155 per share (14:30).
Boeing. The same non-confirmation in January, after which he notes a January gap and its closure on the second trading day of February — the fair value gap or discount array he refers to (7:16). He also notes May’s typical decline into the third week of May that year (7:29). On the weekly chart he describes an old 2015 high, a move below 120 to clear out sell stops, institutional order flow supporting down-closed candles, clean levels at 150 and an old high around 160, then a move from 160 towards 200 per share (15:17).
Disney. He walks through a third stock on the daily pass without naming it there, describing February-to-May appreciation, a high made in May as the seasonal tendency changed, and a sharp decline afterwards (8:01). Disney is the remaining name in his six, and it receives a different verdict on the weekly chart: a 2015 high in the summer, a November high around 120, a short-term low in April–May 2016, and a structure he calls weak because a short-term high had already been broken (15:48). His argument is distance: it would have had to rally about 15 points before reaching the old high, so institutions would not be aggressive (16:38). He adds that 2017 commentary calling for 120 and 125 was a built-in sentiment idea he treated as contrarian, with price going just over 116 and then trading softer (17:03).
Home Depot. The Dow lower low against a stock that held, with divergence around 135 to 136 per share in January, a large January up day that created a liquidity void, and a February trade back into it that closed the range gap (8:51). On the weekly chart he calls it very similar to Apple and Boeing — close to the old high, so he expects it to be pushed through, and notes an appreciation of about 20 per share (18:15).
McDonald’s. Same overlay, and this is where he explains the mechanics of the comparison: on Barchart, add a comparison and set a left-axis display on the Dow symbol to overlay the index against a share price (9:45). He reports a move up to 142 per share and later as high as 153 (10:26). On the weekly chart he places it inside a larger consolidation that had respected a bullish order block around 120, with a low-resistance liquidity run anticipated towards 132, then a breakout and an aggressive run above 132 to as high as 155 (18:43).
Visa. The final daily example, again a Dow lower low in January against a stock unwilling to follow (10:39). Weekly, he describes it trading close to its highs and being pushed through, and reports appreciation of about ten dollars per share — the least forceful of the six, though he says the structure still met the criteria (19:14).
The dollar figures above are his own hindsight readings of daily and weekly charts from 2017. They are quoted here as his claims, not as verified outcomes: the transcript records the numbers being spoken without exposing the charts, the data used, the entry convention, whether any position existed, or how the returns were calculated.
Ranking the survivors on the weekly chart
Once the list exists, the ranking question is how much room a stock has before it meets old highs. He describes low-resistance liquidity runs as anticipating a break of market structure that is already qualified, and says institutions like large breakouts, especially on a weekly chart (12:28). When a fundamental case, a bullish major market and a seasonal tailwind line up, he calls it a blue-ribbon recipe for wonderful results (12:45).
A stock too extended from weekly or daily market structure is removed from the list entirely (12:04). The passage where he explains why is garbled in the automatic captions — the line reads “if you have a market structure hide it’s really hire them where you’re going to be entering at” — but the sense that follows is clear enough: if the entry sits well below the structural high, he expects lethargic price action that may stall sideways or reverse altogether (12:50). Because the sentence itself cannot be recovered from the captions, this article paraphrases the direction of the argument rather than quoting it.
Quarterly increases in sales and profits are mentioned as a further factor that could keep a stock on the list (13:08), and he frames the outcome as blending a simple seasonal, fundamental and technical process (13:14). What that factor looks like in practice is not shown: there is no earnings comparison, no threshold, no balance-sheet work and no example of a name being added or dropped on those grounds.
Turning six names into two to four
His stated method for cutting the six down is to pick call options that are affordable and to weigh where each name is trading in historical terms (11:55). Nothing beyond that is supplied. The recording names no strike, no expiration, no position size, no stop and no exit rule, and it gives no cost or implied-volatility discussion. A reader taking the idea further is adding that layer themselves, and options can expire worthless as well as lose value to time.
The closing caveats, in his words
The process can be repeated on the Nasdaq 100, and on the S&P 500 with more work and more candidates (20:11). He then collects the components — a fundamental basis for higher prices, a seasonal tendency, relative strength, index SMT divergence and a stock that is not making a lower low — and calls that every portion of a winning recipe (20:47).
He immediately limits that claim, and the limit is the most important sentence in the lesson: it does not mean the pick will be right; it means that, statistically and historically speaking, he considers those elements to be present in winning stocks (20:53). No statistic is presented, and the examples were selected after the fact.
What the lesson gives a student, and what it leaves open
The transferable part is a research order: fix the direction of the wider market first, screen for who is declining least when the benchmark declines, then rank the survivors by how much room they have to a prior high. That is a coherent way to organize a large universe, and the comparison overlay he describes on Barchart is a concrete, checkable tool.
The open items are substantial. “Higher low” is a visual judgement with no lookback or tolerance attached. The seasonal windows are asserted rather than measured in this recording. The exclusions rest on his personal interest in the companies. The ranking step assumes that proximity to an old high predicts a breakout. Every example comes from one year, with the outcomes known in advance, and he says so. There is no prospective test, no risk framework and no audited performance, and the lesson is not a recommendation to buy any of the six names. Anyone evaluating the method should define the rules objectively, test them out of sample, and keep risk management separate.
Watch the original lesson
This article draws on the timestamped English captions of “ICT Mentorship Core Content – Month 10 – Stock Trading – Building Buy Watchlists”, a recording made for the June 2017 release and published on YouTube on 21 October 2022, listed at about 21 minutes. Captions are a source for the speaker’s words; they cannot verify share prices, chart levels, fills or outcomes, and the reviewer read captions rather than watching the charts.
Watch the original lesson on YouTube
This lesson cannot be played inside another website. When its embedded player was loaded from a BestProps origin and clicked on 15 September 2026, the player itself reported “Video unavailable” and “Playback on other websites has been disabled by the video owner.” at both desktop and mobile widths, with no duration reported and no playback progress. That is why no embed is used here. The video is public on YouTube and plays normally on its own watch page.
Resources
These are the sources checked for this article. The publisher’s own pages are the first-party record of what ICT releases; the Investor.gov pages are neutral U.S. regulatory references for stock investing and for how marketed systems and performance claims are presented to the public. None of them assesses the speaker, verifies a share price or a reported move in the recording, or tests the method. Any ICT, smart-money or third-party indicator, note set, screener, script or re-upload circulating outside the publisher’s own pages, and any tool built on these concepts, is unofficial and untested here.
- [1] ICT Mentorship Core Content – Month 10 – Stock Trading – Building Buy Watchlists — The Inner Circle Trader (primary source; watch page read 15 September 2026, listed at about 21 minutes)
- [2] The Inner Circle Trader — official YouTube channel (read 15 September 2026)
- [3] Investor.gov (U.S. SEC) — Stocks (read 15 September 2026) — the regulator’s plain-language description of how stocks work and the risks attached to them.
- [4] Investor.gov (U.S. SEC) — How to Avoid Fraud (read 15 September 2026) — background on how historical or hypothetical performance claims are presented to the public.
This is independent educational commentary on one speaker’s own retrospective review. It is not official ICT material, it is not a tested trading system and it is not investment advice. Every share price and dollar figure appearing above is the speaker’s own hindsight reading of 2017 charts, not verified data and not audited performance. Nothing here is a recommendation to buy any security. Stock and options trading carries risk of loss, including the total loss of an option premium.