
Key takeaways
Despite its title, this recording is not an options lesson.
Read the full summary
Despite its title, this recording is not an options lesson. The captions open with an ICT mentorship lesson dated June 2017 and titled “Lesson Four — valuation, stock selections”: it explains how ICT screens growth stocks before any contract is chosen, using William J. O’Neil’s CAN SLIM framework and Investor’s Business Daily. The screens he describes are quarterly earnings growth of at least 25% with acceleration, annual earnings growth of at least 25% in each of the last three years, industry-group margins and return on equity of at least 17%, something new about the company, a comparatively small share float and a share price he prefers above $20, leadership inside a leading industry group, ownership by at least ten mutual funds, and sponsorship rising across two to three quarters. He then adds his own market-direction read — Dow Theory plus institutional order flow, market structure, premium and discount arrays, divergence between the three major averages and seasonal tendencies — and gives a seasonal calendar of buying February to May, selling or shorting May into mid-September, and buying again from the second half of September through year-end. Options appear only at the end, as the subject of the next lesson, where he describes calls as cheap leverage and claims returns of double, triple or quadruple the premium. Strike, expiry, implied volatility, time decay, assignment, liquidity and maximum-loss management are not covered here, and the recording contains no completed selection, option chain, verified fill, test or performance record.
How we researched this article
BestProps used document-based research from primary firm sources, checked September 24, 2026. The complete source list, scope, limitations, and commercial-state record appear near the end of this article.
The video ICT Mentorship Core Content – Month 10 – Stock Trading – Using Options carries an upload timestamp of 22 October 2022, 12:00 p.m. Pacific, on the Inner Circle Trader channel, and the watch page reports a runtime of 35 minutes and 59 seconds. The presentation itself is not from 2022: the speaker opens by welcoming viewers back to “June 2017, ICT mentorship, stock trading, Lesson Four — valuation, stock selections” (0:12, 0:17). The two dates are different things — a 2017 mentorship lesson that was published to the channel in 2022 — and the lesson content is the 2017 material, so nothing below is a 2022 market observation.
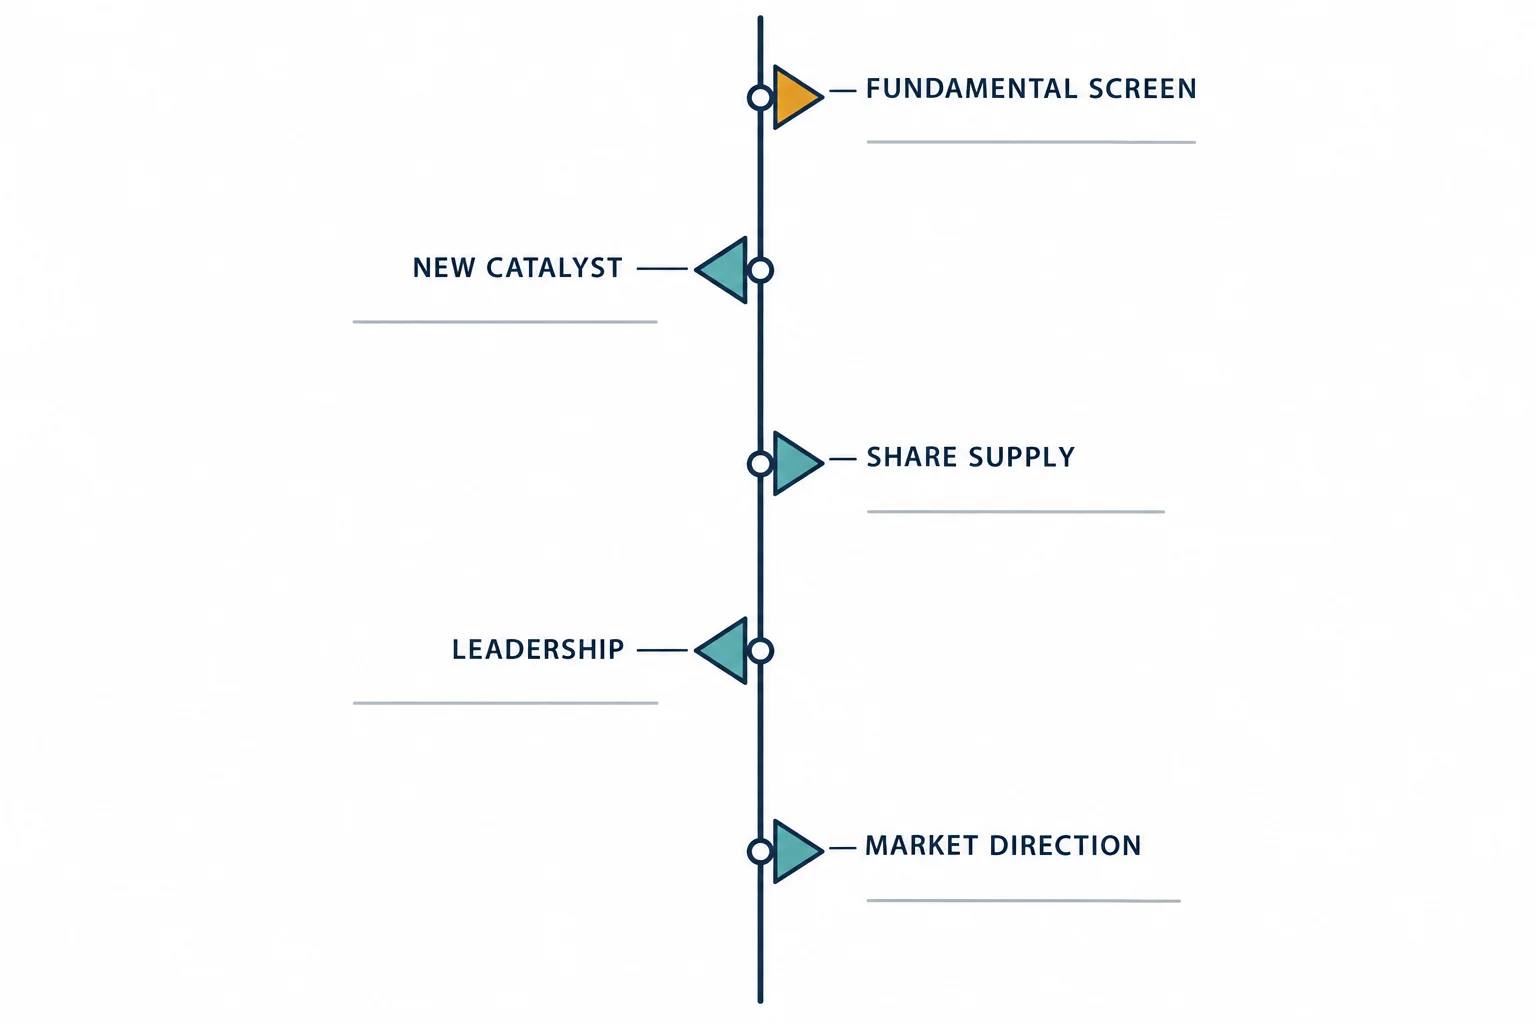
This article is a source-grounded reading of that full caption track — 899 timestamped segments covering the whole recording — rather than of the video’s title or watch-page metadata. Every timestamp link below opens the primary source at the point being described. What follows is a description of one trader’s research routine and of claims he makes on camera; it is not evidence of a repeatable edge and not a recommendation to buy or sell anything.
Why the lesson starts with Investor’s Business Daily
The first several minutes are a recommendation of Investor’s Business Daily (IBD) as the resource he uses to organise company fundamentals, industry groups and institutional participation. He says he has used it since the late 1990s, calls it the best fundamental slant on stocks he knows of, and contrasts it with the Wall Street Journal, which he says felt stuffy to him as a new trader (0:46, 1:02, 1:12). He is explicit that he is not a salesman for the publication and has no business relationship with it (2:52, 2:54), and he says other tools can supply part of the same information, naming an ordinary bar chart or a market-watch page for the common earnings data while saying the annual and quarterly detail comes from IBD alone (10:16, 10:28). For readers who do not want to subscribe, he mentions buying the weekend print edition at a newsstand (4:39), and he describes a four-week trial he suggests timing to the second week of September (2:49).
He frames the whole lesson as borrowed method. He states that he is not claiming ownership of the framework, that most of what follows is material from William J. O’Neil’s book on making money in stocks, and that the fundamental half of his process is essentially that framework applied through IBD’s tables (6:47, 3:59, a later restatement at 4:05).
CAN SLIM, letter by letter, as he teaches it
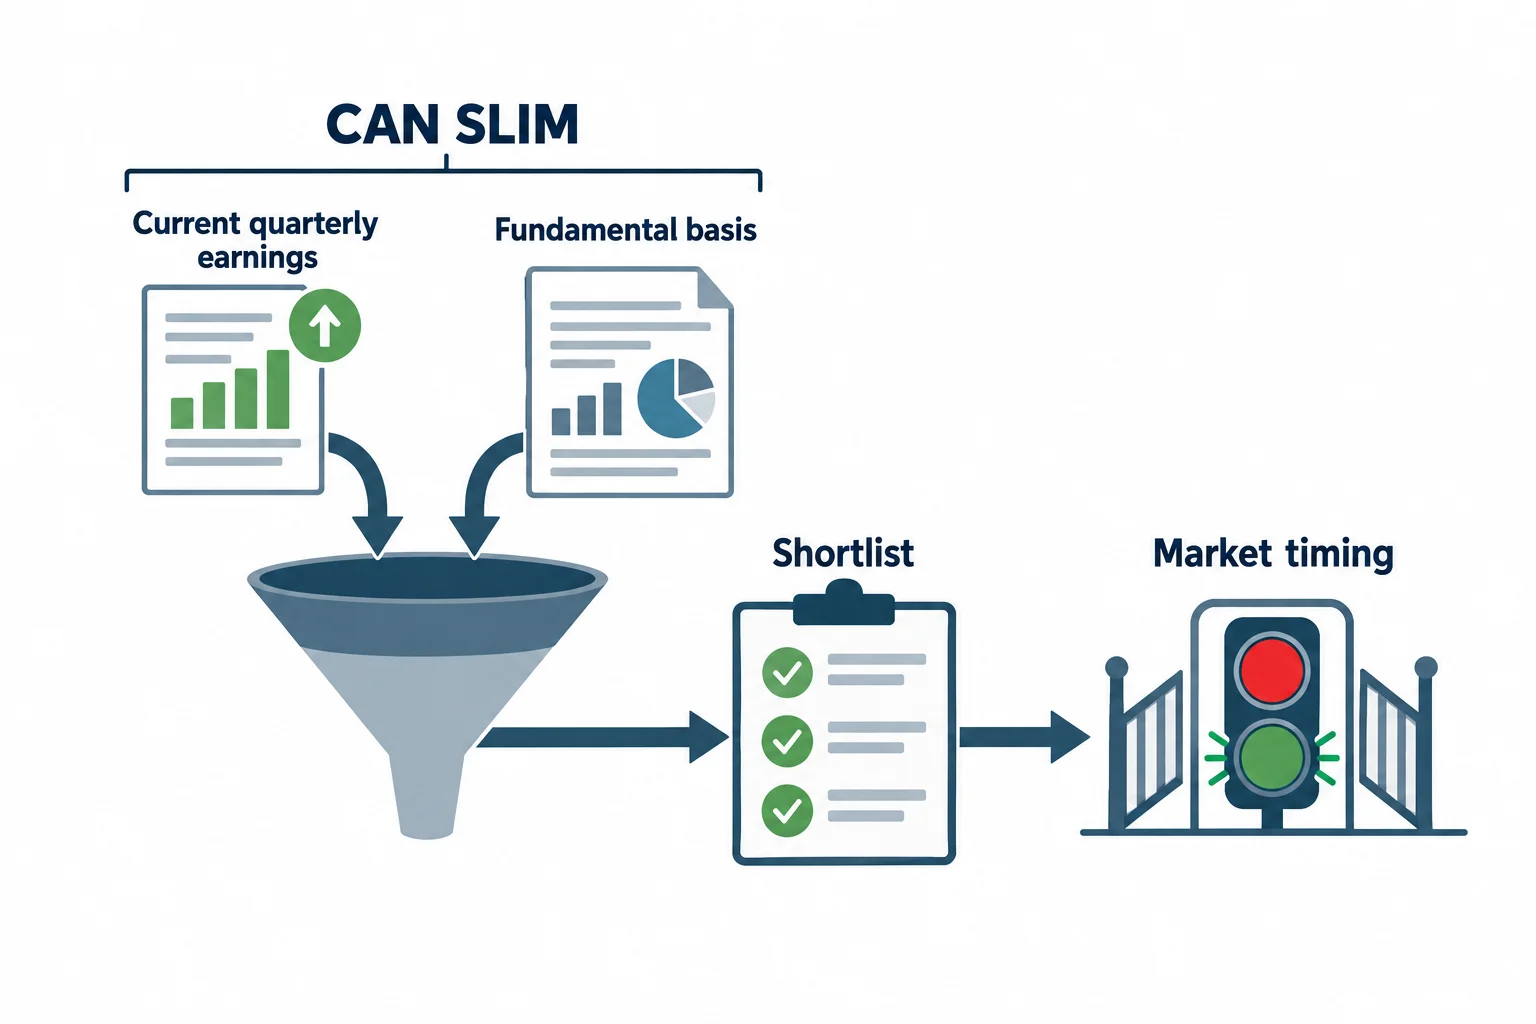
He introduces the acronym at 6:57 and says he subscribes to the CAN SLIM theory O’Neil created. He also draws a boundary that matters for reading this lesson: everything up to the final letter is his fundamental basis, and the final letter is where his own price-work enters, because he does not consider O’Neil’s market timing sufficient (7:46, 8:24). Before starting, he recalls that the index universe he has already taught covers 630 stocks across the Dow 30, the NASDAQ 100 and the S&P 500 (6:10, 6:20).
C — current quarterly earnings
The first filter is the latest reported quarter. He says he looks for earnings growth of at least 25% and prefers larger growth, and he wants the growth rate itself to accelerate across the last three quarters rather than sit flat — his example is 25%, then 50%, then 90% (8:38, 8:49). These are the thresholds of the framework he is summarising, not results he tests in the recording.
A — annual earnings
The second filter is annual. He says he wants annual earnings growth of at least 25% in each of the last three years, and he adds that the biggest historical winners tended to carry the best margins in their industry group together with return on equity of at least 17% (9:22, 9:26, 9:38). The recording shows no company statements or calculations, so any of these figures would have to be verified against current filings on consistent accounting periods before being used.
N — something new
The “new” factor, which he calls essential to the biggest winners he has selected, can be a new product, a new service, new leadership or management, a new price high, or a new condition in the industry (10:39, 10:52). He cites research saying 75% of the greatest winners came public within the previous eight years (11:08), and uses Facebook’s IPO as his example — including his recollection of telling friends to wait for roughly $20 a share before buying (11:22, 11:32). He then turns the idea into a workflow: once a list of companies with strong quarterly and annual earnings exists, search for news that gives each one a reason for fresh attention, because attention at the retail level tends to be accompanied by attention at the institutional level (12:55, 13:31).
S — supply and demand for the shares
He is careful to say this is not chart supply and demand. Here the supply is the number of shares available: he prefers a reasonable float and argues that, with the other criteria equal, a company with fewer shares outstanding can be repriced faster when institutions accumulate, while index-style names with large floats move less violently in both directions (14:03, 14:46, 14:52, 15:46). He also states a personal price preference of above $20 a share, and in the same passage acknowledges that growth stocks with small floats can fall as quickly as they rise (14:46, 15:12). The float comparison is his reasoning about liquidity, not a measured result.
L — leaders, not laggards
Leaders, in his definition, are companies with the best earnings growth, the strongest sales and the best price performance inside leading industry groups, and his summary instruction is to buy high and sell higher (16:02). He connects that instruction to the price concepts taught earlier in the mentorship — a move away from a discount array and a run toward buy-side liquidity — and cites a study he attributes to O’Neil’s company finding that the strongest stocks got stronger (16:18, 16:42, 16:59). Relative strength analysis is the tool he names for sorting them, and his stated goal is to own the strong and avoid the laggards (17:05, 17:27). Relative strength here is a ranking of past performance, and the recording offers no evidence that a high ranking persists.
I — institutional sponsorship
Institutional sponsorship is the letter he says he talks about most. He describes mutual funds, pension funds and banks as the players that move stock prices, quoting a figure of as much as 80% of all trading activity, and his screen asks for at least ten mutual funds holding the stock and rising sponsorship over two to three quarters (17:33, 17:43, 17:56, 18:06, 18:10). He says he does not dig this out manually but reads it from IBD’s rankings and scanner, and singles out their institutional-sponsorship views as the most useful part of the service when used at the right time of year (18:20, 18:47). Sponsorship data is reported with a lag and says nothing about an institution’s entry price, current intent or exit plan.
M — market direction
The last letter is where he leaves O’Neil behind. He accepts the premise that three out of four stocks follow the broad market and that positions should be taken only with a confirmed uptrend, but for timing he says he subscribes to nobody else’s theory: Dow Theory is all he needs for stock technicals, combined with institutional order flow, market structure, premium and discount arrays, quarterly shifts and seasonal tendencies (19:06, 19:11, 19:19, 19:39, 20:01). He is blunt that the older wave-counting approaches he once worked with mostly did not hold up, and he presents the timing combination as his own rather than anyone else’s (21:26, 20:08).
The seasonal calendar he gives
The practical output of the lesson is a calendar. His rule is to buy stocks from February into May, to sell or look to short from May into the latter half of September, and then to be a buyer again from roughly the second half of September into the last day of the trading year (22:53, 22:57, 23:20, 23:17). He says the same pattern repeats annually, that its purpose is simply to know when large, deep-pocketed participants are predisposed to operate, and that if you know when the market is inclined to rise you can filter for stocks already showing leadership before that window opens (21:34, 23:57, 22:26).
He then describes what he will do in the fall session he has promised: work through the Darlings of the Dow and Dogs of the Dow concepts, go over the index stocks of the S&P, the Dow and the NASDAQ, take IBD’s fundamentally ranked stocks and keep the ones with the technicals he wants, and finally price the options for the names that survive — a process he says involves sorting roughly 7,500 stocks and that he intends to do by hand rather than through IBD’s scanner (25:49, 26:02, 26:17, 24:35, 24:48, 30:38). He also notes a limitation he found in the ratings themselves: IBD can grade a stock strongly on fundamentals while its price shows nothing that attracts institutional money, which is why he treats the fundamental list as a starting universe rather than a signal (26:53, 27:00, 26:53).
Where options actually enter, and what is missing

Options are introduced only in the closing minutes. He says the fifth lesson of that week’s content covers how to use and pick stock options, and that the point of doing it live is to track how the contracts appreciate (30:43, 30:47). He describes a call as costing very little money relative to the stock, argues that a small share-price move can produce a large percentage return on the premium, and frames the objective as velocity rather than long-term holding: he says he does not believe in buy-and-hold, and uses an account of Amazon reaching roughly $1,000 a share as his illustration of a move he says he expected (31:08, 31:24, 31:35, 31:52, 32:51). Those return figures — “double, triple or quadruple your money” — are his claims about what a call option can pay, delivered as encouragement, not as records of his own or anyone else’s fills. Nothing in this recording shows a contract, a premium, an expiry or an outcome.
The gap between this lesson and an options trade is worth stating plainly, and this paragraph is general educational context rather than ICT’s method. Choosing a promising underlying stock is a different task from choosing a contract: even with the direction right, an option can lose value because the move is too small, arrives too late, or is offset by falling implied volatility, and every option carries an expiry date after which it can be worthless. Strike selection, expiry choice, implied volatility, theta decay, assignment, bid-ask liquidity and position sizing for maximum loss are all outside this recording. Anyone acting on the stock-selection process alone would still have to decide those things separately, and leveraged options can lose the entire premium quickly.
What the lesson does and does not establish
Read against the transcript, this is a screening lecture with clear structure and several candid admissions. He says plainly that he cannot claim ownership of the framework and that he subscribes to the theory O’Neil created (6:47), that the final letter of the acronym is where his own input begins because he does not consider O’Neil’s market timing sufficient (7:43, 7:55), and that he does not subscribe to anyone else’s theory of market direction either (19:29). He also describes his own path through the older methods, saying he worked with everything available before 2000 and concluded most of it is nonsense that works only sometimes, and that this is why he built his own seasonal and timing read (21:13, 21:17, 21:23).
Two passages are worth flagging because they qualify the method more than the framework does. He describes IBD as a front-running tool and compares what it produces to a pump-and-dump dynamic, while insisting he is not investing to hold for twenty years (29:13, 29:17). And he rejects O’Neil’s stated practice of risking up to eight per cent on a single stock as nonsense, saying his own money-management rules will be shown separately when he runs the process live (29:41, 29:49, 29:51). Elsewhere he calls day trading stocks foolishness and frames anything less disciplined than swing trading as gambling (33:36, 33:42, 33:50).
What it does not contain is any completed stock selection, option chain, entry, exit, fill or result. The earnings figures, the 17% return-on-equity threshold, the 80% institutional-activity estimate, the 75% new-company statistic and the claimed option returns are all reported by the speaker as he presents the framework; the caption track carries no supporting data, and none of it is independently verified here. The seasonal calendar and the timing combinations are his interpretations. A stock appearing on a fundamental or IBD list is not a reason to expect it to rise, and past moves in any named company say nothing about its future price.
Watch the original recording
Watch the original lesson on YouTube
This recording cannot be played inside another website. Its embedded player was loaded from a BestProps origin and clicked on 15 September 2026: it reported “Video unavailable” and “Playback on other websites has been disabled by the video owner”, with no duration and no playback progress. The recording’s own watch-page data agrees that it is not playable in an embed, so no iframe is placed here. The video itself is public and available directly on YouTube.
Watch ICT Mentorship Core Content – Month 10 – Stock Trading – Using Options on YouTube ↗
Source and further reading
- ICT Mentorship Core Content – Month 10 – Stock Trading – Using Options — the primary source and the only recording used here. Uploaded 22 October 2022; a June 2017 mentorship lesson by its own opening. Use the timestamp links above to compare each step with what he actually said.
- The Inner Circle Trader YouTube channel — the publisher’s own channel, where this core-content lesson and the ones it refers back to are posted. Reuploads and summaries are not the source used here.
- Investor’s Business Daily — the commercial screening service the lesson is built on, including the earnings, relative-strength, composite and institutional-sponsorship data he relies on instead of reading fundamentals himself. It is a paid product, not an independent test of this method, and nothing here verifies the ratings it produced in 2017.
- Investor.gov (SEC) — Stocks — the US regulator’s investor education pages on how stocks and their risks work, plus its companion guide on how to avoid fraud. General context for reading any stock-selection method presented with confident claims; it does not assess this presenter or any company mentioned.
BestProps is not affiliated with the Inner Circle Trader, Investor’s Business Daily or the SEC, and no source listed here endorses this article. CAN SLIM, relative strength, institutional sponsorship, quarterly shift, seasonal tendency and premium and discount are used as descriptive terms for what the recording teaches. Every threshold, estimate and claimed return above is the speaker’s own presentation, reported to camera and not verified here: the caption track contains no price data, no option contracts and no results. Options can expire worthless and leveraged trading carries a substantial risk of loss. This is independent educational commentary on a public recording, not official ICT material, not a tested trading system and not investment advice.