
Key takeaways
This June 2017 ICT mentorship lesson on commodities sets out a relative strength method for ranking markets against the U.S.
Read the full summary
This June 2017 ICT mentorship lesson on commodities sets out a relative strength method for ranking markets against the U.S. Dollar Index. The speaker treats the dollar as the market that “sets the tone,” then looks for the contract that fails to make the lower low when the dollar is making a higher high — a divergence he reads as relative strength, and which he attributes to institutional accumulation. The bearish version is the mirror image: a commodity that fails to make the higher high while the dollar is bullish, which he reads as relative weakness or distribution. Contracts that move with the leader but later and less efficiently are called sympathetic participants. He then walks a commodity basket group by group — grains, livestock, foods, fibers, debt, currencies, metals and energies — and for the period from the summer of 2016 into June 2017 calls soybeans the grain leader, feeder cattle the strongest of the livestock, cotton the outperformer in fibers, and gold, copper and crude oil strong, while corn, wheat, cocoa, coffee, sugar, the Treasury contracts and the British pound fell short of his bullish criteria. Sugar and silver are both offered as examples of an early divergence that failed. Every dollar amount in the lesson is his own arithmetic performed aloud over past charts; the recording reports no fills, sizes, orders or account results, and he introduces the material as paper trading only.
How we researched this article
BestProps used document-based research from primary firm sources, checked September 24, 2026. The complete source list, scope, limitations, and commercial-state record appear near the end of this article.
In ICT Mentorship Core Content – Month 10 – Relative Strength Analysis – Accumulation & Distribution, the speaker presents a way of narrowing a large commodity universe down to the handful of markets he thinks are worth studying. The recording announces itself as commodity trading lesson number two in the June 2017 mentorship (0:30) and states its subject as relative strength analysis, professional accumulation and distribution (0:36). The watch page dates the upload to 16 October 2022, so this is a later re-release of 2017 material; every market example below belongs to that historical presentation.
He opens with a disclaimer: he says he is not a CTA and not a commodity trade adviser, and that everything in the discussion is to be taken as paper trading only (0:07, 0:14). The method below is his stated framework and his reading of past price action. It is not a tested system, and nothing in the recording is a claim about verified profitability or independently confirmed institutional activity.
The commodity basket he works from
He divides commodities into two main camps, agricultural and financial (0:48, 0:56), and then names the contracts he personally follows in each group:
- Grains: corn, wheat and soybeans, which he identifies as Chicago Board of Trade markets, with canola and oats mentioned as thinner alternatives he does not concern himself with (1:02, 1:17).
- Livestock: feeder cattle, lean hogs and live cattle (1:47).
- Foods: cocoa, coffee and sugar, plus orange juice, which he calls thin but keeps on his watch list because of freeze risk in Florida (2:21, 2:24).
- Fibers: cotton, with lumber excluded for being too thin (2:28).
- Debt: the 30-year Treasury bond, the 10-year Treasury note and the 5-year Treasury note (2:37, 2:39).
- Currencies: Australian dollar, Canadian dollar, Japanese yen, British pound, Swiss franc, euro and New Zealand dollar (2:50, 2:54).
- Metals: gold, silver and high-grade copper, with palladium and platinum noted as metals he followed in the early 1990s and dropped (2:57, 3:00).
- Energies: crude oil (3:14).
He compares the size of that list to the currency market, saying there is a comparable sample size to choose from and that a trader can decide which market to specialise in. He names the Treasury bond, gold, silver and copper, soybeans, wheat, feeder cattle and live cattle, seasonal lean hogs, and then cocoa, orange juice, coffee, sugar and cotton as the markets he actually traded when commodities were his asset class (3:26, 3:32, 3:45, 3:50). Those remarks are his trading history as he relates it, not documented order records.
The core idea: let the dollar set the tone
His definition of relative strength analysis is that it factors your analysis around the most important market to follow when you are bullish, and the most important market to follow when you are bearish (4:01, 4:05). In practice that anchor is the U.S. Dollar Index, which he calls the king and says sets the tone for everything else, especially commodities (4:23).
The directional assumption is stated plainly: if the dollar index is expected to trade higher that puts pressure on commodity prices, and if it is expected to trade lower that allows higher commodity prices (4:35, 4:40). That is his interpretation of the relationship, presented as a working assumption for the lesson rather than an invariant rule of markets.
He is also explicit that a divergence on its own is not a trade idea. The first step, which he returns to at the end of the lesson, is forming a view on where the dollar is going (4:50).
The bullish read: failing to make the lower low
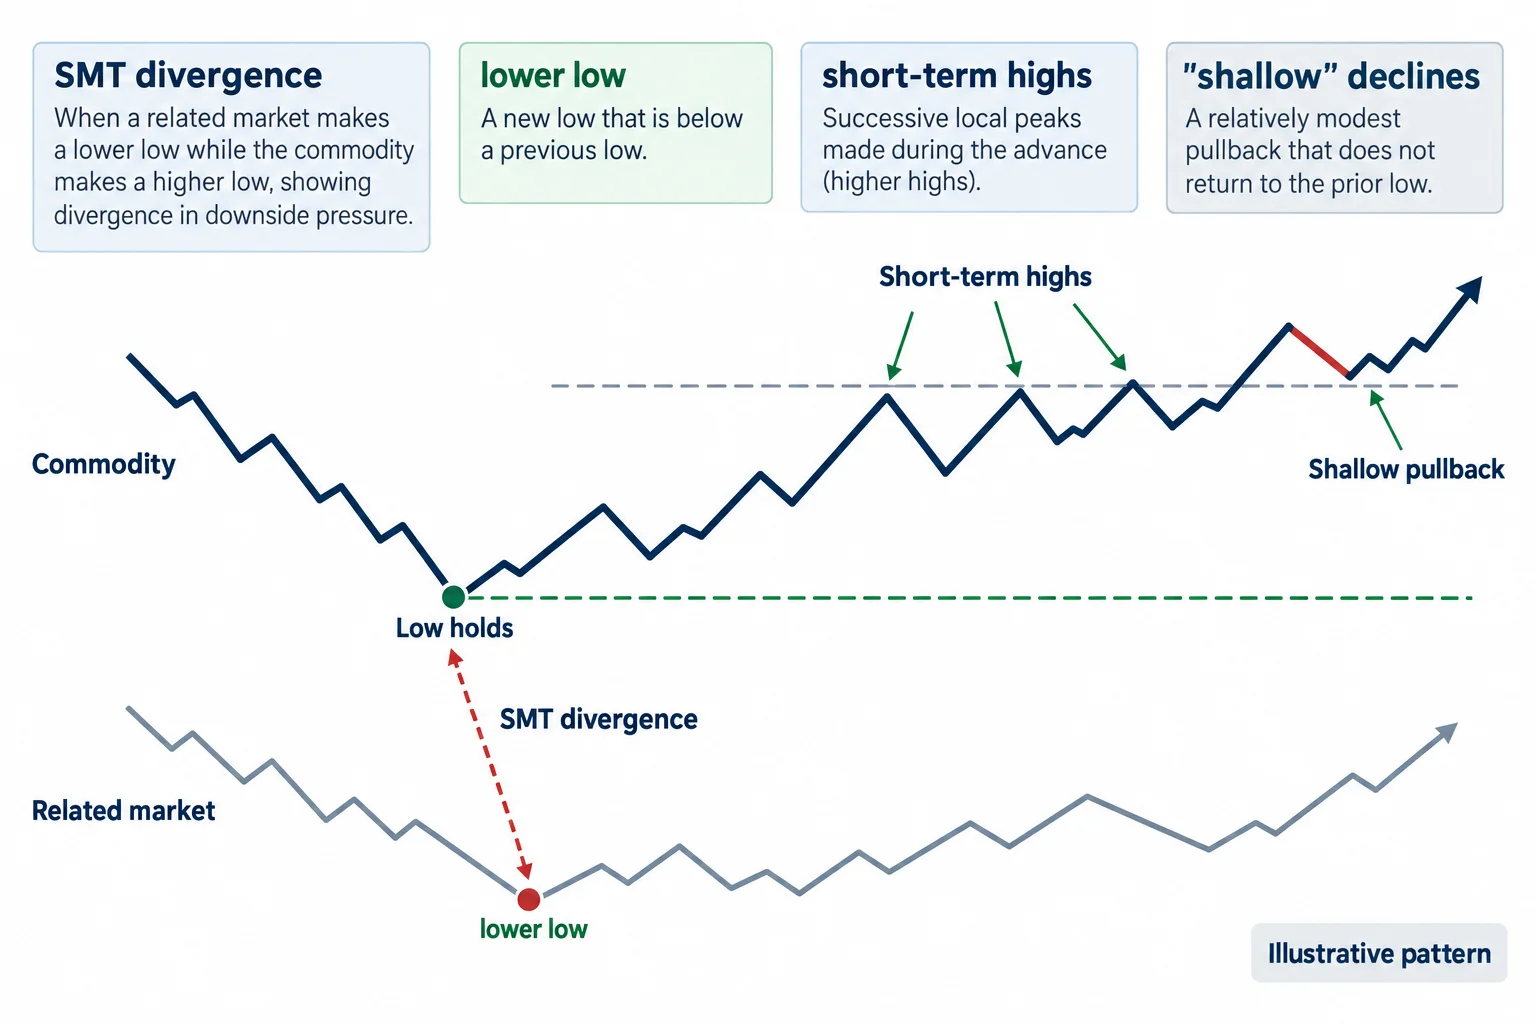
What he calls an institutionally sponsored rally starts with a market that has failed to go lower at a time when the dollar index would be expected to go lower, which he describes as the dollar making an important high or even a topping formation (4:56, 5:00, 5:03). The commodity to focus on is the one that fails to make a lower low, which he calls basically an SMT divergence (5:23).
He then lists the confirming behaviour he wants to see: the market trades higher energetically as a leader, establishes a direction opposite to the dollar index, breaks short-term highs, and produces declines that are shallow rather than deep, with up-closing candles typically larger than down-closing ones (5:40, 5:42, 5:56, 5:58). When he sees a market diverging from the dollar index in that way, he reads professional accumulation or institutional sponsorship (6:20).
That last step is an inference about who is on the other side of the trade rather than an observation. The captions contain no order flow, volume or position data that identifies a buyer, so “institutional accumulation” should be understood as his label for a price pattern. He makes this explicit elsewhere in the lesson, saying the read comes from price action with no indicators and “no bells and whistles” — simply recognising what the pattern looks like (36:13).
Leaders, sympathetic movers and weak sisters
The comparison becomes group-specific. Within a group such as the livestock complex, one contract may hold a higher low while the others make lower lows; he calls the resilient one the leader and says his preference is to study it because it should move with greater speed and magnitude (9:22, 9:35, 9:38, 9:51).
Markets that later rise without showing that initial relative strength are described as participating in a sympathetic rally, or as the weak sister of the group. He says those moves can still be traded, but that they arrive in sympathy with the leader, at a lesser degree of speed and magnitude, and more lethargically (10:27, 10:36, 10:42, 11:20).
The bearish read: failing to make the higher high
He presents the opposite case as the same sequence reversed — what he calls an institutionally sponsored decline, where a market trades lower energetically as a leader and establishes a direction opposite the dollar index, with short-term lows broken, shallow rallies, and down-closing candles typically larger than up-closing ones (11:55, 12:02, 13:32). The focal point is the failure to make a higher high while the dollar index is bullish and about to rally; those are the contracts he expects to lead on the downside, because they show underlying price weakness (12:38, 12:49, 12:52).
There is a sympathetic version of the decline as well, where a market trades lower in sympathy with the leader and the aim is to focus on the weakest of the group (13:05). He works through it with a grain example: if the complex should be moving lower and wheat and corn each make a higher high while soybeans makes a lower high, soybeans is the outperformer on the downside, and wheat and corn may decline too but in a sympathetic fashion (14:10).
Both halves of the method are descriptive labels applied to past charts. Nothing in the recording tests how often the pattern resolves the way the label implies, and there is no control group or outcome data behind the categories.
Walking the basket, summer 2016 into June 2017
From 14:38 he works through the whole basket against the dollar. He frames the period as the dollar rallying from the middle of the summer of 2016 up into January 2017, making a high, then weakening after January 2017, so commodities should have been expected to fall while the dollar rose and to be watched for leadership on the way up afterwards (15:00, 15:06, 15:12).
Grains and livestock
Corn is his first example and he calls it weak. It kept making lower lows while the dollar index made higher highs, and although it formed a higher low from December into January, he describes the subsequent move from 360 up to 390 as only a 30-cent move, which he prices at about $1,500 per contract, and concludes the grain was not showing any leadership buying (15:54, 16:54, 17:00). Wheat gets the same treatment: continued weakness, a consolidation that failed to produce a significant rally (17:50).
Soybeans are the contrast. He says the market failed to make lower lows from August through October while the dollar made higher highs, which he read as early accumulation, and that it later traded down with a higher low around a level he voices as 1080, after which he identified the bean complex as the grain group’s leadership issue. He prices that rally at about $4,500 per contract (18:05, 18:15, 19:08).
Feeder cattle are presented as the strongest case in the lesson. While the dollar index made higher highs into the autumn, feeder cattle failed to go lower, which he calls signs of accumulation and attributes to large traders buying; short-term highs then broke repeatedly, and in the February–March period the market traded back into what he calls a bullish order block while the dollar made a further intermediate high around a level he voices as 102 (19:33, 19:45, 20:15, 20:51). He says feeder cattle developed a premium, that the price move went parabolic, and he prices the move from the low to the high at over $199,000 per contract (20:31, 21:39).
Lean hogs show the same accumulation pattern from October into December, then a later dollar selloff from a premium array and a liquidity void, a return to a bullish order block, and a rally he describes from 68 to 81.5 cents that he prices at about $5,600 per contract (22:18, 22:44, 22:50). Live cattle get the same description — failing to go lower while the dollar rallied, a March buying opportunity, a trade into a bullish order block and a rally he prices at $122,000 per contract (23:01, 23:40).
Foods, fibers and the debt contracts
Cocoa is the clean negative case. He says it was clearly under distribution after a bumper crop and that there was no supply-and-demand impulse that would swing it into a shortage, so it never met his criteria as a buy while the dollar was dropping (23:51, 24:03). Coffee made lower lows through December into January and he calls it weak despite a retracement (24:38, 24:49).
Sugar is his cautionary example. He describes a small divergence at the lows that produced a rally, then weakness after price came back into a premium array or bullish order block around a level he voices as 2050, where it could not find any further bullishness. He uses it to make the point that students will also see setups that start like a good move and then fail, because that is what real environments are like (25:01, 25:24, 25:29).
Cotton, the only contract in his fibers basket, is presented as a success: after a slide from August into September it traded back into a bullish order block while the dollar rallied, stopped going lower, and began making successive higher highs and higher lows with every short-term high breaking, which he reads as accumulation, with a move he prices at over $88,000 per contract (26:22, 26:25, 26:56, 27:04).
The Treasury contracts are the weakest area in the review. He says he will cover bonds in detail in the bond week, then describes the 30-year Treasury bond as making lower lows with underlying weakness and only trading in a consolidation, the 10-year note as weak with a consolidation since, and the 5-year note as weak with further weakness in March. He links the absence of any tradeable move in the debt instruments to the difficulty foreign exchange had in producing sustained moves at that time (27:12, 28:06).
Currencies and metals
The Australian dollar is his first currency leader: the dollar index made its higher high into January while the Australian dollar made a failure swing lower and then showed accumulation at those lows, and he notes that its interest rate differential was a bonus that supported the move (28:49, 29:03, 29:18, 29:26). The Canadian dollar is the failure: essentially an equal low, modest bullishness, then it gave up in February and rolled over with the dollar index (29:39). The Japanese yen shows a higher low against the dollar’s higher high, which he calls an institutional sponsorship rally with short-term highs breaking and bullish order blocks supporting price (30:06, 30:12). The British pound is called lethargic, with no real accumulation until the March period when the pound began rallying from a level he voices as 122, and overall weak (30:43, 31:02).
The Swiss franc repeats the yen pattern — a higher low while the dollar made a higher high, a further intermediate low in March, and then in May what he calls a Turtle Soup long after the dollar closed a fair value gap as a premium array (31:09, 31:15, 31:31, 31:46, 31:52). He names the Australian dollar, the Japanese yen and the Swiss franc as the currency leadership group (32:11), then adds the euro on a higher low with premium arrays breaking and discount arrays supporting price (32:17, 32:19, 32:29), and the New Zealand dollar, where he mentions an interest rate differential that paid a carry for holding the currency and says the kiwi was an upside leader (32:53, 33:01). He refers to rate differentials as a factor without giving the underlying rate data, so the differential claims cannot be checked from the recording.
Gold is described as failing to make a lower low while the dollar index made higher highs, with bullish order blocks supporting price, which he calls a strong commodity to be a buyer of (33:40). Silver started the same way, then fell out of bed around a level he voices as 1850, came back down, traded what he calls a bullish order block at a level he voices as 16, and rallied 168 points, which he prices at almost $7,000 or more per contract. He adds that he had been very bullish on silver, more than gold, but that it failed at the 1850 level and the storyline changed (34:13, 34:27, 34:44, 34:53, 35:03). High-grade copper shows accumulation through September and October and then an explosive move up, which he calls very strong (35:12). Crude oil failed to make lower lows while the dollar rallied, which he reads as accumulation around the $43 a barrel mark, followed by a rally (35:33, 35:36).
How he sums up the review
His own summary of the exercise is that relative strength analysis fanned out the leadership issues when the market should have been seeing commodities trade higher, and he points out that not all of them did trade higher — the point being that the process eliminated markets that were not behaving as expected (35:59, 39:21, 39:49). By group he settles on soybeans out of the grains, calling feeder cattle by far the leader of the livestock even though all three did well, cotton as the fibers outperformer because it sat under accumulation, nothing in the debt instruments, the Australian dollar, yen, franc, euro and kiwi as currency leadership, all three metals doing well with silver the weakest and gold the outperformer in his opinion, and crude oil as the final opportunity in the basket (37:35, 38:00, 38:15, 38:39).
The study sequence he describes
Because the method is a filter rather than a signal, the lesson converts cleanly into a checklist. For study or paper-trading purposes:
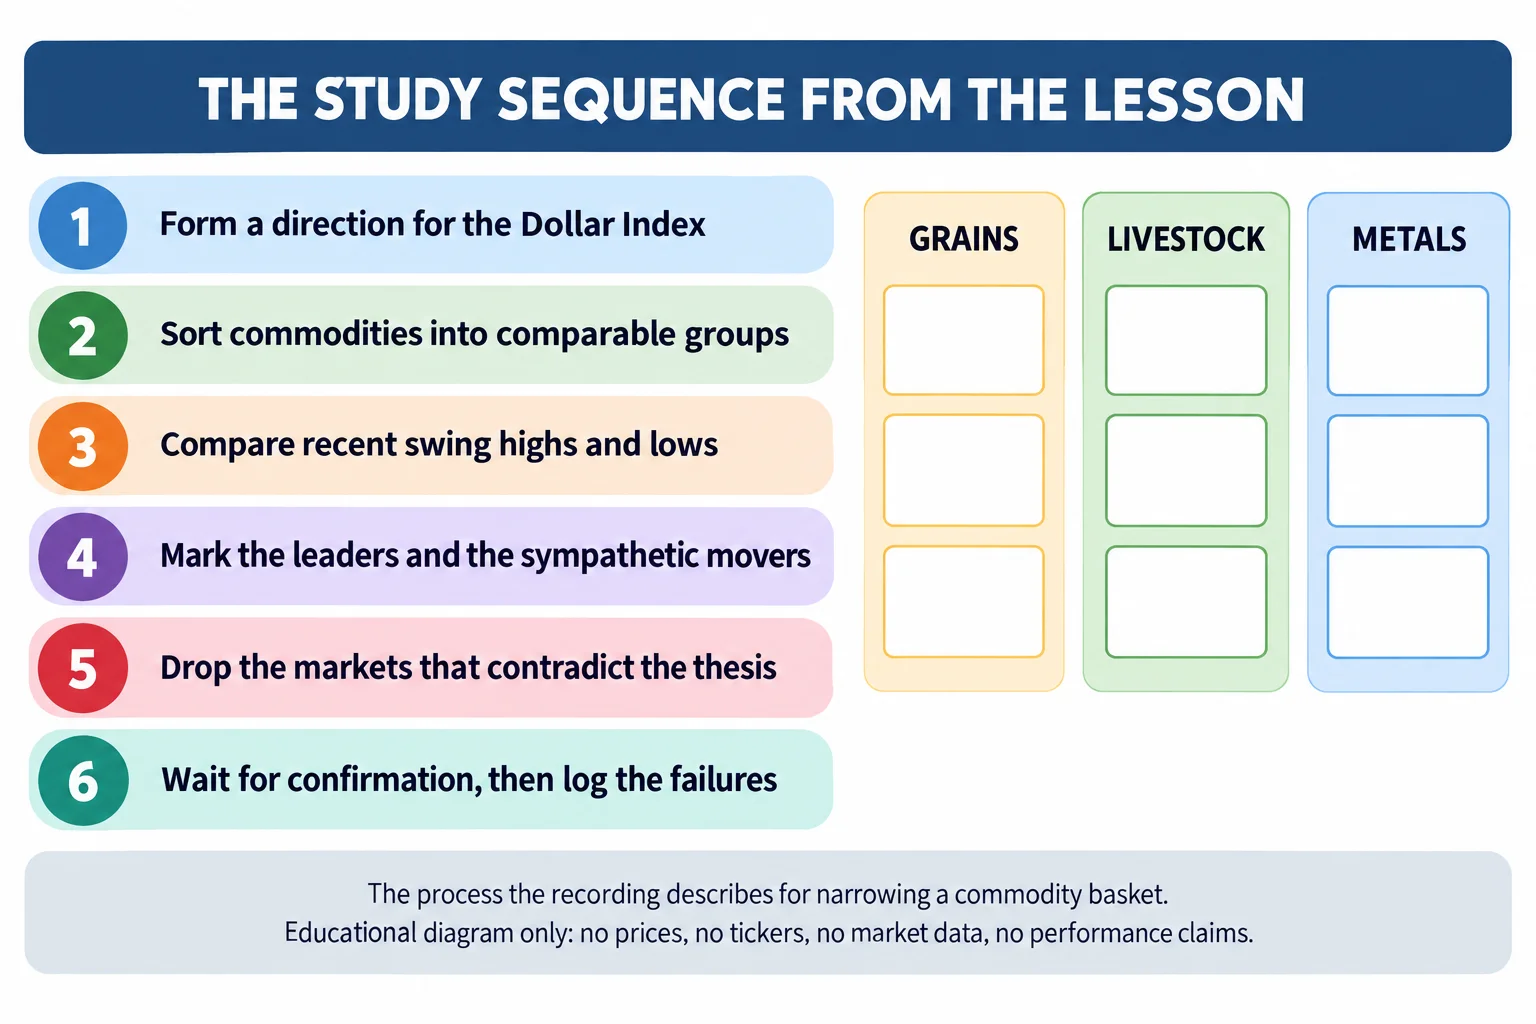
- Decide what the Dollar Index is likely to do, because every other judgement depends on that call and the lesson tests it no further. If the dollar view is wrong, the ranking it produces has no meaning.
- Group contracts that belong together — the grains, the livestock, the fibers, the metals, the commodity currencies — so that the comparison is between comparable markets.
- Compare recent swing highs and lows against the dollar and against the group, and note which contract refuses to confirm.
- Label leaders, sympathetic participants and contradictions, and expect the leader’s moves to be larger and quicker while the sympathetic movers lag.
- Track whether the expected confirmation — broken short-term highs or lows, shallow countertrend moves — actually appears.
- Record the failures as carefully as the successes. Sugar and silver are in the lesson for exactly that reason: each showed the early relative-strength divergence and then did not carry through.
What this lesson does and does not establish
- It does establish a stated method: rank commodities by how they behave relative to the Dollar Index, treat a refusal to make the confirming swing as a signal, separate leaders from sympathetic movers, and prefer the leader.
- It does not establish that the pattern predicts direction. The review is retrospective chart reading, and he says so himself in the sense that he is showing what the pattern looks like rather than measuring it.
- It does not establish that institutions were buying. “Institutional accumulation” is his interpretation of a divergence; no order flow, volume breakdown or position data appears in the recording.
- The dollar figures are his own arithmetic. The $1,500 corn move, $4,500 soybean move, $199,000 feeder cattle move, $5,600 lean hog move, $122,000 live cattle move, $88,000 cotton move and $7,000-plus silver move are all calculated aloud from levels on historical charts. They are not realised results. The recording reports no order tickets, position sizes, account balances or fills, and captions cannot verify that any of those moves was transacted.
- No current relevance is clai