
Key takeaways
ICT’s June 2017 commodity lesson defines a carrying charge market as successively higher deferred contract prices and a premium market as the nearby contract trading above later months, which he interprets as immediate demand against scarce supply and a stronger setting for rapid commercial bull moves.
Read the full summary
ICT’s June 2017 commodity lesson defines a carrying charge market as successively higher deferred contract prices and a premium market as the nearby contract trading above later months, which he interprets as immediate demand against scarce supply and a stronger setting for rapid commercial bull moves. The process compares the nearby with the next month out, checks additional deferred months to see whether the inversion persists, then plots nearby minus deferred, with values above zero showing a premium. In the 2017 cotton example, July minus October produced a spread that rose while outright price made lower lows, which ICT calls bullish spread divergence and institutional buying when combined with a bullish order block, PD array discount, equal-low sell-stop run near 77.80, and an unconfirmed 79.7 retracement. He retrospectively describes buying near 77 and reaching 87, a ten-cent move worth over $5,000 on one cotton contract in under a week, while acknowledging hindsight and his primary experience in forex. A higher price high without a higher spread high is a warning to trail stops or take profits, not initiate a short. ICT distinguishes commodity premium from PD array premium and discount, says parabolic repricing is less likely under carrying charge, and presents the method as applicable across commodities, but the lesson provides no verified fills, account records, tested success rate, treatment of seasonality, liquidity, contract rolls, or independently verified chart data and explicitly limits all commodity discussion to paper trades because he is not a licensed commodity trade advisor.
How we researched this article
BestProps used document-based research from primary firm sources, checked September 24, 2026. The complete source list, scope, limitations, and commercial-state record appear near the end of this article.
ICT frames the lesson as an x-ray view of institutional order flow in commodities (0:30), and identifies it as the June 2017 commodity trading lesson four on premium versus carrying charge markets (0:23). The material below is his interpretation of commodity term structure and what he infers from it, not a verified predictive edge.
He opens with the disclaimer that he is not a commodity trade advisor, is not licensed to give trade advice, and that everything mentioned about commodities is specifically to be viewed as paper trades only (0:09, 0:11 and 0:16).
Understanding ICT Premium and Carrying Charge Markets
He starts from the delivery-month table on the free charting site he uses, which he calls one of the best resources a commodity trader has (0:38 and 0:43). In the list, the cash market is generally shown first if one exists, and immediately below it sits the first contract delivery month, which he calls the nearby contract; the month right after that is the next month out (2:19, 2:30 and 2:36). Those two are the contracts he compares, and he says he looks for a premium across the delivery months periodically, once every two to three weeks (1:06 and 1:49).
He also attaches a caveat to the figures he is reading: he was pulling live prices while recording, so they may not represent closing prices, and he says he is going to assume the market had closed for the purpose of the exercise (2:01 and 2:10).
His soybean illustration is a carrying charge structure. He narrates the nearby month at one price with each later month higher (the next month out up, then a further month up again, then the following January higher still) and calls it a typical carrying charge market with nothing fancy about it (3:20, 3:24, 3:33 and 3:43). His claim about that structure is narrower than it can sound: he says it does not mean bull markets cannot be found under such conditions, only that a parabolic move or rapid aggressive repricing is far less likely than if the market had a premium (3:45 and 3:51).
Feeder cattle is the counter-example. There the nearby month is quoted above the following months, so he classifies it as a premium market even though the difference is not large (4:05, 4:45 and 7:20). He defines the general test plainly: when today’s nearby contract price is higher than the delivery months after it on the calendar, that is a premium market (6:09 and 6:18).
His reasoning for why a premium matters is that it promotes what he calls a commercial bull market: the large dominant users of the commodity want delivery immediately because they have to have it and supply is short, so they are willing to pay a premium now rather than the later carrying-charge price they would otherwise expect (6:22, 6:27 and 6:42). He also states, unusually for his teaching, that supply and demand matter in commodities precisely because they are tangible things, which is why he will discuss them here even though he says he does not trade forex that way (5:45 and 5:48). He gives live cattle as a second premium example, where the nearby month sits above the next month out and the months after it are lower again (7:01, 7:07 and 7:20).
Why Delivery Months Reveal Premium and Carrying Charge Markets
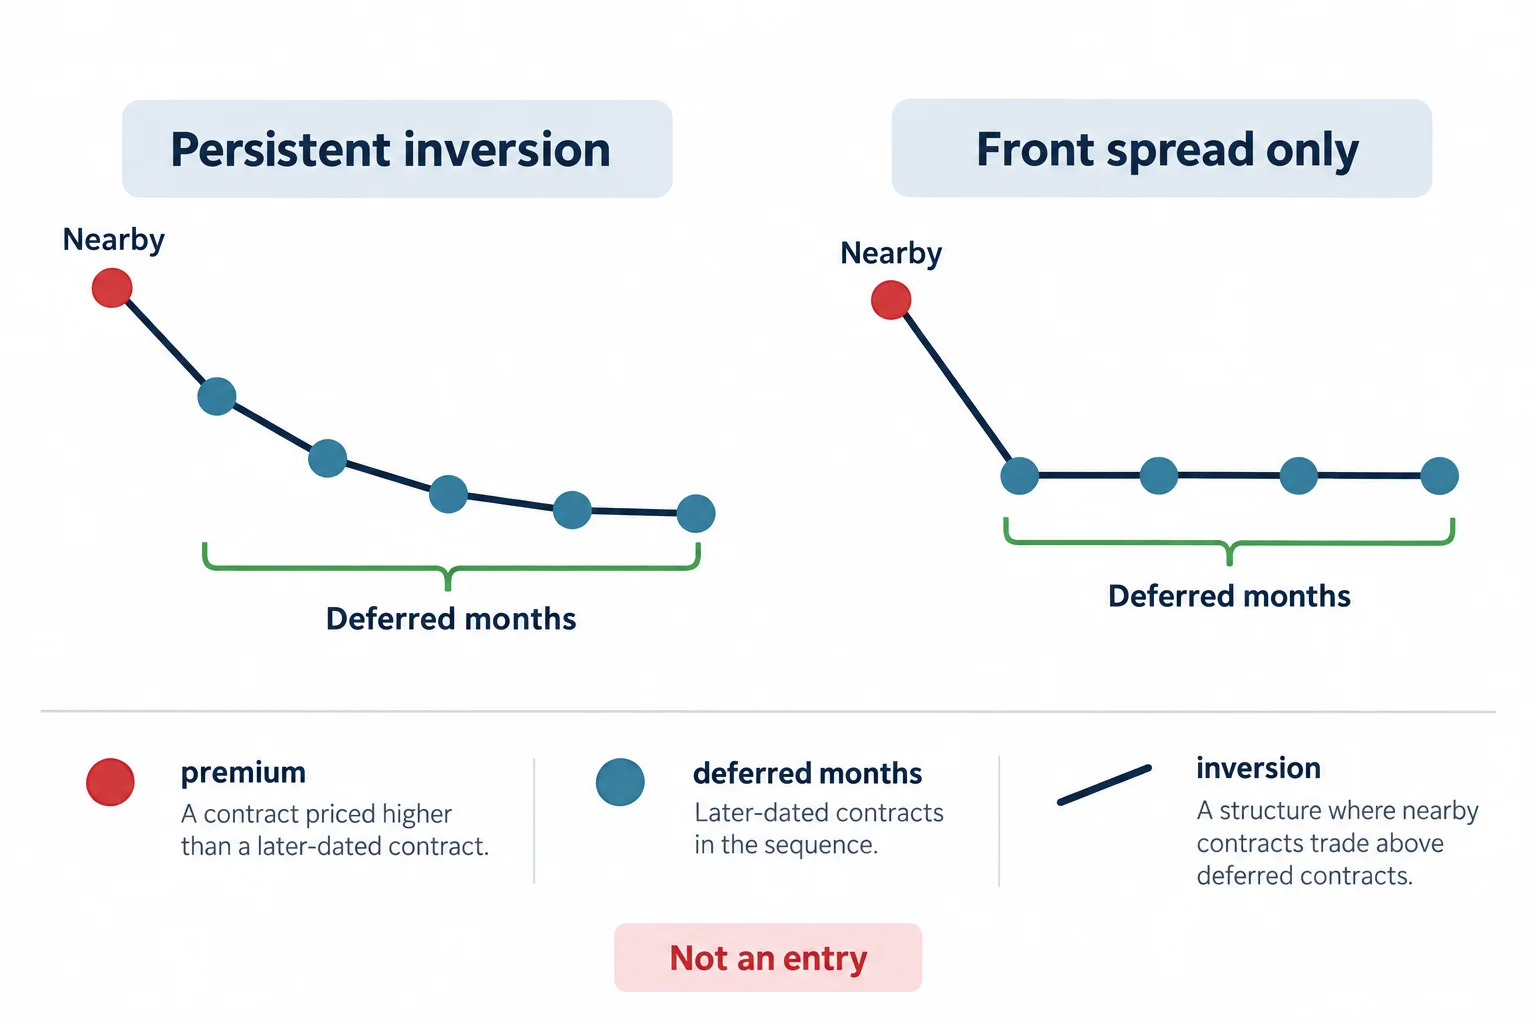
He does not stop at the first pair. To judge whether a premium is strong or significant he says to go out beyond the next month out and look at the next few months, because that shows whether the inversion persists across the curve or is confined to the front spread (4:48 and 4:53). In the feeder cattle example the deferred months step lower one after another, which is what he treats as the clear, obvious premium (5:57 and 6:04).
Read plainly, the comparison is a description of the market’s term structure at one moment. It is not on its own an entry signal, and the lesson does not work through contract specifications, seasonality, liquidity, or the mechanics of the nearby contract rolling forward, all of which complicate month-to-month comparisons of this kind.
ICT Premium and Carrying Charge Market Cotton Example
He then poses the classification question directly against the cotton delivery months: is cotton showing a carrying charge market or a premium market? He refers back to the nearby versus next month out test and concludes there is a premium, which he says makes the conditions ripe for a commercial bull market (7:57, 8:05 and 8:17).
He distinguishes two kinds of bull market to explain why the premium matters to him: one that stair-steps higher gradually, and another that goes parabolic and vertical, moving quickly with speed and magnitude. He says the fast version is usually the signature and hallmark of a premium-based rally, and that commodities with a premium built in tend to move a lot of distance in a short amount of time (8:40, 9:00 and 9:25). That is his characterisation of a tendency, offered without any measurement of how often it holds.
He flags a terminology trap here that matters if you have seen his other material. In a commodity, premium means the specific pricing relationship between the nearby and the next month out, and he says explicitly not to confuse that with premium and discount in his PD array framework, where premium and discount describe where price sits inside a dealing range (9:20, 9:25 and 9:57). The two uses of the same word describe unrelated things in this lesson.
Building an ICT Nearby vs. Deferred Spread
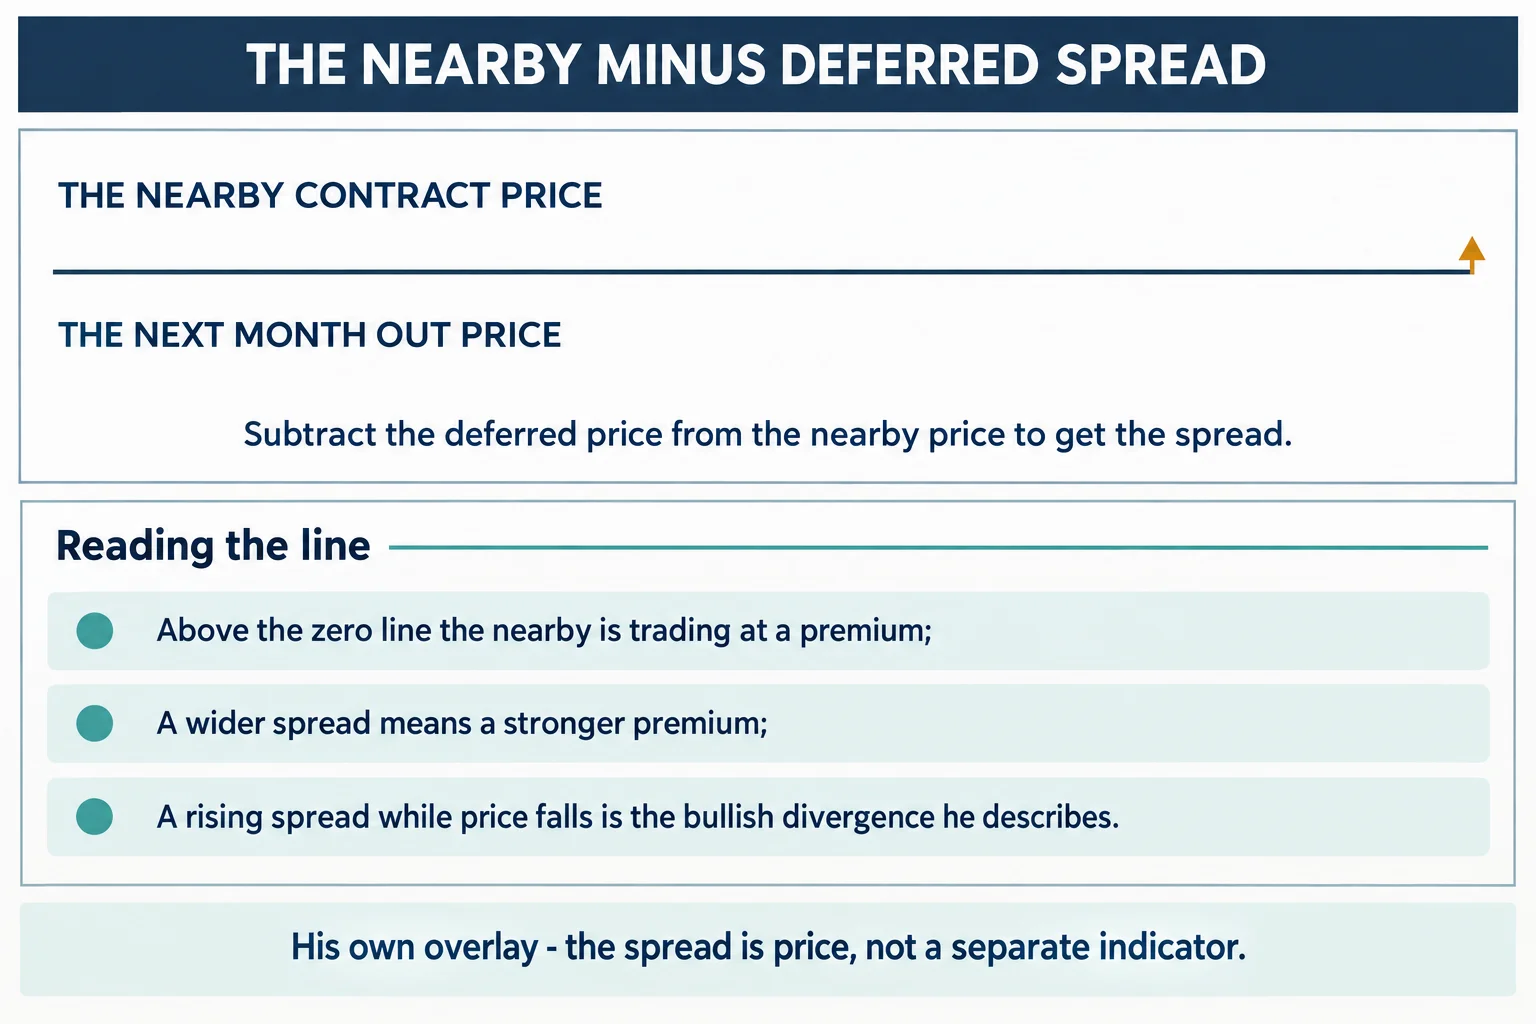
Once the nearby contract is loaded he develops a spread chart, which he defines as the difference plotted between the nearby contract and the next month out (10:24 and 10:30). He walks through the mechanics as he used them for the cotton example: switch the chart type to a spread chart, set the first symbol to the commodity’s nearby delivery month, set the second symbol to the next month out, and make sure the operator is subtraction so the line gives the difference between the two (10:52, 10:58, 11:21 and 11:39). In his example the nearby delivery month is the July contract and the next month out is the October contract, both in the year he was narrating (11:12, 11:17 and 11:29).
Reading the result: the significance of the chart is its zero line, and anything above that line represents the amount of spread by which the nearby contract is trading above the next month out (12:05 and 12:09). His stated reading is that the larger the spread, the stronger the likelihood of a commercial bull market or a parabolic move (12:18 and 12:21). He points to a May spike on his chart where he says the nearby July contract was trading at a 6.50 premium over the October delivery contract, and notes that the spread chart is an overlay he created with his video software specifically so the relationship could be seen graphically. He says the overlay is optional and that the spread is simply price (12:39, 12:41, 12:58 and 14:23).
How ICT Reads Premium and Carrying Charge Spread Divergence
In the cotton example he describes price trading into a bullish order block in the first half of May while making successive lower lows each day, and then points out that the spread line was increasing over the same stretch, diverging bullishly against the falling outright price (13:35, 13:42 and 14:06). He asks rhetorically whether it looks like an indicator and answers that it is one, because it is price. He describes it as an overlay of the nearby-to-next-month spread rather than a computation, and says no such overlay is required to do the study (14:11, 14:16 and 14:23).
He states the rule he is applying: look for bullish divergence between the price action of the nearby contract and the spread, and where the spread is diverging that way he calls it a buy signal (14:29 and 14:41).
He then layers the rest of his framework onto that example. He reads the move as trading down into a previous down-close candle that stalled and moved away, which is his typical bullish order block; notes that it is trading into the April high-to-low range in a discount on the PD array matrix while the cotton market shows a premium with the nearby above the next month out; and says the spread only diverges this way when institutions are stepping in and buying a lot of it, quickly (14:49, 14:59, 15:02, 15:13 and 15:30).
He describes the specific setup as trading below equal lows made in April at around the 77.80 level, running the sell stops, and trading into the bullish order block, which he says would most likely also be an optimal trade entry around the 79.7 retracement level, though he notes he did not draw a Fibonacci to confirm it (15:58, 16:04, 16:11 and 16:19).
The reported outcome he narrates is a buyer at 77 with a move to 87, ten cents, which he converts to over five thousand dollars on one cotton contract in under a week (16:43, 16:45 and 16:48). Immediately after, he says he has the benefit of hindsight, that he has not been trading commodities for a long time and has been primarily a forex trader, but that these things appear every single year and are the hallmark of what makes commodity trading interesting to him (17:06, 17:08, 17:11 and 17:15). No order record, fill or account statement accompanies that figure, and the example is a retrospective walkthrough on a chart selected because the move happened.
Spotting the Opposite ICT Spread Warning
He says the same logic repeats in reverse when there is a premium in the marketplace. If the market makes a higher high but does so with a lower peak in the spread, that does not significantly confirm institutional buying, and he says to take that with a grain of salt: for a strong premium-driven rally the spread should be increasing as price rallies (17:43, 18:00, 18:08 and 18:12).
What he says to do about a bearish divergence is deliberately limited. He frames it as an indication to look for reasons to trail a stop loss or to take some profits and wait for a new buy signal, not as a signal to initiate a short (18:22, 18:30 and 18:37).
He closes by calling this a smart-money tool that works across all commodities, repeating his view that fundamentals are needed for commodities because they are tangible real things (in his phrase, the world’s grocery store) and saying the method is his way of framing institutional buying and selling and knowing when they are going to be doing explosive moves (18:38, 18:55, 19:00 and 19:11).
Applying ICT Premium and Carrying Charge Market Signals
He does not present the process as a numbered checklist, but the sequence he demonstrates can be written out as one:
- Pull up the commodity’s available contract delivery months and locate the nearby contract and the next month out (0:48 and 2:30).
- Classify the structure: later months higher is a carrying charge, nearby higher than the deferred months is a premium (2:52 and 6:18).
- If there is a premium, look beyond the next month out to see how far the inversion runs (4:48 and 4:53).
- Plot the nearby minus the next month out as a spread and watch it against outright price (10:30 and 12:05).
- Treat a rising spread while price falls as bullish, and a higher high in price with no higher high in the spread as a warning to manage the position rather than add (14:41 and 18:22).
Limits of ICT Premium and Carrying Charge Market Claims
- This article is based on the automatic YouTube caption transcript. The reviewer did not independently verify the chart geometry, the drawn levels or the spread line shown in the recording, and a caption file cannot confirm what any chart displayed.
- The reported outcome (a buyer at 77 with a ten-cent move to 87 worth over five thousand dollars on one contract in under a week) is the speaker’s narrated, hindsight-selected illustration. No fill, order record, statement or account appears in the lesson, and the price figures come from the caption text of a retrospective walkthrough.
- The claim that a diverging spread is only shown when institutions step in and buy is stated as his inference from the chart. The transcript cannot establish who was buying or that institutions caused the spread behaviour.
- The claims that a parabolic repricing is less likely in a carrying charge market, and that commodities with a premium tend to move far in a short time, are offered as tendencies from his observation. The lesson supplies no measurement of how often either holds.
- The lesson gives no tested success rate and no risk parameters. It also does not address contract specifications, seasonality, liquidity or how rolling the nearby contract affects the comparison.
- The prices narrated in the soybean, feeder cattle and live cattle examples were being read live while recording; he says they may not represent closing prices and asks the viewer to assume the market had closed for the exercise.
- The automatic captions misrender some terms in this lesson, including “barchart.com” as “bar charts” in places, “bullish order block” as “bull shorter block”, and “PD array” as “PDA Ray”. Those renderings are flagged rather than silently corrected.
Watch the ICT Premium and Carrying Charge Market Lesson
ICT Mentorship Core Content – Month 10 – Premium Vs. Carrying Charge Market
The Inner Circle Trader · published 17 October 2022 · about 19 minutes 23 seconds. This is the primary source for this article; every timestamp link above points into it.
The video is not embedded here because the owner has disabled playback on other websites. That was checked directly on 15 September 2026 from a BestProps page origin: the embedded player loads and returns “Playback on other websites has been disabled by the video owner” instead of playing, so no empty player is left on this page.
The watch page was read on 15 September 2026 and rendered as a public, listed video: ICT Mentorship Core Content – Month 10 – Premium Vs. Carrying Charge Market by The Inner Circle Trader, upload date 17 October 2022, listed duration 1,163 seconds, about 76,821 views, playback on other sites disabled by the owner. The scheduling inventory lists the same upload under 17 October 2022, so the two agree. The caption file covers about 1,164.6 seconds, which matches the listed duration within roughly two seconds.
ICT Premium and Carrying Charge Market Resources
These are the sources checked for this article. The regulator and exchange pages are general material about commodity futures and about systems and advisory services promoted to the public; neither assesses the speaker, verifies any price, spread or reading above, nor endorses anything said in the recording. Any ICT, smart-money or third-party indicator, script, note set, transcript pack, chart annotation or re-upload circulating outside the publishing channel’s own page is unofficial and untested here.
- [1] ICT Mentorship Core Content – Month 10 – Premium Vs. Carrying Charge Market The Inner Circle Trader (primary source; watch page read 15 September 2026, 1,163 seconds).
- [2] The Inner Circle Trader (official YouTube channel) (read 15 September 2026).
- [3] CFTC: Fraud Advisory: Commodity Trading Systems Sold on the Internet (read 15 September 2026), the regulator’s guidance on evaluating trading systems and advisory services promoted to the public, which is relevant to how a historical example and a reported dollar outcome should be weighed. It does not assess this speaker or this method.
- [4] Investor.gov (SEC): Investment Products (read 15 September 2026), general investor education covering products and their risks, with companion material on avoiding investment fraud.
Source: ICT, ICT Mentorship Core Content – Month 10 – Premium Vs. Carrying Charge Market, The Inner Circle Trader, 17 October 2022. Automatic YouTube captions were the transcript used for this article. This commentary is educational and is not investment or commodity trading advice.