
Key takeaways
In ICT Mentorship Core Content – Month 10 – Open Interest Secrets & Smart Money Footprints ICT opens by saying he is not a commodity trade advisor, is not licensed to give trade advice, and that the commodity material is to be viewed as paper trading only.
Read the full summary
In ICT Mentorship Core Content – Month 10 – Open Interest Secrets & Smart Money Footprints ICT opens by saying he is not a commodity trade advisor, is not licensed to give trade advice, and that the commodity material is to be viewed as paper trading only. He credits the open interest ideas to Larry Williams with his own twists, and defines open interest as the total outstanding contracts held at the end of each trading day — counting one side only, because a buyer and a seller together make one contract (2:50). He gives two uses for it: measuring the strength of a trend and tracking the footprints of the large commercial traders. In trends he reads rising price with rising open interest as bullish and rising price with falling open interest as bearish (3:44 and 4:26); in consolidation he reads rising open interest as bearish and falling open interest at support as bullish (5:30 and 7:16). Location is what makes either reading meaningful, and his preference is to compare the actual open interest line with a multi-year seasonal average rather than watching the line rise or fall alone (12:03). He then walks a 2010 British pound example he calls extremely bullish with a narrated 800-point rally, and a euro example with a narrated 1,500-pip move (15:40 and 18:05). He states the ideas are not day trades but swing and position material (18:27), and that the method does not give a signal every day or week — a couple of times a year is his own characterisation (20:14). The lesson supplies no fills, account records, or tested success rate, and the two case studies are retrospective charts chosen because the moves happened.
How we researched this article
BestProps used document-based research from primary firm sources, checked September 24, 2026. The complete source list, scope, limitations, and commercial-state record appear near the end of this article.
ICT identifies the lesson as the June 2017 commodity trading lesson five, subtitled open interest and smart money footprints, or in his words the real secrets to using open interest (0:33, 0:36 and 0:40). It is the last commodity discussion of that month’s content, with a return to commodities in August for the top-down analysis templates (0:00 and 0:06).
He reiterates at the outset that he is not a commodity trade advisor, is not licensed to give trade advice, and that everything discussed about commodities is in the capacity of paper trading only (0:19, 0:20 and 0:24).
What ICT open interest measures
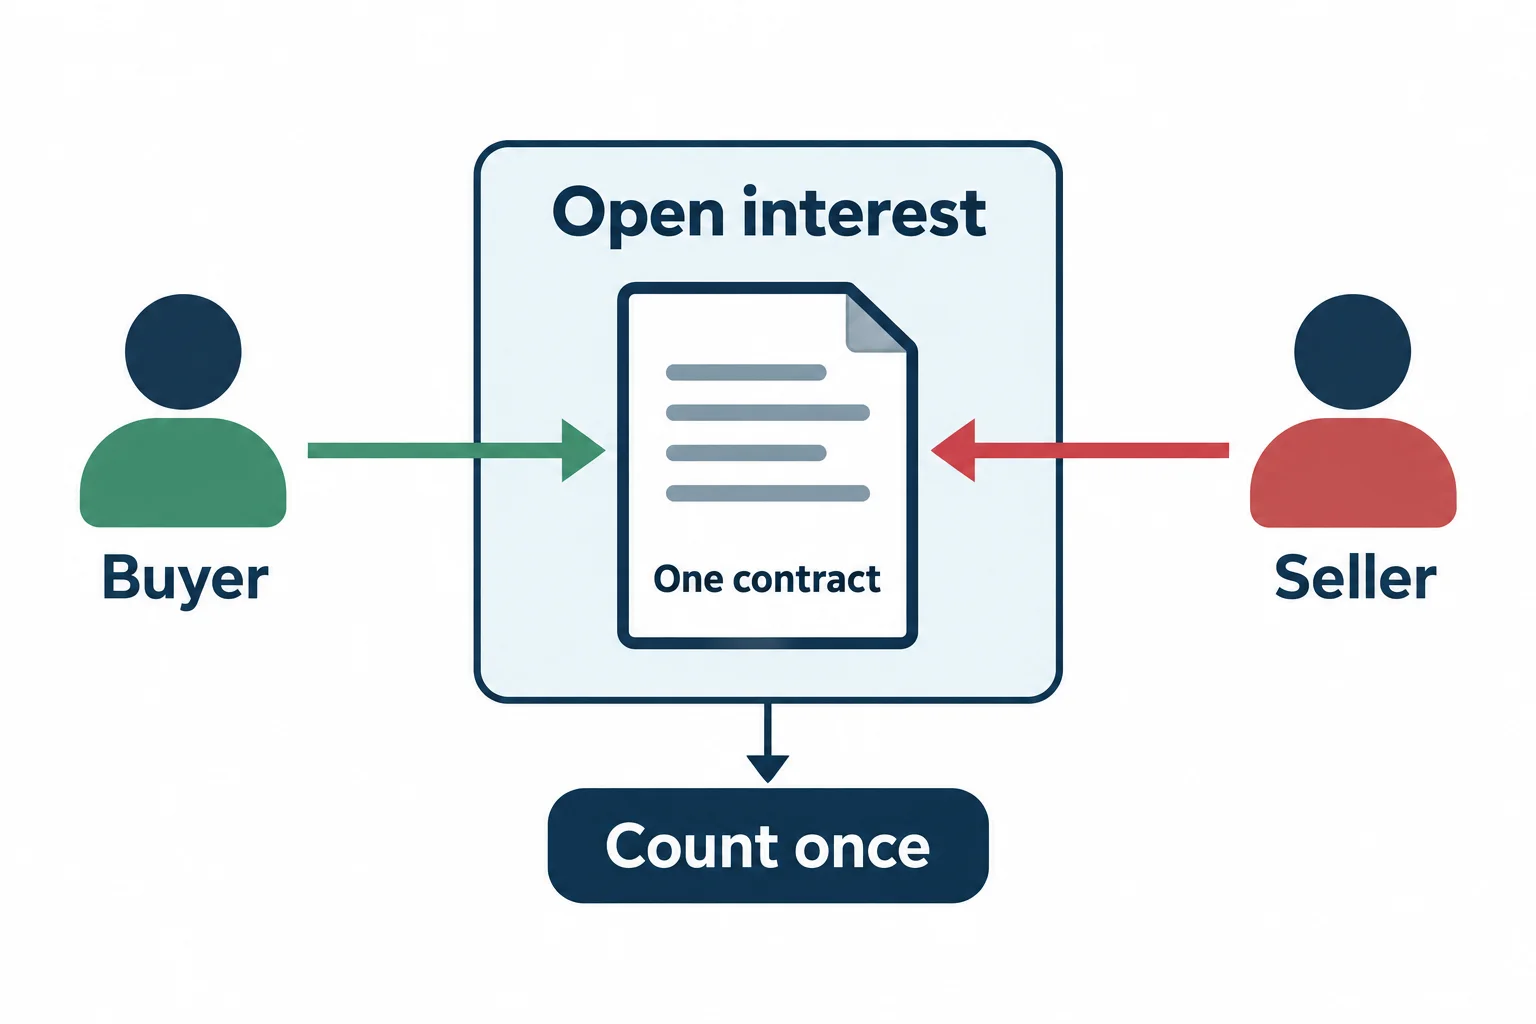
Before the concepts, he defines the data. Open interest, as he puts it in the lesson, is the total number of outstanding contracts held by market participants at the end of each trading day (2:30 and 2:32). He distinguishes it from volume directly: where volume measures the pressure or intensity behind a price trend, open interest measures the flow of money into a futures market (2:36 and 2:40).
The counting rule he stresses is that every seller of a futures contract must have a buyer, so a buyer and a seller combine to create only one contract. Total open interest is therefore read from one side or the other — buyers or sellers — and never from the sum of both (2:46, 2:50 and 2:55).
He credits the approach openly: he says he was mentored first through Ken Roberts’ commodity course, then purchased Larry Williams’ material and built on it, and that what he teaches here is pretty much what he learned from Williams with a couple of twists of his own picked up along the way (1:37, 2:02 and 2:06).
He frames the commodity markets as having a built-in advantage through open interest data, and gives two ways to use it as a trading tool: measuring the strength of a trend or price move, and tracking the footprints of the large commercial traders (3:07, 3:24 and 3:28).
Reading ICT open interest during trends
His four directional readings in trends and swings are stated as pairs of price direction and open interest direction (3:40):
- Uptrend with rising open interest — bullish. His reasoning is that shorts are being stopped out but new sellers are taking their place, so as the market rises the longs get stronger and the shorts get weaker (3:44 and 3:51). Put another way, if open interest increases in a major trend the trend has the sponsorship to continue (4:16).
- Downtrend with rising open interest — bearish. He describes weak longs being stopped out and replaced by new buyers, so the shorts strengthen and the longs weaken as price falls (4:02 and 4:07).
- Uptrend with falling open interest — bearish. Here he says the old longs — the smart money in his framing — are banking gains as they liquidate, replaced by new buyers with less strength on balance, while weak shorts also exit (4:26, 4:30 and 4:41).
- Downtrend with falling open interest — bullish. The shorts are covering and liquidating profitable positions, the squeezed longs are bailing, and he concludes that when the supply of losers is exhausted the downtrend ends (4:53, 4:58 and 5:17).
These are his stated interpretations of aggregate data rather than mechanical rules. The same net change in open interest can arise from different combinations of opening and closing activity on both sides, so the reading cannot by itself identify any individual participant’s position or intent.
ICT open interest during consolidation
He then applies the same data to trading ranges, and here the sign flips relative to a trend. Rising open interest while price consolidates is bearish in his framework, and his reason is a supply argument: the street money plays the long side, so rising open interest in a range suggests the commercial hedgers and professionals are taking the short side and the uninformed speculators risk being caught by a downside break (5:30, 5:32 and 5:39).
He reasons that if the commercial hedgers are the largest liquidity provider, offering the commodity for purchase, then being willing to sell a lot of it means they do not believe price is going higher — otherwise they would hold out and wait for higher prices. On that basis rising open interest becomes a measure of their willingness to be a heavy seller, and a high reading means they have a high interest in seeing lower prices (5:49, 5:59, 6:03 and 6:16). He says that when price stays in a range while the cumulative line increases, price will generally break down, and he wants that coupled with hedging data — specifically the commercials net short or increasing their short selling (6:32, 7:01 and 7:09).
The opposite case: consolidation with falling open interest is a bullish sign, because the commercial hedgers who are most likely short are covering while the street money shorts in expectation of a downside break (7:16, 7:18 and 7:22).
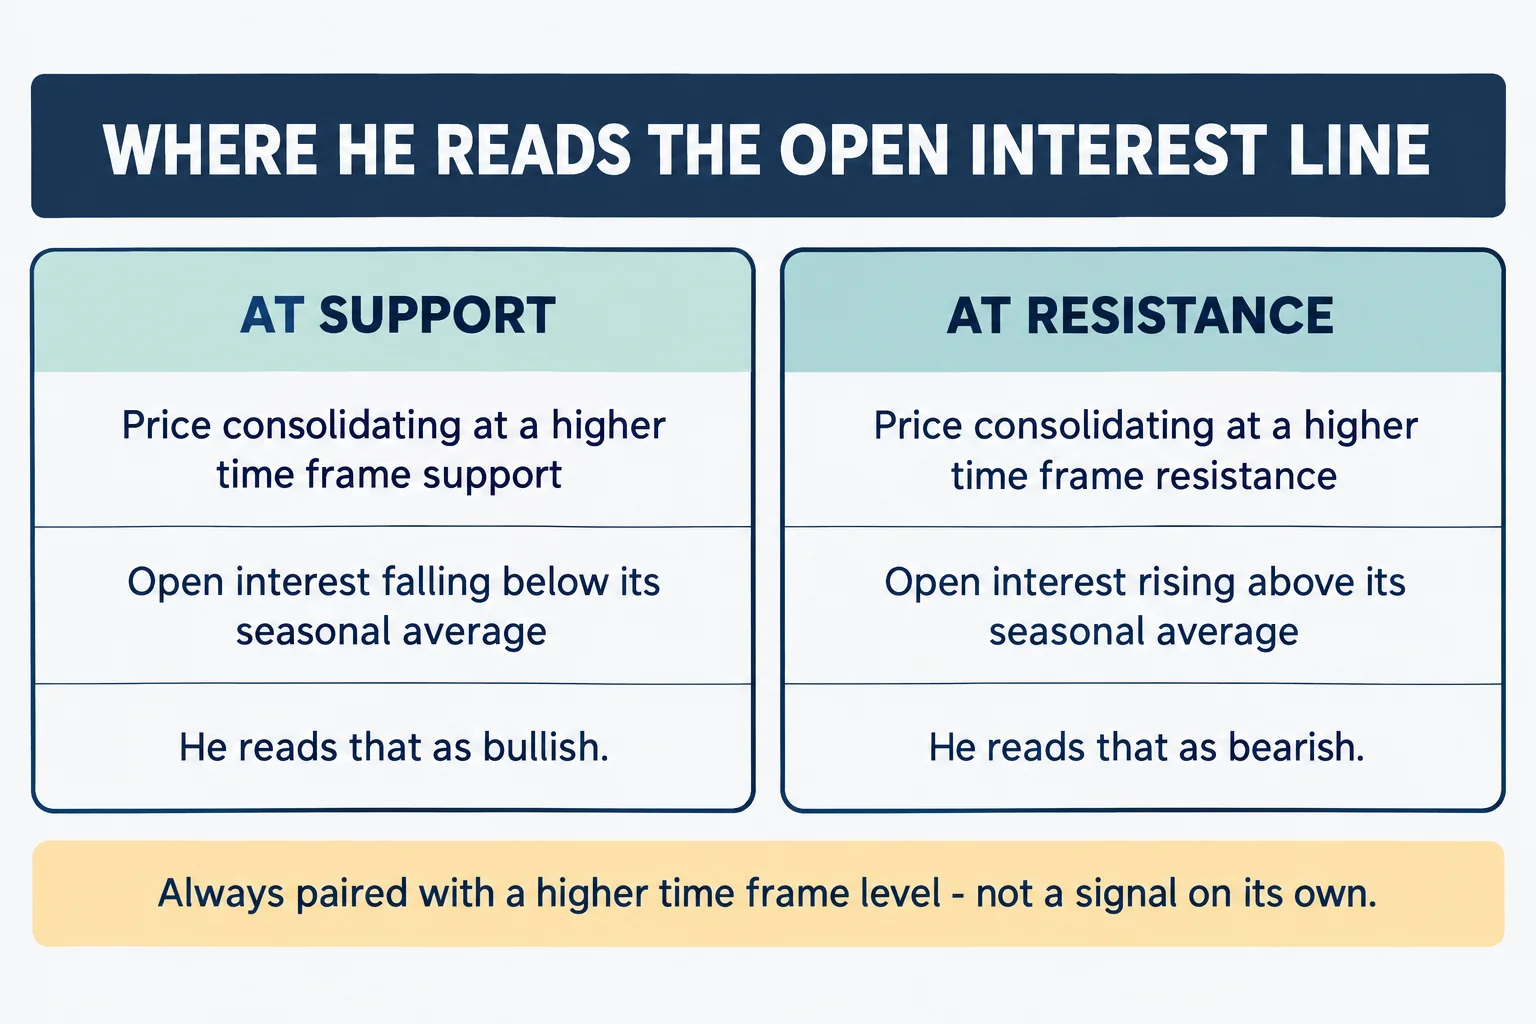
Location is what makes either reading meaningful, and he states the rule in terms of the higher time frames. At a higher-time-frame support level — what he also calls a discount array — he wants to see open interest decline while price consolidates, which he treats as bullish and expects to anticipate an upswing. At higher-time-frame resistance, or a premium array, he wants to see open interest rise while price consolidates, which he treats as bearish (7:46, 8:00, 8:13 and 8:25).
The general lesson a reader can take from this section is that the same statistic means different things depending on where price is sitting. A falling open interest line is not automatically bullish and a rising line is not automatically bearish in his framework; he establishes the higher-time-frame premise first and then uses the data as supporting evidence.
Comparing actual and seasonal open interest
He reads the data on a charting site, and says that on that site using total open interest and volume gives a cumulative line that reflects the true picture, to be compared against price action (8:40, 8:45 and 8:47). But he says that is not enough for a better picture, and he names two subscription services he uses because they plot the seasonal average of open interest for you — he says he still subscribes to them for his forex analysis even though he does not actively trade commodities (9:05, 9:08 and 9:17).
The seasonal average he describes is the multi-year behaviour of open interest plotted as a dotted line, and he notes that it typically shows activity around the June, September and December periods, which he identifies as generally the contract expiration and rollover periods (9:45, 9:52 and 10:04).
He anticipates the obvious objection and answers it directly: rollover and expiration are generally built into the series, so they are not indicative of the entire answer (10:15 and 10:20). His reasoning is mechanical: traders who remain bullish or bearish do not stop trading because a contract expires, they buy or sell to cover in the nearby contract and roll into the next month out, so the position is replaced one for one and open interest is still reflected (11:15, 11:18 and 11:28).
What he actually compares is the difference between the actual open interest number, drawn as a solid line, and the seasonal average, drawn as the dotted line, in order to get a better feel for the intensity of what the commercials are doing as a whole (12:03, 12:05 and 12:08). His reading rules follow from that:
- If the actual line is running above the multi-year average while price sits at a resistance level, he says he could expect really nice increases in open interest at that resistance, which he calls bearish (12:25, 12:37 and 12:51).
- If the actual line drops below the dotted average, he reads that as the commercials really covering shorts and sitting well below their average open interest movement. Where that happens in a bullish environment — a long-term support level or discount array with price in consolidation — he calls the condition extremely bullish and says he would expect price to go higher (13:00, 13:07, 13:20 and 13:26).
Open interest footprints in pound and euro markets
He begins the case studies with the British pound on a monthly chart, looking back at the 2010 period and identifying a bullish order block outlined from 2009 trading and another from early 2010 (13:33, 13:37, 13:46 and 13:50). He says price had respected the mid-2010 bullish order block after rallying from the 2009 block, then traded back down into the second block and found support, which is the level he examines further (14:13, 14:17 and 14:21).
On the weekly chart for September 2010 he notes the commercials were net long, and points to a low that is also trading back into an old bullish breaker from the first quarter of 2010 (14:28, 14:33 and 14:41). He then moves to an older chart, highlights what he calls the 153 level as the higher-time-frame support, and describes zoning into the consolidation period where open interest takes a dive below the dotted seasonal line — a condition he calls extremely bullish (14:57, 15:04 and 15:17).
His summary of that footprint is explicit: open interest dropping at a support level while price consolidates and the net positioning shows the commercials bullish is, in his words, a wonderful condition to be in when expecting higher prices, and it shows the smart money covering shorts because they cannot hide what they are doing (15:22, 15:26, 15:31 and 15:36). He reports that price then moved over 800 points in the pound, or 800 pips in the forex market, in a short span of less than two months (15:40, 15:44 and 15:46).
The euro example follows on the weekly chart, where he points to the commercials above the zero line and an extreme bullish reading just before the low in the early part of 2010, then price rallying off that low and retracing down to what he identifies as a bullish order block formed by the last two down weekly candles, coinciding with the bullish net position (15:55, 16:05, 16:25 and 16:34). He describes price trading back down into that block as a discount array while the commercials are net long (16:46 and 16:52).
On the daily chart he outlines a small consolidation and the 126 higher-time-frame support level, then shows open interest dropping below its seasonal average — and he emphasises that the size of the drop relative to the average is the point, not merely that the line declined, because the actual decline is totally different and tells a different story (16:54, 17:00, 17:09 and 17:18). He reports price moving 1,500 pips or points for that commodity, vaulting from the 126–127 level into the 142s in less than two months, and notes it did not spend long dilly-dallying (17:58, 18:05, 18:10 and 18:13).
How ICT uses open interest to track smart money
He is explicit about the intended timeframe. He says the examples are not one-off lucky cases because the idea works on the higher timeframe basis, and that these open interest ideas are not day trades — they are selected for swing trading, position trading, or for getting your trading in sync with a larger move (18:18, 18:23 and 18:27).
His illustration of how that scales down is conditional: if the scenario is recognisable in the first week of October, the price move has more significance behind it as a large macro play with a dominant support structure, so you could go back to the weekly chart to see where price may reach for a premium array, and while that premium array is unfulfilled look for day trades where the open is near the low of the day, or for one-shot expansion plays on the weekly range for a higher Friday close from the week’s opening (18:38, 18:46, 19:00 and 19:08). Note that he is describing where he would look for entries once a higher-time-frame premise exists, not presenting day trading as the purpose of the open interest reading itself.
His closing synthesis is that he does not use open interest as a simple is-it-falling-or-rallying question. He couples it with a higher-time-frame level, because the hedgers and commercials have a more closely tied relationship to what price should be doing fundamentally and also work from higher-time-frame charts for valuation. His stated method is to find support and resistance on those higher time frames with his PD array matrix, couple that with the hedging programmes and net positioning, and then read open interest declining at supports or discount arrays or increasing at resistance or premium arrays (19:17, 19:23, 19:36 and 19:49).
He qualifies the payoff himself: it does not answer everything and does not give a signal every day or every week, and in his words you can look for these moves a couple of times a year (20:12, 20:14, 20:16 and 20:18).
What the lesson does not establish
- This article is based on the automatic YouTube caption transcript. The reviewer did not independently verify the chart levels, the open interest line, the seasonal comparison or the positioning readings shown in the recording, and a caption file cannot confirm what any chart displayed.
- The reported outcomes — over 800 points in the pound and 1,500 pips in the euro, in less than two months each — are the speaker’s narrated, retrospective illustrations on charts selected because the moves happened. No fill, order record, statement or account appears in the lesson, and the figures come from caption text.
- The inference that commercial hedgers are the party on the other side of rising open interest is his supply argument, not something the aggregate data establishes. Open interest counts contracts, not participants, and the transcript cannot show who was buying or selling at any level.
- The framework is presented as discretionary throughout: he requires a separately determined higher-time-frame bias before the open interest reading means anything, and the lesson gives no objective test for establishing that bias.
- No risk parameters, position sizing rules or invalidations are given, and there is no tested success rate for any of the four trend readings, the two consolidation readings, or the seasonal comparison.
- He cites Larry Williams’ open interest concepts as the basis and describes the material as that work with his own additions. That attribution is reported as he states it and is not independently verified here.
- The automatic captions misrender several terms in this lesson, including “open interest” as “urban interest” at the definition, “squeezed longs” as “squeezed blogs”, “commercials are bullish” as “commercials are polish”, and “barchart.com” as “barchar.com”. The two data services he names are rendered in the captions in forms that should be checked against the audio before being relied on. These renderings are flagged rather than silently corrected.
Watch the original recording
ICT Mentorship Core Content – Month 10 – Open Interest Secrets & Smart Money Footprints
The Inner Circle Trader · published 16 October 2022 · about 20 minutes 34 seconds. This is the primary source for this article; every timestamp link above points into it.
The video is not embedded here because the owner has disabled playback on other websites. That was checked directly on 15 September 2026 from a BestProps page origin: the embedded player loads and returns “Playback on other websites has been disabled by the video owner” instead of playing, so no empty player is left on this page.
The watch page was read on 15 September 2026 and rendered as a public, listed video: ICT Mentorship Core Content – Month 10 – Open Interest Secrets & Smart Money Footprints by The Inner Circle Trader, upload date 16 October 2022, listed duration 1,234 seconds, about 98,650 views, playback on other sites disabled by the owner. The scheduling inventory lists the same upload under 16 October 2022, so the two agree. The caption file covers about 1,234.8 seconds, which matches the listed duration.
Resources
These are the sources checked for this article. The regulator, investor-education and exchange pages are general material about positioning reports, futures products and systems promoted to the public; none assesses the speaker, verifies any level, reading or outcome above, nor endorses anything said in the recording. Any ICT, smart-money or third-party indicator, script, note set, transcript pack, chart annotation or re-upload circulating outside the publishing channel’s own page is unofficial and untested here.
- [1] ICT Mentorship Core Content – Month 10 – Open Interest Secrets & Smart Money Footprints — The Inner Circle Tra