
Key takeaways
In ICT Mentorship Core Content – Month 10 – Index Futures – AM Trend ICT sets out how he studies the New York morning swing in equity index futures, opening with the reminder that the material is a paper-trade idea only.
Read the full summary
In ICT Mentorship Core Content – Month 10 – Index Futures – AM Trend ICT sets out how he studies the New York morning swing in equity index futures, opening with the reminder that the material is a paper-trade idea only. He defines the New York AM session as 9:30 a.m. to noon New York time and says the day’s notable high or low tends to form between 9:30 and 10:30 (0:52 and 0:58), with the swing either continuing the overnight direction or reversing from the open (1:23). The lesson’s charts are on Central Time, so 8:30–11:00 a.m. Central corresponds to 9:30 a.m.–noon New York (1:53 and 2:18). He marks the London session first, then reads the New York open against order blocks, previous down-close candles and fair value gaps (3:05). The second half introduces index SMT: between 5:00 and 9:30 a.m. New York he compares relative lows under a bullish premise or relative highs under a bearish one across the Nasdaq, Dow and S&P e-mini futures, and treats an index that fails to confirm as a crack in correlation (7:53 and 8:05). In the featured example the Nasdaq makes a lower low into the open while the Dow and S&P make higher lows (8:43 and 9:12). He describes two entry styles — buying strength above an old high or the high of a down-close candle, or buying the index that runs an old low while the other two hold (15:20) — and warns that divergence does not imply a large or low-risk opportunity (17:20). The lesson contains no fills, risk parameters, results or account records, and every tendency above is a claim to be studied on a large sample rather than a tested rule.
How we researched this article
BestProps used document-based research from primary firm sources, checked September 24, 2026. The complete source list, scope, limitations, and commercial-state record appear near the end of this article.
ICT presents this as a study framework for the morning price swing in equity index futures. It covers the New York morning session, its relationship to the overnight London session, and how he compares the Nasdaq, Dow and S&P 500 e-mini futures against each other before and around the equities open.
He introduces the lesson as a reminder that what follows is a paper-trade idea only, and the recording opens by identifying itself as a June 2017 index trading lesson on the AM trend (0:20), while the upload itself is titled as Month 10 core content. The concepts below are therefore ICT’s interpretation of market behaviour as he narrates it, not a verified edge or a promise that the pattern repeats.
Understanding the ICT index futures AM trend
He begins by tying the morning move to the overnight session: when he refers to the AM trend he says the traditional overnight session — what he calls the London session — is always in the foreground (0:37). The New York AM session is then defined as 9:30 a.m. to noon New York time (0:52), with the true day high or low tending to form between 9:30 and 10:30 a.m. New York time (0:58).
- Session window: 9:30 a.m. to noon New York time (0:52).
- Opening focus: a daily high or low will tend to form between 9:30 and 10:30 a.m. (0:58).
- What forms in the window: between the 9:30 open and noon there is typically a trend or price swing daily — the AM trend, or morning swing (1:08 and 1:16).
- Direction: the swing can continue the overnight direction or reverse outright from the 9:30 open (1:23).
- Potential end: the AM trend can end between 10:30 and 11:00 a.m., though he anticipates continuation up to noon for the New York lunch hour (1:41 and 1:48).
These are described as tendencies, not fixed rules. He tells the viewer to study many days of intraday price action to learn how consistent the morning price swing actually is (1:33), which places the burden of establishing the pattern on the student’s own sample rather than on the lesson.
Align session timing for the ICT AM trend
The charts in the lesson are on Central Time, which he notes is one hour behind the New York data, so what looks like 8:30 a.m. to 11:00 a.m. on the chart is 9:30 a.m. to noon New York time (1:53 and 2:18). He is explicit that the AM trend begins at 9:30 a.m. New York — 8:30 a.m. Central as drawn — and ends at noon New York, or 11:00 a.m. Central as drawn.
The practical point is to establish the platform’s time zone before studying session behaviour. The conversion he gives is internally consistent, but it is specific to the charts he is narrating; another platform’s default time zone will shift every window described here.
How overnight sessions shape the ICT AM trend
Across a run of examples he works the same way: mark the London session first, then look at what New York does when it opens. He tells the viewer to go back as far as possible on the charting site he uses and to repeat the exercise across the indices — the Nasdaq, the Dow and the S&P, and also the DAX and FTSE if other indices are of interest (3:05 and 3:26).
Within those examples he points to the New York session trading up into a bearish order block that delivers the price swing for the AM trend (2:48 and 2:51), price trading down into a previous down-close candle he labels a bullish order block and expanding higher off it (3:48), with the highs forming at 10:30 a.m. New York time (4:09), and price dropping into the range that was created during the London session and filling a fair value gap (4:29 and 4:34).
One detail he stresses is the difference between a wick and a body in that gap. In the example he points out two wicks where he would prefer to see bodies cross the level before he treats it as efficiently traded (4:37). That is his reading convention, offered as a refinement of how he judges whether a reference level was genuinely delivered into.
He then narrates what he says the captions render as moves from roughly 2394.50 up to 2399.50 in one index example (5:04) and from the 23.52 handle up to a 2367 “big figure” in another (5:48 and 5:57). Those levels come from the automatic caption text, not from a chart this article verified, and machine captions routinely mangle price figures; treat them as his narrated illustration rather than as quoted data.
A Dow e-mini example is used as the contrast. He marks the London session and a run down through what he calls level stops, identifies that as a bullish breaker, and says the New York AM expansion can be anticipated from the institutions’ order flow plus the fact that London delivered that breaker, describing two up-close candles in the London session as the catalyst for sellers who then have to reduce that exposure — which he says happens at the 9:30 equities open (6:34, 6:45 and 7:00). He summarises the expansion as a precursor visible from the London session run on the lows. This is his causal story about positioning; the transcript cannot independently establish who was trading or why.
The Nasdaq e-mini example that follows shows price running out a previous low into the New York open, which he labels with the stop-run term discussed below (7:33 and 7:48).
Compare index futures with ICT SMT divergence
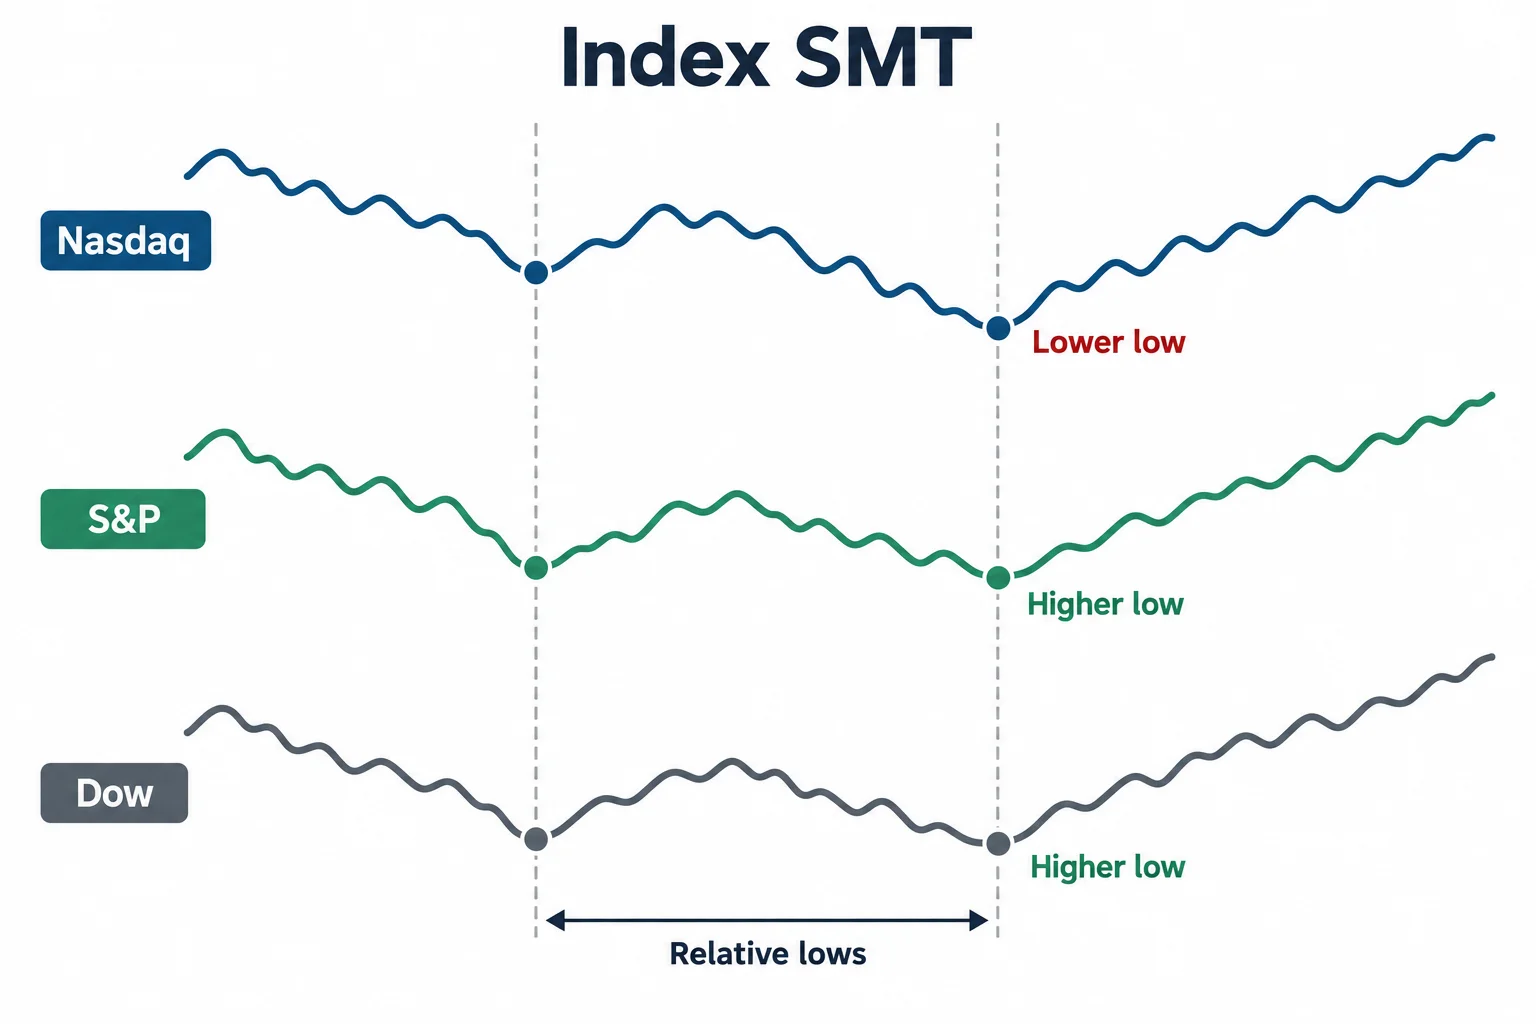
The second half of the lesson moves to what he calls index SMT (7:53). The comparison window is 5:00 a.m. to 9:30 a.m. New York time, and within it he compares relative highs and relative lows across three equity index futures markets (7:57):
- Nasdaq e-mini futures
- Dow e-mini futures
- S&P 500 e-mini futures
When his higher-time-frame premise is bullish, he compares relative lows. The expected reading is that the indices drift lower together while one fails to confirm a lower low, and he treats that failure as the bullish confirmation for trading the AM trend (8:05 and 8:26).
In the featured example he narrates a 15-minute Nasdaq chart that makes a lower low right at the beginning of the New York AM session, a Dow chart that creates a higher low over the same window, and an S&P mini chart that also makes a higher low (8:36, 8:43 and 9:12). He reads that combination as a large accumulation under the Dow and S&P futures while the tech sector rallies off the divergence, and says the index SMT is what confirms that something bullish is going on behind the scenes (9:25 and 9:46).
For a bearish premise he reverses the comparison: with the indices moving up in general tandem, one fails to confirm a higher high, which he treats as the equivalent signal from the other side (10:08). He describes the whole exercise as applying doubt to markets that are otherwise supposed to move in concert, bracketed into a fixed time window (13:13).
Use flexible session timing inside the window
The highs and lows do not have to sit exactly on 5:00 and 9:30. He gives the example of a low printing around 7:00 a.m. New York compared with behaviour at 9:30, and says the span should be treated as a scouting window rather than as bookends or goal posts (10:42 and 11:01). He compares the four-and-a-half-hour span to a killzone, a window in which he keeps scouting relative highs and lows (11:24 and 11:30).
The directional premise comes first in his description of the process. He has the analyst read the higher-time-frame daily bias from institutional order flow, drop to a four-hour and one-hour basis for the arrays used elsewhere in his teaching, and then use the cross-index divergence as the supporting evidence rather than as the trigger (11:35, 11:39 and 11:44). The lesson offers no objective test for establishing that order-flow premise, so this step remains discretionary.
He also explains why the window starts at 5:00 a.m. rather than midnight: London traders take lunch then and return at an unpredictable time — 5:30 or 6:00 a.m. New York in his example — so he starts watching for the build-up of orders from UK and European traders who still have time left in their trading day and want exposure to the North American index futures (13:51, 13:53, 13:58 and 14:07). That is his session rationale, offered as background to the choice of window rather than as a measured finding.
ICT index futures AM trend entry ideas
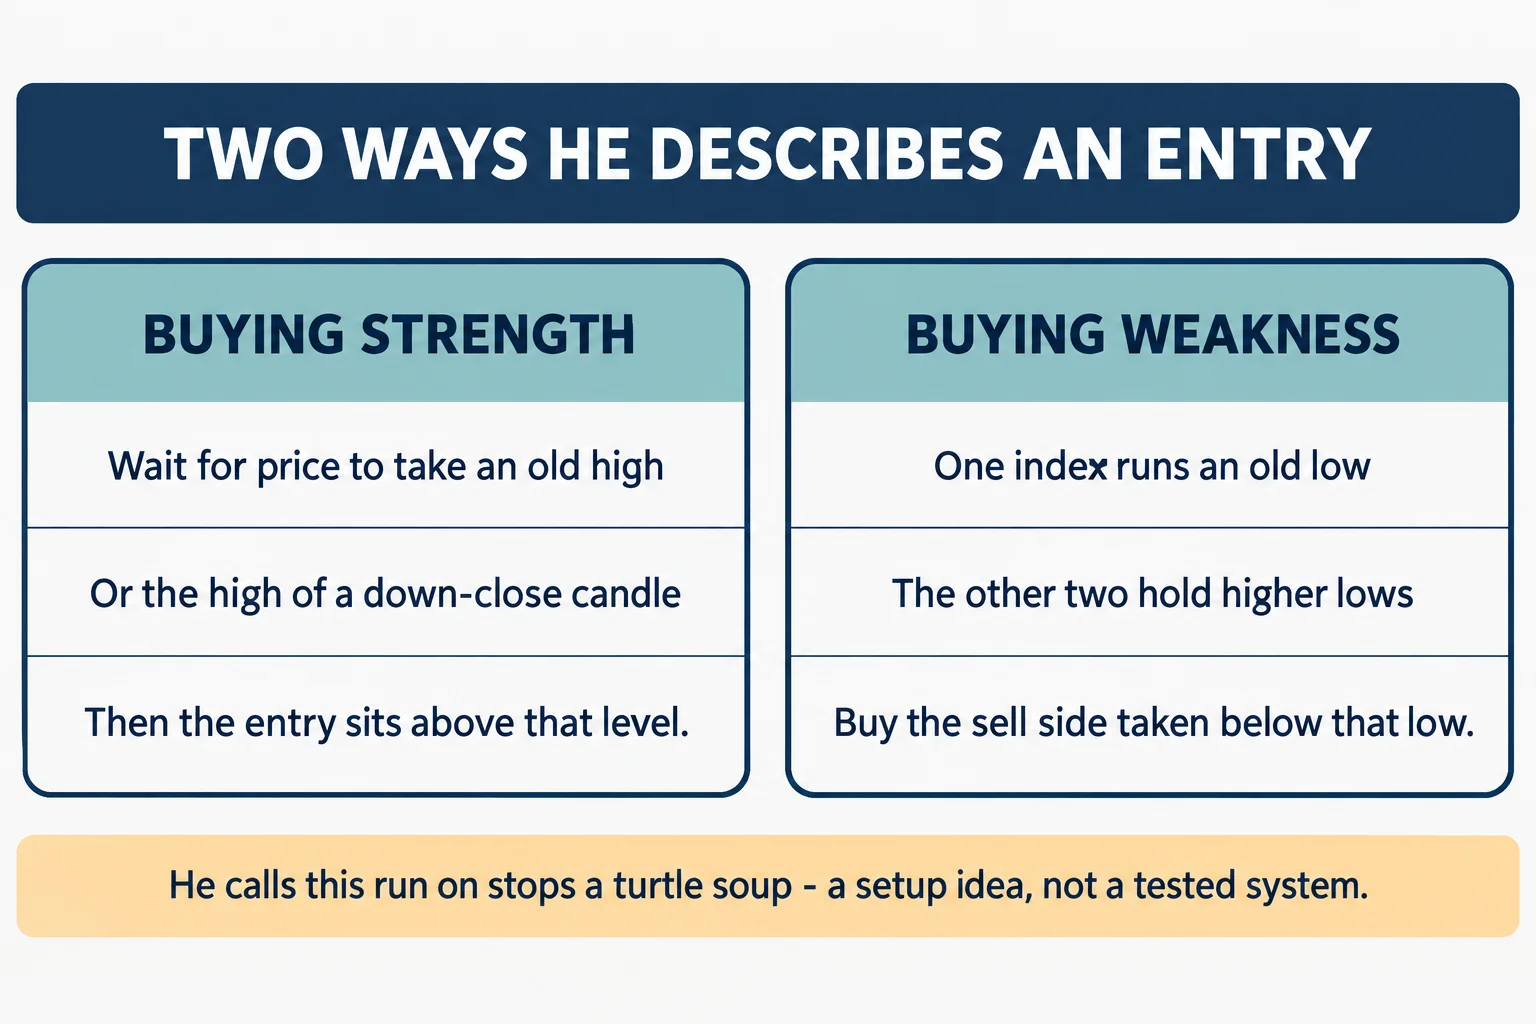
He frames the entries from the same example: with the Dow and S&P showing a failure to go lower, an index that runs under its 5:00 a.m. low is treated as a stop run that reprices higher after that low is violated (14:48 and 15:00). From there he describes two ways he looks for the trade (15:20):
- Buying strength: be a buyer on a stop, either waiting for price to trade up through an old high or anticipating the breakout above down-close candles that would later become bullish order blocks, with the entry resting above the high of that down-close candle (15:37, 15:45, 15:50 and 16:03).
- Buying weakness: when one index trades below an old low while the other two diverge — going higher rather than confirming — put your attention on the one making the lower low, treat it as a run on stops, and buy it below the old low, scooping up the sell-side liquidity there (16:14 and 16:25).
He says either framework is acceptable and that the two are not presented as one having an advantage over the other, because all three indices are expected to move in tandem once the setup is in place (16:30 and 16:48).
On the term itself: the automatic captions render it as “turtle suit” (7:48 and 16:25), and in the same passage they render “old low” as “old boat” and what reads as “buy stop” as “five stock” (16:03 and 18:30). The surrounding words — a run on stops, buying below the old low — point to the stop-run term usually written turtle soup, but the caption text here is demonstrably unreliable on this phrase, so the rendering is flagged rather than silently corrected.
He adds one observation about relative speed: the index that makes the lower low and takes the stops tends to move faster, because participants want out quickly once those stops are hit, while the diverging index that has the expansion move can be more lethargic — and he cautions that this does not always equate to magnitude (18:48 and 19:07). No entry, fill, stop, position size or result is given anywhere in the lesson, so none of this can be read as a performance record.
Studying the AM trend on a large sample
On frequency, he says an index SMT divergence qualifies AM trend setups a few times a week (17:01 and 17:04), and that during the period when he was most active in following the indices he saw some measure of divergence on every single trading day (17:15). He immediately qualifies it: it does not equate to a large opportunity with low risk, and if the disagreement is not obvious he says to assume it is not there rather than strain to find one (17:20, 17:36 and 17:37).
He closes by saying the point of seeing the pattern repeatedly is that it builds familiarity and anticipatory price skills, and he answers the question he says students raise about how they can know they are buying into a stop run below an old low: when two indices want to go lower and only one does, the one that does is the stop run, and that is where he says to buy (18:22 and 18:38). He notes the lesson sequence continues with the PM trend and the effects of the New York launch hour (19:23).
A structured way to use the lesson without treating it as a system is to mark the two windows separately — the 5:00 to 9:30 a.m. scouting span for the cross-index comparison, and the 9:30 a.m. to noon span for the morning swing — record the relative highs and lows across all three indices for each session, and note where the labels above were applied at the time rather than afterwards. Because the examples in the lesson are retrospective walkthroughs chosen by the speaker, that record is what would show whether the described tendencies hold in an untouched sample.
What the lesson does not establish
- The article is based on the automatic YouTube caption transcript. The reviewer did not independently verify the chart geometry, the drawn levels or the later outcomes shown in the recording, and a caption file cannot confirm what any chart displayed.
- No entry, fill, stop, position size, account statement or profit figure appears anywhere in the lesson, and no result is reported for any index.
- The narrated price levels and handles quoted above are the caption text’s renderings. Machine captions mangle figures routinely, and the exact numbers should be checked against the recording audio before being reused anywhere.
- The caption file misrenders several terms in this lesson, including the stop-run phrase, “old low” as “old boat” and what reads as “buy stop” as “five stock”. Those renderings are flagged rather than silently standardised.
- Institutional order flow, smart money, killzone, breaker and turtle soup are the speaker’s labels for price action. The transcript cannot establish which institutions, if any, were trading at any level, nor that the accumulation he describes took place.
- The entry logic has no defined risk parameters. The lesson says nothing about position sizing, invalidation or what to do when the divergence does not resolve as described.
- The claim that large trading opportunities always carry this hallmark, and that buying into a stop run below an old low can be done with confidence, is stated as his conviction from observation rather than demonstrated. The lesson offers no study that establishes it.
- The 5:00 a.m. start of the comparison window rests on his reading of when European traders return from lunch, not on measured order flow.
Watch the original recording
ICT Mentorship Core Content – Month 10 – Index Futures – AM Trend
The Inner Circle Trader · published 19 October 2022 · about 19 minutes 43 seconds. This is the primary source for this article; every timestamp link above points into it.
The video is not embedded here because the owner has disabled playback on other websites. That was checked directly on 15 September 2026 from a BestProps page origin: the embedded player loads and returns “Playback on other websites has been disabled by the video owner” instead of playing, so no empty player is left on this page.
The watch page was read on 15 September 2026 and rendered as a public, listed video: ICT Mentorship Core Content – Month 10 – Index Futures – AM Trend by The Inner Circle Trader, upload date 19 October 2022, listed duration 1,183 seconds, about 97,762 views, playback on other sites disabled by the owner. The scheduling inventory lists the same upload under 19 October 2022, so the two agree. The caption file covers about 1,180.6 seconds, which matches the listed duration within roughly two seconds.
Resources
These are the sources checked for this article. The regulator and investor-education pages are general material about trading systems promoted to the public and about investment products and their risks; neither assesses the speaker, verifies any level or reading above, nor endorses anything said in the recording. Any ICT, smart-money or third-party indicator, script, note set, transcript pack, chart annotation or re-upload circulating outside the publishing channel’s own page is unofficial and untested here.
- [1] ICT Mentorship Core Content – Month 10 – Index Futures – AM Trend — The Inner Circle Trader (primary source; watch page read 15 September 2026, 1,183 seconds).
- [2] The Inner Circle Trader — official YouTube channel (read 15 September 2026).
- [3] CFTC — Fraud Advisory: Commodity Trading Systems Sold on the Internet (read 15 September 2026) — the regulator’s guidance on evaluating trading systems and advisory services promoted to the public, including the questions it says to ask about a futures or options system.
- [4] Investor.gov (SEC) — Investment Products (read 15 September 2026) — general investor education covering products and their risks, with companion material on avoiding investment fraud.
Source: ICT, ICT Mentorship Core Content – Month 10 – Index Futures – AM Trend, The Inner Circle Trader, 19 Oc