
Key takeaways
In the first lesson of the May 2017 mentorship month, ICT sets out what he calls the sentiment effect.
Read the full summary
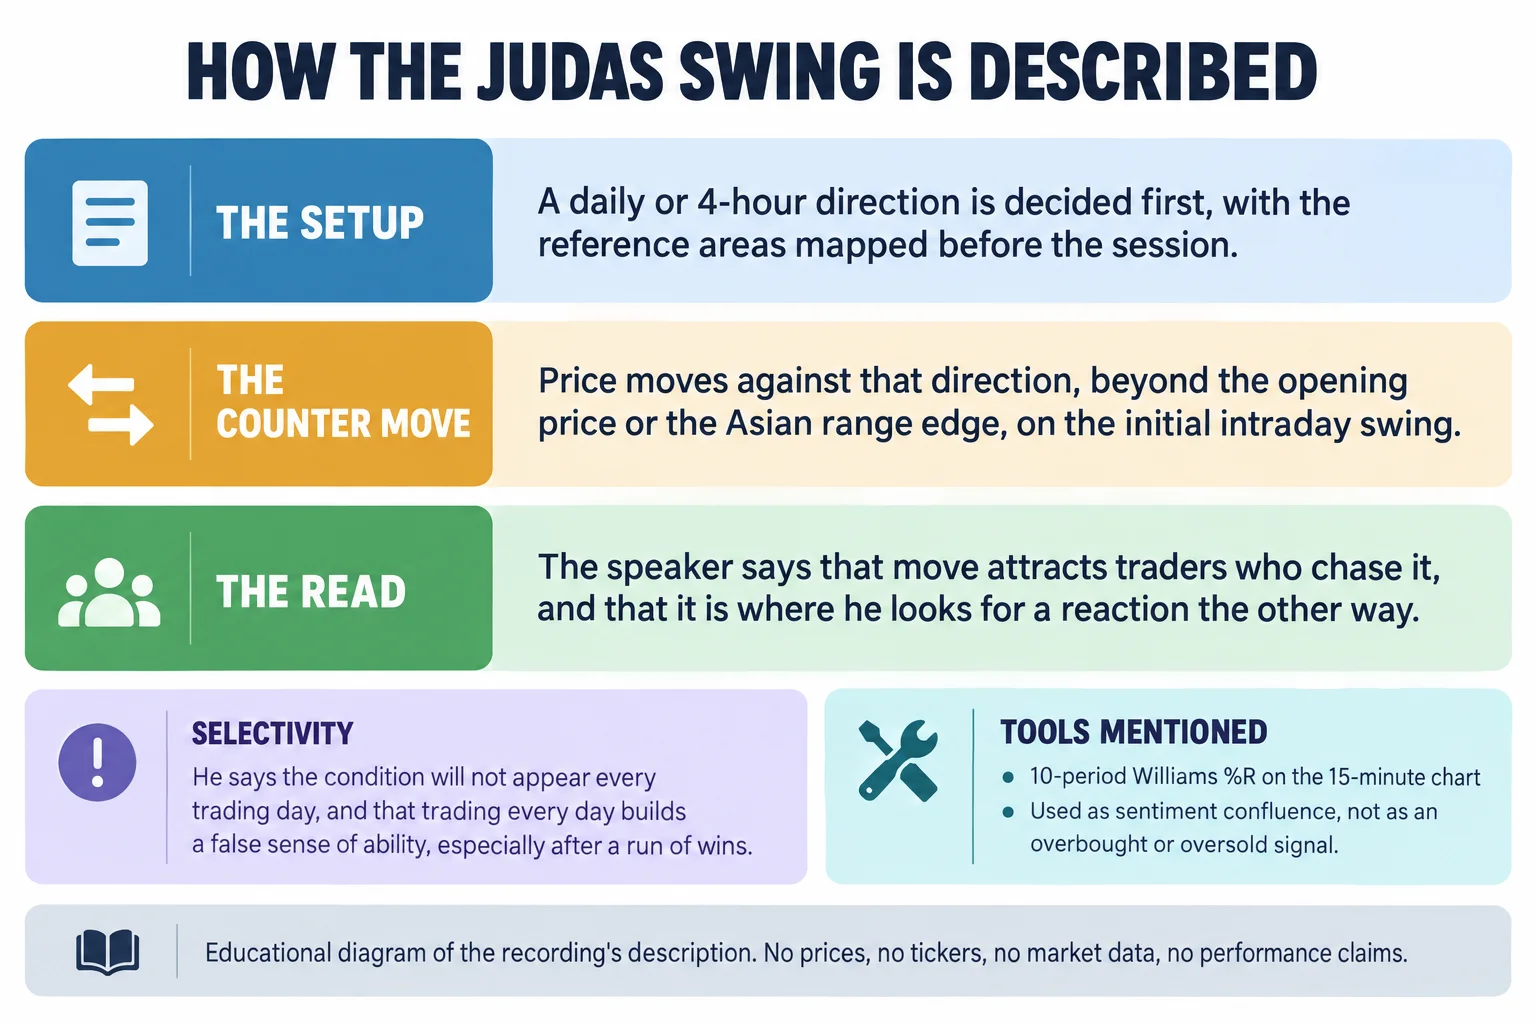
In the first lesson of the May 2017 mentorship month, ICT sets out what he calls the sentiment effect. The idea is that a day trade is taken in the direction of the daily or four-hour order flow, but only after price has made an initial intraday move against it — beyond the opening price, the Asian range edge, or both. He calls that counter move a Judas swing and says it is what draws less informed traders into chasing price just before the move he actually wants. For longs he wants bullish daily or four-hour order flow, a daily or four-hour discount array that has already produced a reaction, price trading below the midnight New York opening price and the Asian range low, ideally into a 15-minute discount array, and then a sharp departure from that array rather than a long hover. Shorts mirror every step. He uses a 10-period Williams %R on the 15-minute chart purely as sentiment confluence, never as an overbought or oversold trigger, and he wants sentiment to read most bearish right at a long and most bullish right at a short. He also states the limits plainly: the condition will not appear every trading day, trading daily builds a false sense of ability, and he provides no evidence of repeatable profitability.
How we researched this article
BestProps used document-based research from primary firm sources, checked September 24, 2026. The complete source list, scope, limitations, and commercial-state record appear near the end of this article.
What the sentiment effect is meant to capture
The recording opens the May 2017 month on amplified day trading and scalping and identifies itself as the lesson on the sentiment effect (0:12, 0:18, 0:23). He frames the question as where buying or selling probabilities are highest for a day trade, and his answer relies on two intraday reference points: the Asian range and an opening price (0:29, 0:38).
The direction of the intended trade comes first. On a bearish day, or when he is looking to sell short, he wants to see a move above the opening price, the Asian range high, or both (0:49, 0:54). On a bullish day, or when going long, he wants a move below the opening price, the Asian range low, or both (0:57, 1:01). In both cases the trade is in the direction of the higher-time-frame flow and the entry is on the counter move.
He describes that counter move as a short-term shift in sentiment and says less informed traders will chase price on the impulse or initial intraday swing. His term for it is the Judas swing, and he describes the market as entering a state that opposes the general direction of the day’s close (1:05, 1:10, 1:16, 1:19). That is his explanation of why the move happens. It is an interpretation of market behaviour, not something the transcript can establish.
He then states the general rule he says produces the highest-probability setups: strict daily or four-hour direction based on what he calls institutional order flow, combined with the PD array matrix for the next level objectives, and then a wait for the opposing move (1:27, 1:35, 1:39, 1:42).
The higher-time-frame half of the framework
The Asian range is not used on its own. If the daily or four-hour order flow is bearish, what he looks for primarily is a move above the Asian range high and away from the opening price, on the basis that his concept of smart money sells above that high. If the flow is bullish, the equivalent action is buying below the Asian range low and below the opening price (1:50, 2:08, 2:15).
He explains how the counter move works in his model: with bearish daily or four-hour flow the market typically goes above the Asian range high, which he says sucks in what he calls street money buying the breakout; with bullish flow, moves below the Asian range low trip those same traders into selling short, putting them on the wrong side (3:03, 3:14). Again, this is his account of the mechanism.
On the opening price he addresses the obvious ambiguity himself. It is either the zero-GMT opening price or an early session level if the market has consolidated close to the same area, and he adds that if the range from the zero-GMT hour has not produced much of a range on either side, that opening price can still be used. For this lesson, however, he says he is focusing primarily on the midnight candle in New York (2:23, 2:27, 2:46). That matters in practice: a reader testing this needs to fix one session reference and keep it, rather than switching after seeing what price did.
The long conditions, step by step
He starts the buy conditions at 3:23. The first requirement is that a daily or minimum four-hour discount array is already in play — meaning price has recently respected or traded down into a discount array and shown a willingness to support price there, so there has already been some reaction (3:30, 3:39). Combined with bullish order flow, he calls that a very high-odds condition for a buy in a day trade (3:57).
The second requirement is range. He asks whether there is enough distance between current market price and the opposing premium array on the daily or minimum four-hour chart for the trade to be worth taking, because trading down into that discount array by itself means little if there is nothing to travel toward (4:04, 4:12, 4:27). He puts numbers on this preference and they are his own taste rather than a market rule: something like 50 to 60 pips is a healthy range for a day trade, anything under 40 pips he treats as a scalp, and 50 to 60 is what he likes to see (4:44, 4:50, 4:54). A fixed pip threshold also means different things on different instruments and in different volatility regimes.
The third requirement is the intraday trigger: price declines under the opening price — which he again specifies as the midnight candle in New York — and below the Asian range low (5:03, 5:05). Ideally that decline lands on a logical discount array on the 15-minute chart (5:14).
Then comes the part he stresses most. He says price typically will not spend much time at that 15-minute discount array and he expects it to trade sharply higher away from it. The longer price stays or hovers near the array, the more the odds drop off, in his words precipitously. His stated reason is that banks will not keep price at a discount for long if the level is going to hold, and he wants to see an immediate response (5:21, 5:28, 5:35, 5:42). So touching a zone is not the signal; a prompt rejection is what he describes as confirmation.
Finally, he ties sentiment to the entry. He says short-term sentiment will be most bearish at the moment he enters a long (5:49).
How Williams %R is used here
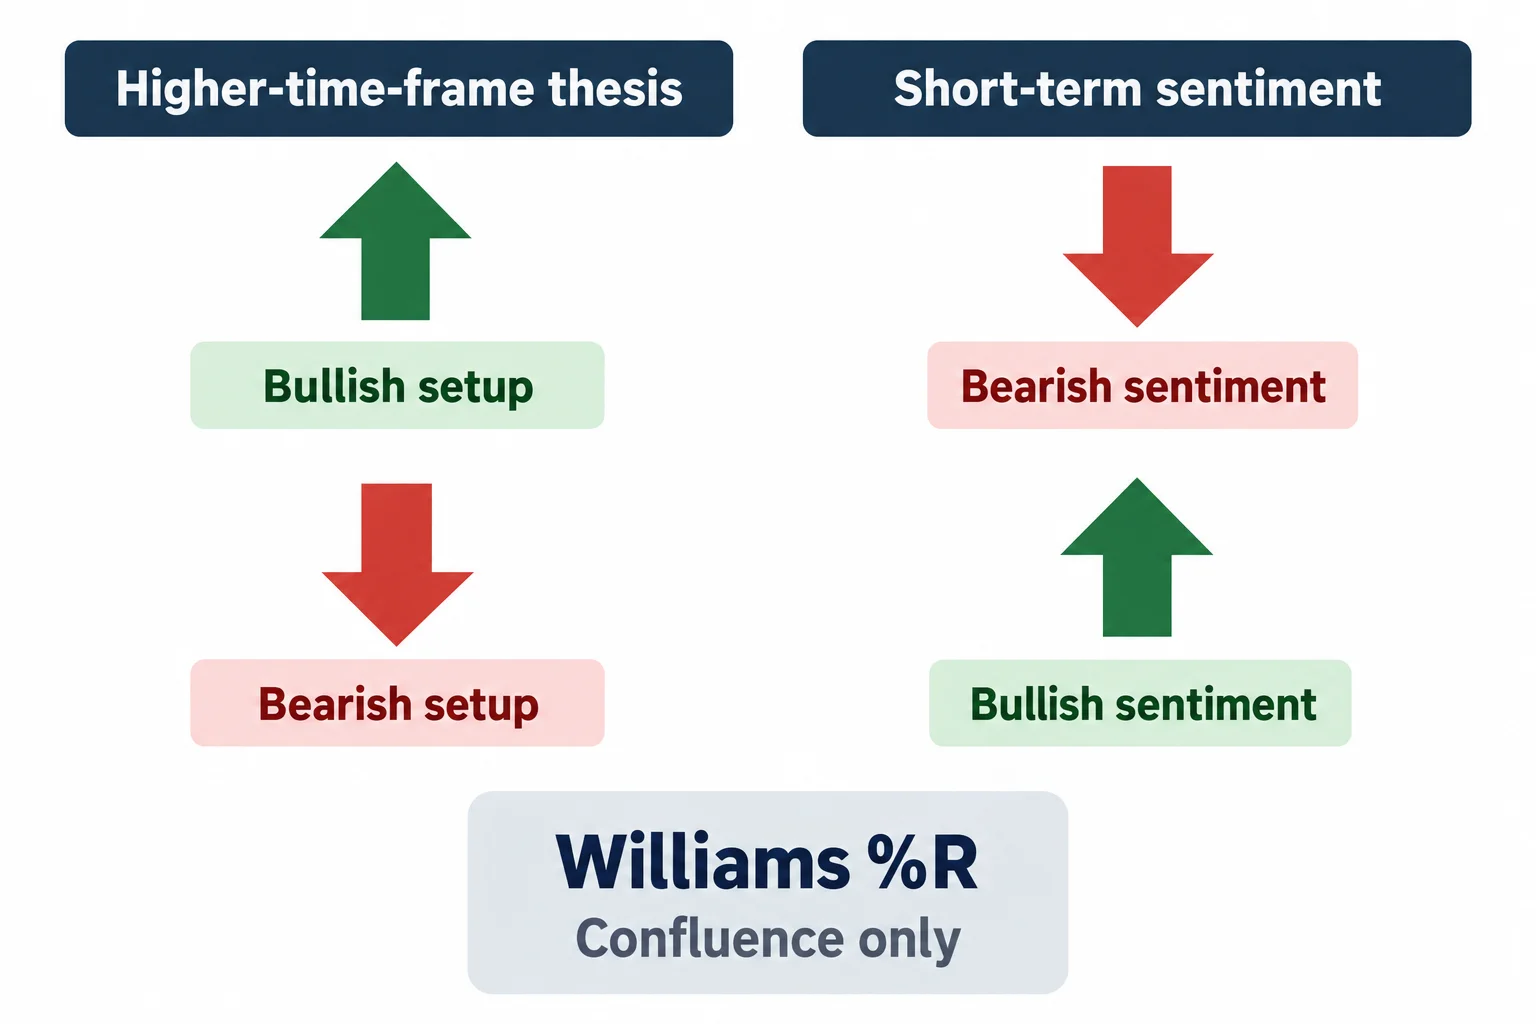
For sentiment he says he uses a 10-period Williams %R plotted on the 15-minute timeframe (5:56, 6:00). The important qualification is how he does not use it: he says he does not look at the overbought or oversold conditions the indicator is usually referred to for (6:09). His stated conditions are primarily about price, and the indicator is only a confluence that raises his confidence that he is on the right side (6:18, 6:25).
Stated as a rule: in a bullish setup he wants short-term sentiment to read especially bearish near the long, and in a bearish setup especially bullish near the short. The indicator is being used to show the crowd leaning hard against the higher-time-frame thesis. It is not presented as an entry trigger, and no claim is made that the reading has predictive power on its own.
The short conditions and the worked examples
The short setup mirrors the long one. It requires a daily or minimum four-hour premium array in play, sufficient range in pips between market price and the opposing discount array, and price rallying above the opening price in the midnight New York handle and the Asian range high. Ideally the rally reaches a logical premium array on the 15-minute chart, price does not spend much time there, and it trades sharply lower away from it — with the same warning that the longer it hovers, the faster the odds fall. Short-term sentiment should be most bullish at the moment of the short (8:03, 8:10, 8:21, 8:26, 8:31, 8:36, 8:43, 8:50, 8:57).
He closes with a walkthrough of the week he was recording in. He had said he expected the weekly low to form in Thursday’s New York session; price came down and hit stops, including on the New York open ahead of an employment number, and he noted in that live session that the stop run before the release was not a good sign and that the market was probably pricing in the low of the week (6:34). He describes the subsequent rally off a discount array and an old low on the daily chart, through two fair value gaps, stopping at the resistance of the second and upper gap — a draw up to a premium array that he attributes to the accumulation of those sell stops (7:02, 7:08, 7:17). He acknowledges the obvious objection himself — that this would otherwise look like hindsight cherry-picking — and answers that they watched it unfold live (7:31, 7:42, 7:51).
He also works through a USD/CHF example. He points to a bearish order block being traded up into at the Asian range high, with the 10-period Williams %R showing sentiment most bullish at that moment, followed by two subsequent highs of the day and a move lower. He notes the pair was moving in concert with a bearish dollar-index idea after a gap filled, and that on its daily chart price had traded up to a rejection block on the Thursday, then rallied above the Asian range high on the Friday and traded down to fill the discount array — in that case a fair value gap on the daily — which was filled before Friday’s close (9:05, 9:14, 9:21, 9:29, 9:50, 9:54, 9:57, 10:10).
One thing must be said plainly about these examples. They are narrated over past charts, which the transcript describes but does not display. No order ticket, position size, fill or account result is reported anywhere in the recording, so none of the outcomes described can be treated as a verified real-money result.
His own qualifications, which are the most important part
The closing section is unusually direct about selectivity, and it deserves to be quoted rather than summarised. He says there will not be a scenario that provides this entry every single trading day, and that the purpose of the teaching is that day trading is not everyday trading (10:21, 10:27). He says he does not think there is any reason to be in the market every single trading day looking for something, unless the purpose is practice and reinforcing concepts (10:31).
He also separates studying the method from trading it daily: while that study is profitable, he says, it does not equate to profitable everyday trading (“while that study is profitable it doesn’t equate to profitable everyday trading”) (10:45). He connects the point to the 20-pips-per-day material from the same month, saying it is not an enticement to go in every day hunting 20 pips (10:55, 11:04). And he describes the cost of over-participation in his own terms: the more you trade the more likely a loss and the sooner it arrives, trading every day builds a false sense of ability, and the worst case is a string of wins that makes a trader think they are better than they are before a dry spell arrives (11:16, 11:31, 11:54, 12:04, 12:09, 12:15).
His closing formulation is that the rule-based use of sentiment and the Asian range helps filter for the better trades, that the condition will not appear every day, and that the days it does are the days the highest probability for day trading is in his favour (12:24, 12:34, 12:39).
Practical educational takeaways
- Fix the higher-time-frame direction before anything else. The counter move is only meaningful against a direction that has already been decided in advance.
- Choose one opening reference and keep it. He names both zero-GMT and midnight New York and then says this lesson uses the midnight candle; switching between them after the fact would make the method untestable.
- Check that there is room to travel. His own filter is around 50 to 60 pips to the opposing array, with anything under 40 treated as a scalp, and he presents those as personal preference.
- Treat the reaction, not the touch, as the condition. His stated requirement is a sharp departure from the 15-minute array and a drop in odds the longer price hovers.
- Use Williams %R as confluence only. He explicitly says he does not use its overbought or oversold readings, and the transcript offers no evidence the reading predicts anything on its own.
- Take the selectivity warning seriously: by his own account the setup is not present daily, and he describes daily trading as harmful rather than additive.
A checklist drawn from the lesson
- Establish the daily or four-hour order flow direction.
- Confirm the relevant daily or four-hour premium or discount array has already produced a reaction.
- Measure the range to the opposing array and decide whether it is worth trading.
- Pick the opening reference for the session — here, the midnight New York candle — and mark the Asian range high and low.
- Wait for price to move against the thesis, beyond the opening price and the Asian range edge.
- Check whether the move has reached a logical 15-minute discount array for a long or premium array for a short.
- Require a prompt departure from that array; downgrade the idea if price hovers.
- Look for the 10-period Williams %R to read stretched against the thesis — bearish at a long, bullish at a short — as confluence only.
- Record the outcome either way, including the failures, so the method can be reviewed rather than assumed.
This checklist is an educational summary of the framework ICT describes in the recording. It is not investment advice, and nothing in the recording establishes the method’s profitability.
A note on the captions
The transcript used for this article is the automatic YouTube caption track, which mishears some of the lesson’s terminology. It renders “IPDA” as “IPA” and appears once as “as ipa’s suggestion”; it writes “zero GMT” as “Z gmt”; it mangles “proactive state” into “proactionary state”, “trader” into “Trad aholic” and “pip drunk” into “pip trunk”; it writes “4 hour” variously as “4our”, “4H hour” and “4-Hour”; and it drops hyphens in phrases like “50 60 Pips” and “40 Pips”. It also compresses the Williams %R period into “10 period Williams percent r”. The terms used in this article are the ones the surrounding context supports; where a phrase could not be resolved confidently it is described rather than quoted.
Watch the original recording
ICT Mentorship Core Content – Month 09 – The Sentiment Effect
The Inner Circle Trader · published 9 October 2022 · about 13 minutes. This recording is the primary source for every timestamp link above.
The recording is not embedded here because the video owner has disabled playback on other websites. That was tested directly on 15 September 2026 from a BestProps page origin at both desktop and mobile widths: the embedded player loads, then reports “Playback on other websites has been disabled by the video owner” with no duration and no playback progress, while the video itself plays normally on YouTube. No empty or half-working player is left on this page.
The watch page was read on 15 September 2026 and is publicly listed as ICT Mentorship Core Content – Month 09 – The Sentiment Effect by The Inner Circle Trader, upload date 9 October 2022, listed duration 768 seconds — about 12 minutes, 48 seconds. The caption track used for this article runs to 769.5 seconds, so the transcript and the listed duration agree.
Resources
These are the sources checked for this article. The regulator and investor-education pages are general material about short-term trading and about how systems and advisory services sold to the public should be assessed; neither one evaluates this speaker, verifies any condition, level or reading described above, nor endorses anything said in the recording. Any ICT, smart-money or third-party indicator, script, note set, chart annotation, transcript pack or re-upload circulating outside the publishing channel’s own page is unofficial and has not been tested here.
- [1] ICT Mentorship Core Content – Month 09 – The Sentiment Effect — The Inner Circle Trader (primary source; watch page read 15 September 2026, listed duration 768 seconds).
- [2] The Inner Circle Trader — official YouTube channel (read 15 September 2026) — the publishing channel for the recording used here.
- [3] Investor.gov (SEC) — Day Trading (read 15 September 2026) — investor education describing day trading as extremely risky and capable of producing substantial losses over a very short period.
- [4] CFTC — Fraud Advisory: Commodity Trading Systems Sold on the Internet (read 15 September 2026) — the regulator’s guidance on assessing trading systems and advisory services sold to the public, including its warning that hypothetical results are typically simulations calculated over prices that occurred in the past.
Source: ICT, ICT Mentorship Core Content – Month 09 – The Sentiment Effect, The Inner Circle Trader, 9 October 2022. Automatic YouTube captions were the transcript used for this article; several terms the track mishears are noted above. This commentary is educational and is not investment advice.