
Key takeaways
ICT Filling the Numbers teaches that an intraday range tends to cross at least four sequential levels in the trade direction using floor trader pivots, the Central Bank Dealers Range, the Asian range or the float, but ICT says the active measurement cannot be known beforehand and projections have no value without confluence from time…
Read the full summary
ICT Filling the Numbers teaches that an intraday range tends to cross at least four sequential levels in the trade direction using floor trader pivots, the Central Bank Dealers Range, the Asian range or the float, but ICT says the active measurement cannot be known beforehand and projections have no value without confluence from time of day, direction and the PD array matrix. From an entry, longs count four levels above and shorts four below, with most of the position removed at level four and a remainder held for expansion. His stated example takes 75 to 80 percent off and leaves 25 to 30 percent, figures that do not reconcile. Floor pivots use midnight GMT data, with M3, R1, M4, R2, M5 and R3 above the central pivot and M2, S1, M1, S2, M0 and S3 below. Central Bank Dealers Range shorts count the range low as level one and project standard deviations downward, while longs count the range high first and project upward. Asian range trades apply the same rule from its high or low. The float uses the highest high and lowest low, or body opens and closes, from three p.m. to midnight New York time, splits the total range at equilibrium and projects every additional level in increments of 50 percent of the original range. Shorts must enter above equilibrium and count the lower half boundary first, while longs enter below equilibrium and count the total range high first. Four levels are only a rule of thumb, large-range days can reach five or more, and London may deliver 80 percent of the daily range before activity fades. ICT recommends calculating all four families, seeking overlapping projections into New York, and specializing in one pair plus a correlated second such as cable with fiber or kiwi with aussie rather than tracking 28 pairs. The lesson reports no fills, position sizes or account results, and ICT says pivots are not magic numbers and he cannot execute the method every day.
How we researched this article
BestProps used document-based research from primary firm sources, checked September 24, 2026. The complete source list, scope, limitations, and commercial-state record appear near the end of this article.
In ICT Mentorship Core Content – Month 09 – Filling The Numbers, the speaker opens by placing the lesson as lesson two of the May 2017 mentorship series on amplified day trading and scalping, and names the subject as filling the numbers (0:12). He defines it as the likelihood or tendency for price to “fill” specifically four numbers per day, with the daily range seeking to trade to four specific levels each trading day (0:33). The watch page dates the upload to 9 October 2022, so this is a re-release of 2017 teaching material; the recording itself refers to the May 2017 series throughout.
He frames the whole exercise on two reference points first. As a day trader he says you work with the previous day’s high and low and the last three days’ high and low (whichever is the highest of those for swing points on a daily chart) and calls those levels your bread and butter (0:56). He adds a qualification immediately: he always looks for one of the previous day’s extremes to be traded to, but says that does not have to happen, because the daily range can be smaller than would be required to reach it (1:26).
What an ICT Number Means
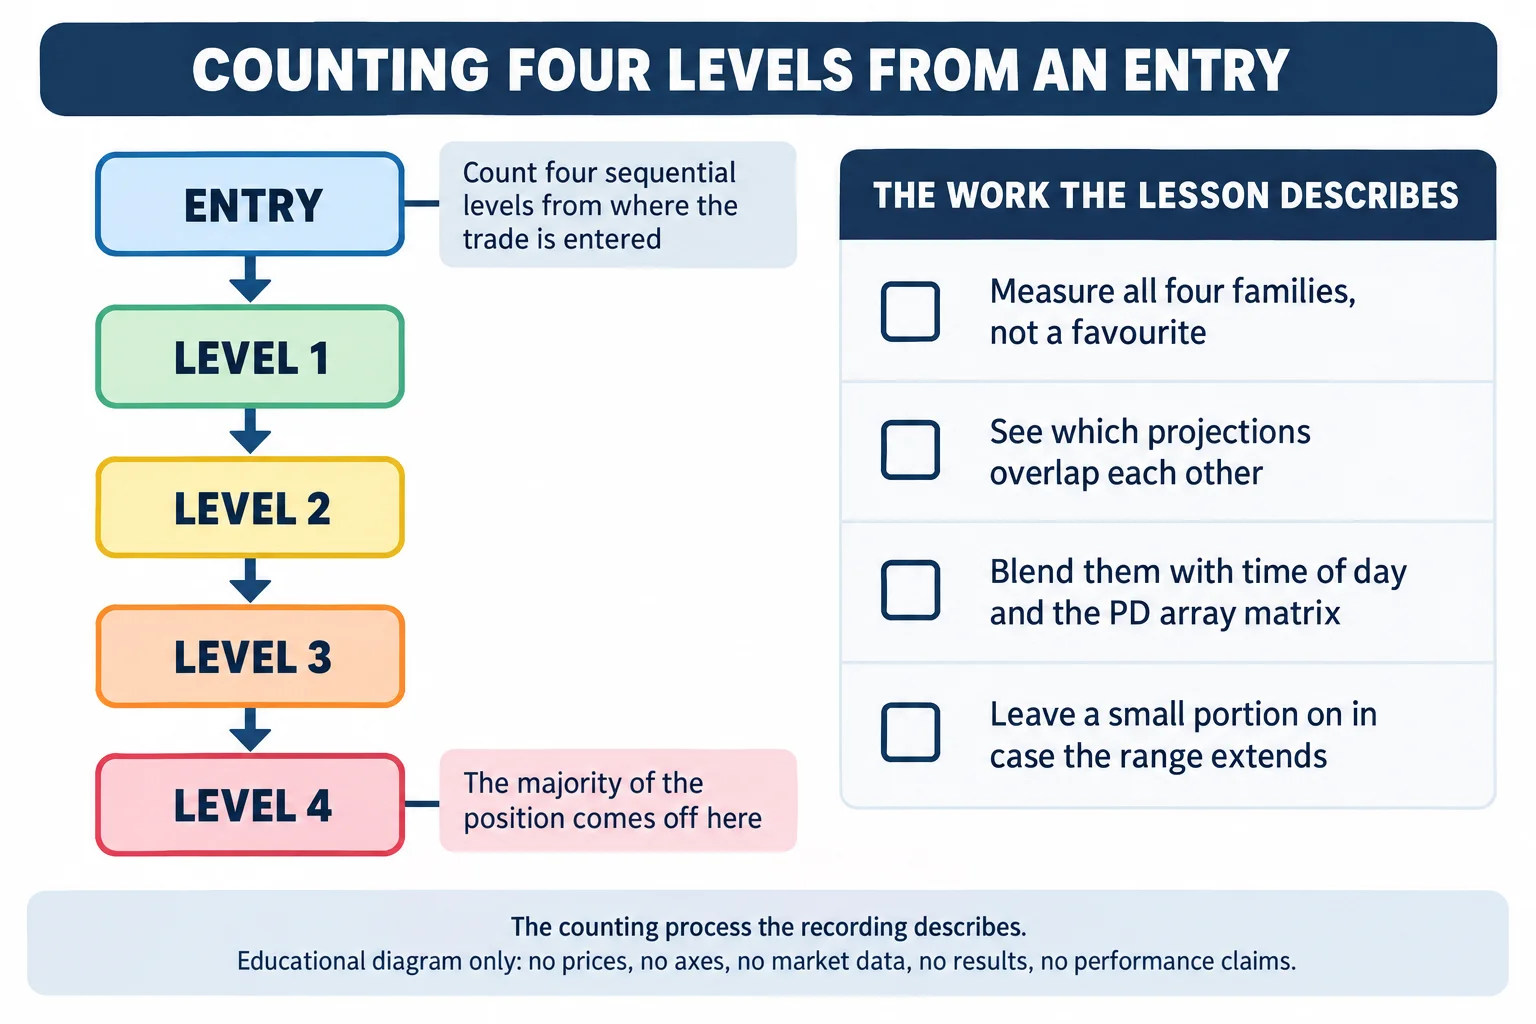
The counting rule is simple and he states it before any of the measurement families. Take your trade entry point and look for the numbers that will fill from that price (5:40). If you are long, you count the four sequential levels above your entry; if you are short, you count the four sequential levels below it (5:47).
His worked example is a short entered near the R2 pivot, from which he counts M4, R1, M3 and the central pivot as the four levels below (6:01). He then states the two caveats that govern everything after. On large-range days more than four levels can be filled, and the tendency to move at least to four is a general rule of thumb rather than a limit (6:23). His stated position management follows from that: ideally the majority of the position comes off once four levels are filled, with a portion left on for the potential of a larger range day if time permits (6:39).
On the position size he is specific but internally loose: a long taken from London that has seen four pivots traded to the upside should, he says, have had about 75 to 80 percent taken off in profit with a small portion of 25 to 30 percent left on, because New York can produce a wilder continuation (6:55, 7:15). Those two figures are as he gives them and do not arithmetically reconcile; the article repeats them rather than tidying them. This is his trade-management teaching, not a performance-backed recommendation.
ICT Number Measurement With Floor Trader Pivots
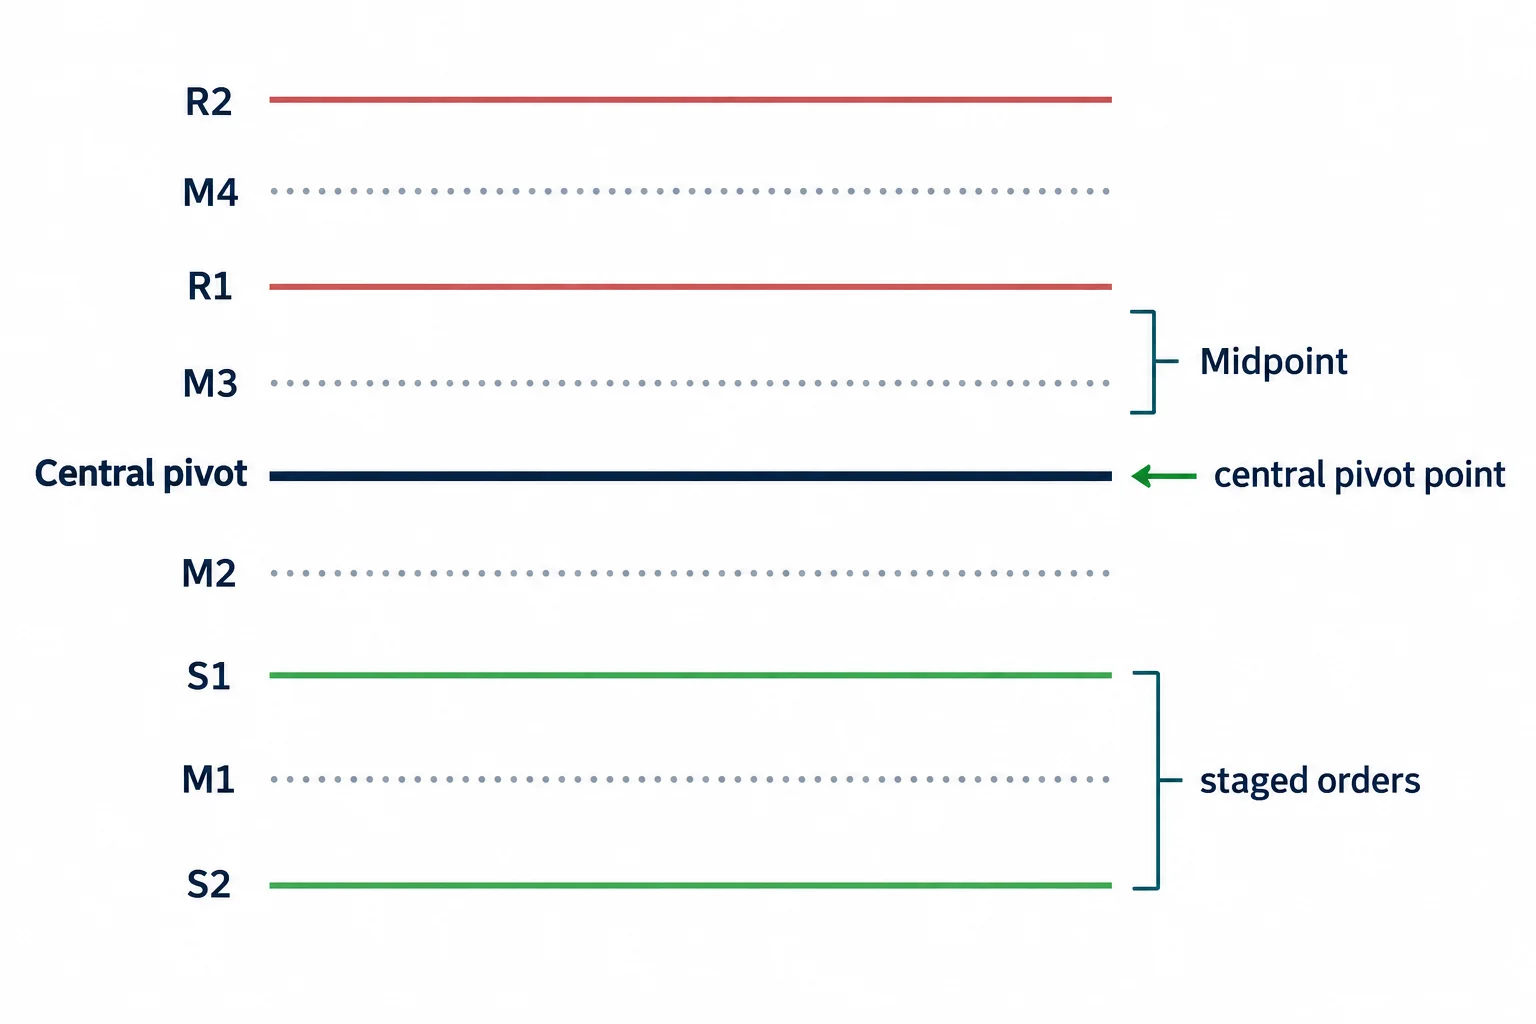
He describes pivots as one of the tools most used by retail traders and still used by large funds, historically known as the floor traders’ pivot numbers (1:47). He is explicit that he does not use them much in his own trading, with one exception: he looks at the central pivot point, working from 00:00 GMT pivots (1:59).
The ladder above the central pivot, in his order, is M3, R1, M4, R2, M5 and R3, where each “M” is the midpoint, or 50 percent of the distance, between the two pivots either side of it (2:12, 2:33). Below the central pivot he gives the mirror sequence: M2, S1, M1, S2, M0 and S3 (4:10, 4:32).
His reason for caring is what he calls staged orders. He says traders and funds use these levels collectively, so price will invariably trade to them and through them, and that most people who use pivots are not using them accurately and they do not always work (2:49). “Staged” in his usage means there are buyers and sellers at those levels precisely because most people do not know how to use them (3:12).
He gives a counter-intuitive example to make the point. What the retail consensus treats as a good buy below the central pivot at S1 or S2 might actually be a good area to sell short once the daily range has begun expanding downward and price trades back up to it, which he calls a continuation sell (3:23). His position is that the direction of the orders at those levels does not matter to him. What matters is that price will go there to facilitate trade and pass through for fund liquidity, with the big banks trading through these levels “to fill those numbers” (3:47).
He also points out that this is not knowledge he expects viewers to already have. He says it is a simple little indicator he will share on the forum, downloaded as an MT4 indicator from the resources tab under the PDF link that stays inactive until the lessons are complete (4:45). And he separates the two purposes: it is not important to learn to trade pivots the way the retail crowd does, but it is important to understand what the levels are and how he interprets them for filling the numbers (5:09).
ICT Range Measurement With Central Bank Dealers
The same four-level count is then applied to what he calls the Central Bank Dealers Range, introduced as unique to him rather than a common tool (9:19). For a short, entered above the range, the low of the Central Bank Dealers Range itself is level one of four, whatever that lowest line is, whether it is drawn from wicks or from the lowest open or close of the bodies (7:36, 7:56). He is careful to say the choice of wicks or bodies is the trader’s, and that whichever is used, that figure represents the first of four (8:03).
So the short is ideally taken above that low, and when price trades down through it, that crossing counts as one of the four (8:15). He says the expectation is that the market trades down to four Central Bank Dealers Range lows, and the count works by treating each new standard deviation of the range projected lower as one further level (8:30, 9:38). His chart walkthrough labels those crossings as level one, two, three and four in sequence (8:47, 9:08).
He then says to reverse the whole construction for buying: buy below the range low, count the range high as level one once price reaches it, and keep projecting the range’s standard deviations higher, stacking them on top of each other until four are crossed (9:56, 10:16). His summary of the pairing is that price will look to fill four pivots or four Central Bank Dealers Range projections, and that either can be used (10:25).
One thing this lesson does not do is restate how the Central Bank Dealers Range itself is built. He refers to “once we determine what the Central Bank Dealers Range is” without defining it here, so the counting logic is fully specified in this recording while the range construction is not (7:51). The float range that follows, by contrast, is given a complete definition, which is the difference worth noting between the two.
ICT Range Measurement With Asian Sessions
The Asian range version is the simplest of the three so far. When buying below the Asian range, the high of the Asian range is level one of four, and he says to expect the market to trade up four Asian range highs, with the whole construction reversed for shorting (10:48).
His chart example shows price making a low after the midnight candle opened and trading lower, then the Asian range high being filled as level one, followed by levels two, three and four (11:08). He repeats the caveat here in its clearest form: four is just a general rule of thumb and price can always go one more level or more (11:29).
ICT Float Range Measurement and Its Key Difference
The fourth family he introduces as the float, and his own introduction signals it is new material: he says they have not talked about it yet and that he will teach it in detail later in the month, using it here as a bridge into those lessons (11:50, 13:36, 18:29). The label needs a caveat of its own: the automatic caption track renders this term inconsistently, as “float” in the introduction, as “flow” through the middle of the explanation, and as “flout” and “flat” later (13:44, 22:25, 23:07). This article uses “float”, the form the clearest introduction supports, and notes the variants rather than pretending the wording is settled. The definition below is unaffected by which spelling is right.
The construction he gives is at 13:44 to 15:08 on the recording and it is fully specified. The range is measured between 3:00 p.m. New York time and midnight New York time, using the highest high and the lowest low (or, alternatively, the highest and lowest open or close of the bodies), and he says to do both because retail data feeds can differ, which gives a good idea of the true range (12:19, 12:39). Take that total range, find its middle or equilibrium, and you end up with two new half-ranges, one of which becomes one of the numbers used for the float (12:50, 13:12).
The rule he stresses is that every additional level is projected in increments equal to 50 percent of the original total range, not the whole range. He says it twice, the second time as an explicit correction: you are projecting standard deviations of half the range between 3:00 p.m. and midnight, and you do not use the float’s total range (13:16, 15:00, 23:02).
The two directions follow from the equilibrium. To be short you must be selling above the equilibrium of the total float range, in its upper portion, and the new float range low (the lower half of the total range) is level one (14:11, 14:33). To be long you buy below the equilibrium of the same 3:00 p.m. to midnight range and use the total range’s high as level one, projecting half the total range as each new number thereafter (14:40). His chart walkthrough carries that count down through level two, level three and level four, then notes it went one more projection to a fifth level that nailed the low, on a pound-yen chart, which he offers to show that he says the approach works on the exotic pairs too (15:13, 15:34).
Which ICT Range Measurement Does the Day Use?
He poses the question himself and answers it with a refusal to be certain: you never know before the day begins which measurement will be used to fulfil the daily range, and he says plainly that he never knows it either (15:59, 16:20). What he does instead is watch London trading going into New York, on the basis that by New York he has greater insight, and that the New York session generally supplies the measurements that are actually being used for the day’s engineering (16:24).
Then comes the sentence that defines the method’s limits. By themselves, he says, these ranges and projections do not mean anything at all; what matters is confluence between one or more of the four families (16:55). Coupled with the trading conditions, time of day, direction and the PD array matrix, he says you identify the daily high or low (17:11). In practice that means working the measurement continuously rather than reading a chart passively, switching between charts to see which projections overlap and converge, and for a short looking for a discount PD array on the daily or four-hour that lines up with time of day and with the standard deviations from the Central Bank Dealers Range, the float or the Asian range, or four levels on the pivots (20:09, 20:29).
He is also clear that selecting a favourite is the wrong response. He says to go through all of them rather than sticking to the one you understand, and that if this already feels too complicated, the answer is to dig in and do the work rather than narrow the set (21:21). On instrument selection he says the arithmetic is manageable but not across a large basket: if you are following 28 pairs you will not want to do it, and the mentorship teaches being a specialist with one favoured pair and a second that is closely correlated, his examples being cable with fiber, or kiwi with aussie (21:42, 22:02).
And the timing uncertainty is not resolved either. He says he does not know how fast price will be delivered across the range: London can post 80 percent of the daily range and then the rest of the day goes quiet, or London does little and the whole range completes from 7:00 a.m. to the London close (19:40, 20:01). The management answer to being wrong is the leftover position: he calls the worst case seeing price go further than expected, and says that is precisely why a small piece stays on, because being wrong can be in your favour (20:57).
ICT Filling Claims and Their Limits
The recording ends with a live example, and it is where the article has to be most careful. He refers to a call he says he made in the members’ session during the week, that the week’s low was probably forming at Thursday’s New York open as price traded below sell stops that had been marked on their charts, ahead of the 8:30 a.m. news, and that the move was forming the bullish order block he then points to (25:06, 25:27). He then walks through the following day: a small consolidation, price dropping after midnight (which he notes is 4:00 GMT on the platform he was using) and trading back down to the Asian range low into a discount PD array and a bullish order block, with the pointed reminder that it did not have to break below the Asian range at all (25:39, 25:59).
On the currency level itself (he names it as the Euro), he says he stated while live with the group that 109.30 would probably be the daily high, because there was a fair value gap at that price range, and that he had an M5 pivot measurement calling for 109.33, with 109.30 as the nearest round number before it, which he teaches as the level to exit ahead of (26:16, 26:36). He says price ultimately traded to 109.35 (26:43). Two things about that deserve separating. First, the arithmetic is honest on his own terms and he says so earlier in the recording: referring to the same 109.30 level he states that he was off by five pips, and that price went up there with a great deal of ease (18:00). Second, the call itself is his account of what he said in a private session, and the chart is not visible in the captions, so neither the stated call nor the fill can be independently verified from this recording.
It is worth setting that example against his own broader admissions in the same lesson, because they are unusually direct. He says he does not know for certain at the London open where the high or low will be (17:29). He says members of the free group assume he does this daily and that this is not true (17:35). He describes it as a certain feeling he gets at certain times rather than a routine output (17:49), and says he deliberately does not show every element on his charts (18:14). He also says the pivots are “no magic number”, used to judge how far the range will expand rather than as entries, and that he does not use them much for entries at all (27:07).
His closing instruction is about effort rather than edge. He says the material will only work if you think with it, that simply putting the lines on a chart produces nothing, that it requires measurements through the day, and that when the work is done the results are what he calls blue ribbon (27:49, 28:10). He adds one condition that undercuts any promise: if the market does not move and has no volatility there can be no precision, because displacement has to be present (28:36).
What ICT Filling the Numbers Actually Claims
- Stated as a tendency: that price will trade to at least four sequential levels per day, from whichever of the four measurement families the day happens to use, with four a rule of thumb that is frequently exceeded (6:31, 11:33). No evidence is offered for the tendency beyond his own examples.
- Stated as his own toolkit: the pivot levels and their midpoints, the Central Bank Dealers Range and its projected standard deviations, the Asian range highs, and the float’s half-range projections, with the float range fully defined as 3:00 p.m. to midnight New York and the others not fully defined in this lesson (12:19).
- Stated as the method’s limit: that the measurement in use cannot be known in advance, that the projections mean nothing alone, and that confluence with direction, time of day and the PD array matrix is the whole point (16:14, 16:57).
- Stated as position management: majority off at the fourth level, a small portion retained for expansion, most of the position off by 75 to 80 percent with 25 to 30 percent left on (6:39, 7:04).
- Claimed from his own sessions, not verifiable here: the 109.30 daily-high call and the eventual 109.35, and the claim to have previously called daily highs and lows within one or two pips, sometimes to the pip (17:19, 18:00, 26:43).
- Explicitly not claimed: a reliable everyday result. He states he does not know at the London open, rejects the idea that he does this daily, and notes that without market movement there is no precision (17:31, 28:36).
ICT Range Measurement Study Checklist
- Mark the previous day’s high and low and the three-day extremes first, and accept that a narrow day may reach neither (1:00, 1:26).
- Build each family the way the lesson sp