
Key takeaways
ICT’s May 2017 mentorship routine uses six steps to prepare for a day trade or scalp without treating any setup as certain.
Read the full summary
ICT’s May 2017 mentorship routine uses six steps to prepare for a day trade or scalp without treating any setup as certain. Review medium- and high-impact economic releases around the London and New York kill zones, select one instrument and session, build rolling 60-, 40- and 20-trading-day Dollar Index ranges with yesterday as day one and Sunday candles excluded, mark the 20-day premium and discount halves plus order blocks, breakers, rejection blocks, fair value gaps and old highs or lows, repeat the process on the chosen pair, refine it on four-hour and hourly charts, then create reaction, failure and no-trade scenarios on the 15-minute chart using the Central Bank Dealers Range, standard deviations, Asian range, average daily range, midnight GMT and midnight New York opens. The worked example focuses on EUR/USD around 30 May 2017 after a medium-impact Spanish flash CPI release scheduled for three o’clock in the morning during London, with the Dollar Index analyzed first because EUR/USD is dollar-denominated. ICT primarily uses the 20-day range for day trading and expands to 40 or 60 days only when it is exhausted, treats premium and discount as location rather than entry signals, and argues against his initial daily bias before seeking lower-time-frame alignment. A bullish plan looks for price to trade below an opening price into discount and react, while a bearish plan looks for a rally above the open into premium followed by expansion lower on a 15- or 5-minute chart. His historical EUR/USD illustration cites a downside objective near 110.20 to the 110 big figure and more than 100 pips of range, not verified profit. The lesson emphasizes that day trading is not everyday trading, no setup works all the time, and the recording provides no verified orders, sizes, fills, balances or results.
How we researched this article
BestProps used document-based research from primary firm sources, checked September 24, 2026. The complete source list, scope, limitations, and commercial-state record appear near the end of this article.
ICT Day Trade Routine Overview
The recording is part of the May 2017 mentorship series on amplified day trading and scalping, and it introduces the routine ICT says he follows himself rather than a single setup (0:15, 0:23). The walkthrough uses the Dollar Index and EUR/USD around Tuesday, 30 May 2017 as its examples. The YouTube watch page lists the upload date as 15 October 2022, so the upload date and the market period shown in the charts are different calendar years and should not be confused.
Two framing points matter before the steps. First, the routine does not begin with an entry: it begins by choosing an event, an instrument and a session, and only then moves to chart work. Second, ICT keeps returning to the idea that the exercise produces scenarios, not certainties. He says plainly that he is sometimes right and sometimes wrong (49:51), and he describes a loss as feedback he paid for rather than a verdict (50:24).
Step 1 Check the Day Trade Economic Calendar
At 0:28 he says the first thing he does is review the economic calendar for the day that is going to be traded, either at the end of the previous session or before the session being studied. He looks for the high-impact and medium-impact releases and then checks the release times against the London open and New York open, which he calls the two dominant high-volume “kill zones” of the day (1:03, 1:16). The point, as he frames it, is to know when volatility may be injected rather than to forecast a direction from the news itself.
He also explains why he prefers the London window. In his description, the London session is where the day’s low is often formed under the “guise of manipulation,” and that move is frequently attached to a news release (1:30). That is his interpretation of how price behaves, not a finding the captions can establish.
In the worked example he reads a medium-impact Spanish flash CPI release scheduled for 3:00 a.m. on the euro, and notes that the hour sits in the heart of the London open kill zone. On that basis he narrows the day’s focus to one pair, EUR/USD, and one time window (1:57, 2:09, 2:36). He stresses that this only identifies a possible source of movement. It is not evidence that a trade must appear, and it does not tell him which way price will go.
Step 2 Build ICT Trade Ranges on the Dollar Index
With the pair and window chosen, he goes to the charts but deliberately starts with the Dollar Index rather than the pair itself (2:47). His stated reason is that a dollar-denominated pair has to be read against the dollar, so the dollar gets a baseline first (2:55).
The mechanical part of the routine is a set of rolling lookback ranges he calls the IPDA data ranges. He builds a 60-trading-day range, a 40-trading-day range and a 20-trading-day range on the daily chart. The counting rule he gives is specific: count yesterday’s daily candle as day one and work backwards, and on a platform that prints Sunday candles, exclude Sundays from the count because he does not treat that session as reliable daily data for the exercise (3:55, 6:04, 6:56). The ranges then shift forward by one session every day (6:22). He mentions that if a platform has no Sunday candle at all, the fix is simply to count back 60, 40 and 20 daily candles (7:32).
He also sets an expectation about which range will carry the work. For day trading and scalping he says he works primarily inside the most recent 20 trading days, and only widens to the 40- or 60-day range when the nearer range has been exhausted (8:48, 9:18). The purpose of the ranges, in his description, is to limit attention to what is currently relevant instead of reading the whole daily chart at once (20:00).
One item in this section is a quarterly observation rather than a daily rule. He says he anticipates a possible shift in market structure when a new quarter begins, roughly every three months, and describes it as something to expect rather than something guaranteed. His own word is that it is not a panacea (7:47, 8:08).
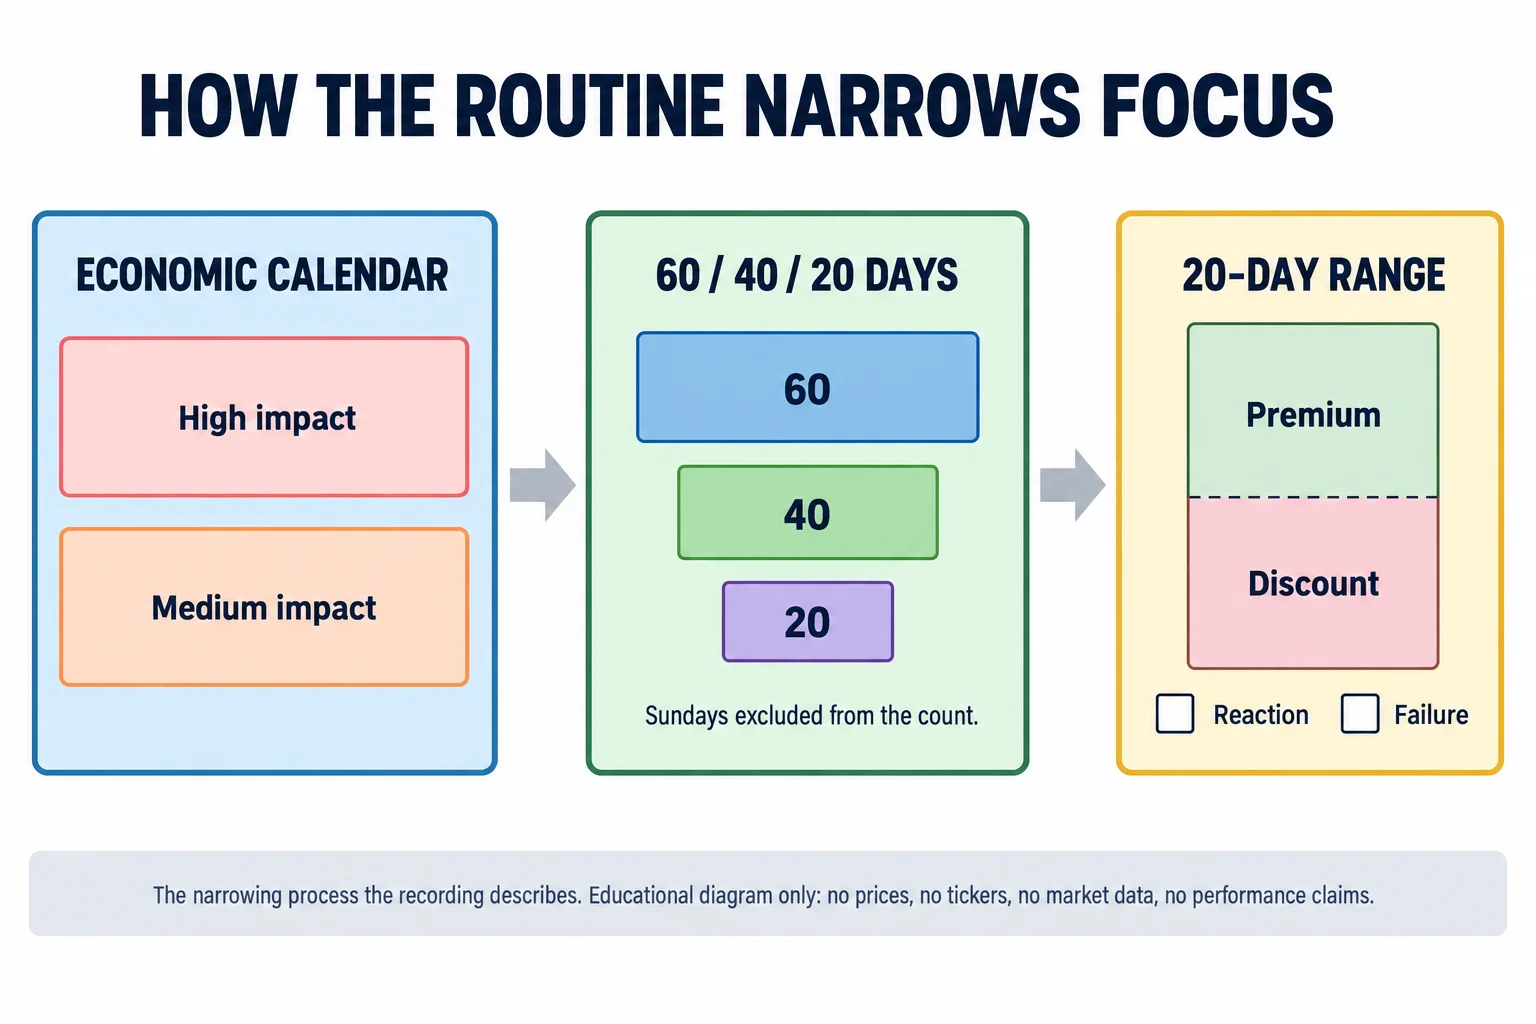
Step 3 Mark the ICT 20-Day Trade Range
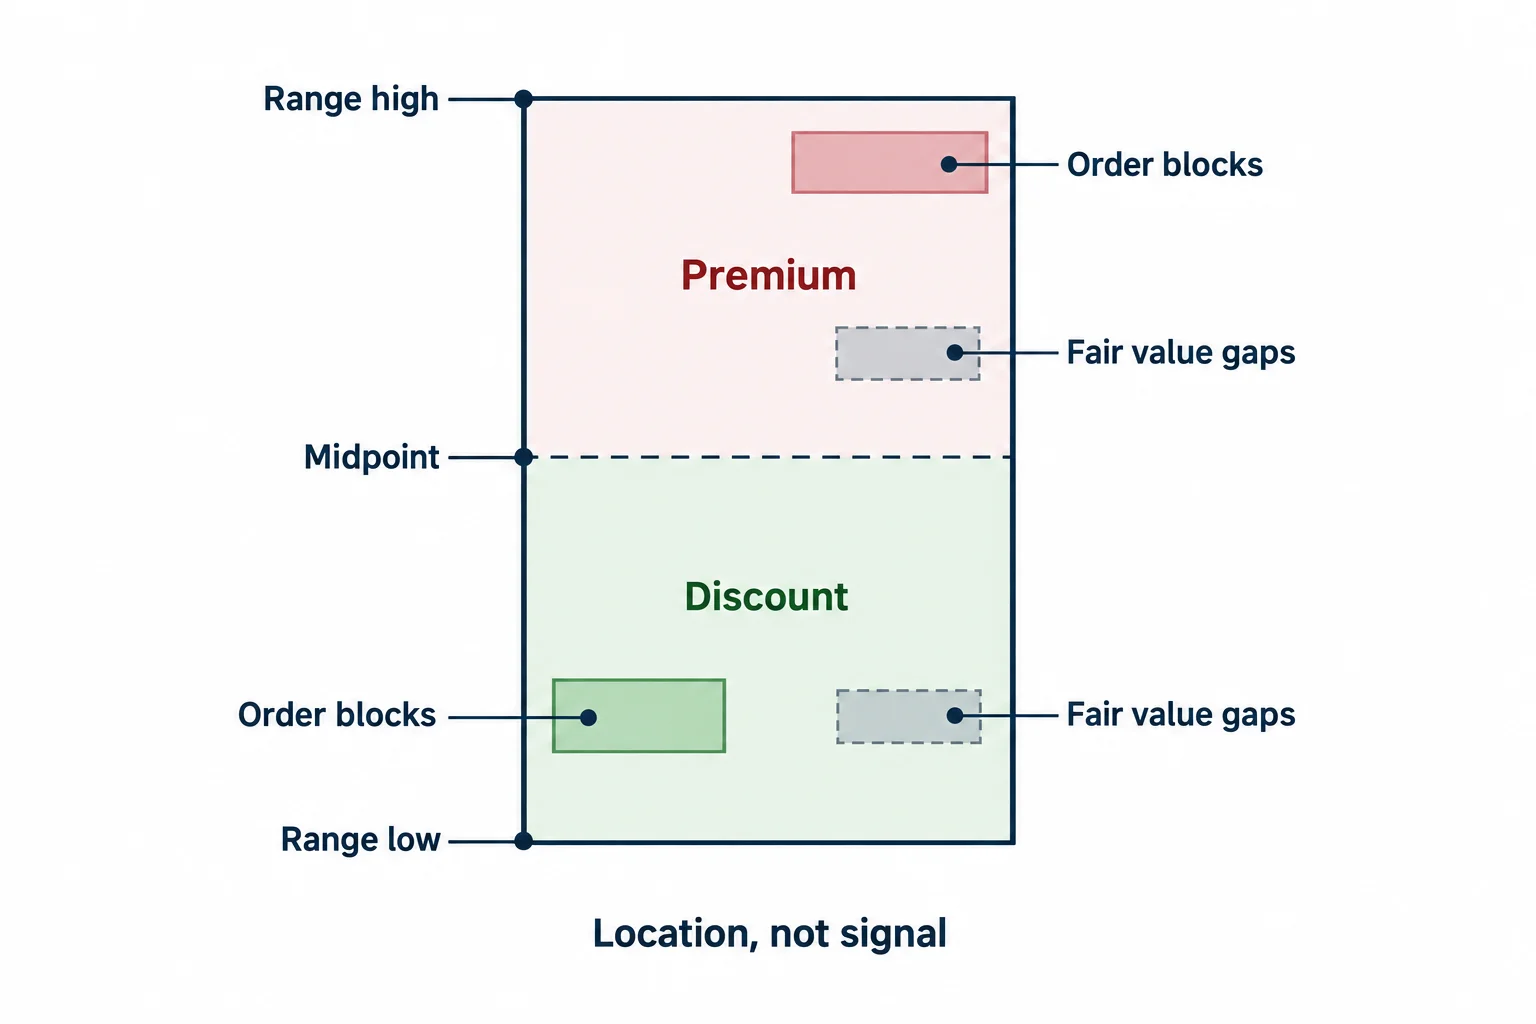
Inside the 20-day range he marks the range high and range low and then locates what he calls PD arrays. In this lesson the list he works through includes bearish and bullish order blocks (9:40, 14:28), breakers (9:57), fair value gaps (10:39), rejection blocks (15:50) and old highs or lows that sit inside the range (20:49).
He is careful about how the premium/discount reading is used, and this is the part of the lesson most likely to be misread. His framing question is whether price sits in the upper or lower half of the selected range (12:49). In the dollar example he concludes that price is in the discount half of the 20-day range, and then says directly that this does not mean it is a buy, because the historical reference points outside the immediate range still have to be considered (13:21, 13:27). He describes the dollar as sitting low across the 60-, 40- and 20-day ranges while still carrying a bearish tone on the daily, with the areas he has marked sitting above as potential objectives (13:55). That is his reading of that historical chart; the captions cannot confirm what price did afterwards.
Step 4 Repeat the ICT Routine on Your Trade Pair
At 17:49 he repeats the entire process on the EUR/USD daily chart: the same 60-, 40- and 20-day lookbacks, then the range and the arrays inside it (18:07). In his reading, EUR/USD sits in the premium half of its 20-day range while the broader market had already traded above an old high (18:37, 19:00). He then marks the discount-side reference areas below price, including a bullish order block and a fair value gap, plus an old high inside the same 20 days (19:14, 19:35).
The important habit he demonstrates here is arguing against his own bias. He says that when the higher-time-frame daily direction looks bullish, he makes a case for why institutions would want to push price down first (to take out sell stops and accumulate new long positions) and he looks for the reference areas that would make that plausible (23:46, 23:55). He notes this is only a possibility, not a requirement.
Step 5 Refine the ICT Trade on Lower Timeframes
From the daily he moves down to the four-hour chart (22:28, 22:32). There he looks for overlaps between the daily reference areas, the four-hour reference areas and the fair value gaps, and asks whether price is approaching a level that could restart the higher-time-frame move. He mentions that he would note a gap on the chart but not act on it while it is still far away from price (21:34).
He then repeats the process on the hourly chart (30:19). The question he keeps asking is conditional rather than directional: if price declines into a marked area, is that a place where the higher-time-frame interpretation could resume, or is it evidence that the interpretation is failing? His answer is to prepare both readings.
Step 6 Build the ICT Day Trade Execution Plan
The last stage is the 15-minute chart, where the routine turns into something observable (32:55, 33:03). The tools he lists at that level are the Central Bank Dealers Range, standard deviations projected above and below the market, the Asian range and its standard deviations, the average daily range, and the two opening prices he watches most: 00:00 GMT and midnight New York (33:12, 33:26, 40:52).
For a bullish reading his described pattern is that price opens and trades down a small amount from the opening price (a move below 00:00 GMT or midnight New York on the 15-minute chart) and then reacts at a discount area that lines up with the higher-time-frame work (33:57, 34:08, 34:13). He says he expects that behaviour for the London session, and that if London delivers he would look for continuation into New York, while noting that a New York rally into marked resistance could equally produce a reversal instead (34:35). For a bearish reading he describes the mirror image: a rally above the opening price into a premium area, then a short setup on a 15- or 5-minute chart with expectations of range expansion downward (55:01).
He is explicit that this is a plan and not a script. He says that once a level is reached, his job is to run scenarios in his mind and build the plan, because price can do a lot of different things (34:49, 34:59).
Why the ICT Routine Avoids Trading Every Day
One of the more quotable passages comes near the end. After describing the weekly range and the higher-probability alignment (42:10), he points out that he will not always get a day to buy under bullish market conditions, because there will be days of retracement or consolidation. His line is that there is nothing wrong with that, before adding that day trading is not everyday trading and scalping is not every move (43:16). He extends the point to the 00:00 GMT open, saying that treating it as a mandatory daily target promotes over-trading (45:53), and he says that the opening price he chooses to work from is midnight New York (46:17).
He also addresses the search for a perfect rule. He describes the hypothetical trade people keep hunting for (the one that works all the time with nothing else to consider) and says flatly that those do not exist, that there is never a black-and-white scenario, and that what a trader actually has is probabilities (48:58). His stated aim is the lowest-risk and highest-probability direction rather than a guaranteed one (51:34).
ICT Day Trade Example and Key Numbers
Near the end of the walkthrough he puts the pieces together on EUR/USD. If a level he had marked gives way, he says he would expect a bounce at a lower reference area because of the buying he reads there, with a fair value gap underneath, and he describes a minimum expectation of a move down to clear stops. Beyond that he points to an old high and a gap as the next area and quotes a downside objective around the 110.20 to 110 big figure (53:49, 54:12).
Two things must be said plainly about figures like that one. First, the level is his own reading of a historical chart in the recording, not a verified market observation. Second, he immediately qualifies the arithmetic himself: he starts to call the distance to that level potential profit of over 100 pips and then corrects the wording, describing it as range rather than profit (54:21, 54:25). Nothing in the recording states whether that objective was reached, and no order ticket, position size or account result is reported for it. It should be read as an illustration of how he frames a target, not as a performance figure.
ICT Day Trade Routine Takeaways
- Choose the event, the instrument and the session before looking for a trade. The calendar narrows the field; it does not supply a direction.
- Do the higher-time-frame work on the dollar before the pair, then repeat it on the pair with the same lookbacks.
- Keep the rolling ranges honest: count yesterday as day one, skip Sunday candles, and shift all three ranges forward one session a day.
- Treat premium and discount as location, not as a signal. His own example is a discount market he declined to call a buy.
- Write both scenarios. For every reason the idea should work, give a defined condition under which it has failed.
- Respect that the routine is conditional. He says there will be days with nothing to do, and that treating every fluctuation as a setup is the trap.
ICT Day Trade Routine Checklist
- Review the medium- and high-impact calendar events for the day to be traded.
- Match each release to its currency and to the London or New York session it lands in.
- Update the rolling 60-, 40- and 20-trading-day ranges, yesterday counted as day one and Sundays skipped.
- Mark the 20-day range high and low and locate premium and discount.
- Map the reference areas (order blocks, breakers, rejection blocks, fair value gaps, old highs and lows).
- Form a tentative daily direction, then argue the opposite case against it.
- Repeat the mapping on the chosen pair.
- Refine the scenario on the four-hour and hourly charts.
- On the 15-minute chart, define the opening price, the range tools and the conditions for reaction, failure and no trade.
- Observe what price actually does and use the difference to review the analysis, including when the idea was wrong.
This checklist is an educational summary of the process ICT describes in the recording. It is not investment advice, and nothing in the recording establishes the routine’s profitability or its ability to predict future market behaviour.
ICT Day Trade Caption Notes
The transcript used for this article is the automatic YouTube caption track, which mishears some of the lesson’s terminology. It renders “IPDA data ranges” as “if the data ranges” and, once, as “ipta”; it writes “zero GMT” as “zero DMT” in one place; it turns a bullish order block into a “bullet order block”; it renders “float” as “flout” and once expands the Central Bank Dealers Range as “Central Bank daily trains” before naming it correctly later in the recording. It also splits spoken numbers, so the date of the last trading day in the example appears as “Friday May 20. 6 2017” for Friday, 26 May 2017, and the 110.20 objective appears with a space in it. The terms used in this article are the ones the surrounding context supports; where a phrase could not be resolved confidently it is described rather than quoted.
Watch the ICT Day Trade Routine Recording
ICT Mentorship Core Content – Month 09 – ICT Day Trade Routine
The Inner Circle Trader · published 15 October 2022 · about 58 minutes. This recording is the primary source for every timestamp link above.
The recording is not embedded here because the video owner has disabled playback on other websites. That was tested directly on 15 September 2026 from a BestProps page origin at both desktop and mobile widths: the embedded player loads, then reports “Playback on other websites has been disabled by the video owner” with no duration and no playback progress, while the video itself plays normally on YouTube. No empty or half-working player is left on this page.
The watch page was read on 15 September 2026 and is publicly listed as ICT Mentorship Core Content – Month 09 – ICT Day Trade Routine by The Inner Circle Trader, upload date 15 October 2022, listed duration 3,488 seconds (about 58 minutes, 8 seconds). The caption track used for this article runs to 3,488.8 seconds, so the transcript and the listed duration agree.
ICT Day Trade Routine Resources
These are the sources checked for this article. The regulator and investor-education pages are general material about short-term trading and about how trading systems and advisory services sold to the public should be assessed; neither one evaluates this speaker, verifies any level or reading described above, nor endorses anything said in the recording. Any ICT, smart-money or third-party indicator, script, note set, chart annotation, transcript pack or re-upload circulating outside the publishing channel’s own page is unofficial and has not been tested here.
- [1] ICT Mentorship Core Content – Month 09 – ICT Day Trade Routine The Inner Circle Trader (primary source; watch page read 15 September 2026, listed duration 3,488 seconds).
- [2] The Inner Circle Trader (official YouTube channel) (read 15 September 2026), the publishing channel for the recording used here.
- [3] CFTC (Fraud Advisory: Commodity Trading Systems Sold on the Internet) (read 15 September 2026), the regulator’s guidance on assessing systems and advisory services sold to the public. Its warning that hypothetical results are typically simulations over prices that occurred in the past is directly relevant to any objective or pip figure quoted from a historical chart.
- [4] Investor.gov (SEC) (Day Trading) (read 15 September 2026), investor education describing day trading as extremely risky and capable of producing substantial losses over a very short period.
Source: ICT, ICT Mentorship Core Content – Month 09 – ICT Day Trade Routine, The Inner Circle Trader, 15 October 2022. Automatic YouTube captions were the transcript used for this article; that track mishears several terms, as noted abov