
Key takeaways
ICT Mentorship Core Content Month 09 Bread & Butter Buy Setups teaches two bullish five-minute scalping models, offset accumulation after a sell-stop sweep below an old low and re-accumulation through a retracement into a fair-value gap, bullish order block, liquidity void or optimal trade entry while higher-time-frame institutional order flow remains bullish.
Read the full summary
ICT Mentorship Core Content Month 09 Bread & Butter Buy Setups teaches two bullish five-minute scalping models, offset accumulation after a sell-stop sweep below an old low and re-accumulation through a retracement into a fair-value gap, bullish order block, liquidity void or optimal trade entry while higher-time-frame institutional order flow remains bullish. The speaker targets 15 to 30 pips in one to two hours or less, typically about one-to-one reward to risk, with 0.5% to 1% as the risk ceiling, and claims up to 15 or more setups weekly or two to three daily across four or five currency pairs rather than every pair and session. The bullish daily model expects London to produce roughly 40% to 60% of the range before 5 a.m. New York time, a retracement or consolidation from 5 a.m. to 7 a.m., and New York continuation toward the five-day average daily range high or a higher-time-frame premium array, often followed by a high and retracement between 10 a.m. and noon, though rallies can continue to the 3 p.m. bond close. London entries favor waiting for a Judas swing lower after midnight New York rather than trading both directions, while New York continuation requires London to have confirmed long-side sponsorship and formed the daily low, followed by a post 8 twenty a.m. CME-open Judas decline into a discount array. If average daily range is reached before 10 a.m., the stated rule is to take off 80% and retain a small portion for possible expansion, which can occasionally double the average range. The method favors market orders for scalp entries and limit orders for exits, uses monthly, weekly, daily and four-hour structure for bias, and treats the cited frequency, risk, targets and narrated 30-pip example as the speaker’s untested guidelines rather than verified results or personalized advice.
How we researched this article
BestProps used document-based research from primary firm sources, checked September 24, 2026. The complete source list, scope, limitations, and commercial-state record appear near the end of this article.
In ICT Mentorship Core Content – Month 09 – Bread & Butter Buy Setups, the speaker opens by placing the lesson in the May 2017 mentorship series and naming its subject as buy setups for scalping (0:15, 0:20). He frames the goal as consistent small price movements rather than large ones (0:38). The watch page dates the upload to 13 October 2022, so this is a re-release of 2017 teaching material; the recording itself refers to the earlier mentorship series throughout.
Two Bullish ICT Buy Setup Models
He says that in a buy program, price performs one of two “price engine models” (0:49). The first is offset accumulation: the market reprices below an old low so that sell stops resting there are triggered, which he describes as inducing counterparty sellers to pair long entries with, after which price seeks a higher short-term premium array to offset positions (0:54, 1:00, 1:07).
The second is re-accumulation: the market reprices lower into a fair-value or discount array to provide what he calls smart-money discount pricing for long entries (1:18, 3:04). His reasoning is behavioural: the retracement puts pressure on traders already long, and he says many of them use too tight a stop and get squeezed out, supplying the liquidity that pairs with the long entries (1:24, 1:33). He adds that this model often unfolds after a recent sell-stop raid (3:14).
Both descriptions carry the same two conditions. He says each is seen frequently in bullish market conditions, and each applies while higher-time-frame institutional order flow is suggesting higher prices (2:34, 2:37, 3:37). He also says both unfold quickly, and that they must be anticipated at key lows or key discount arrays intraday rather than waited for (2:43, 3:44).
Realistic Targets for ICT Buy Setup Scalps
Before any session detail, he sets out what he considers realistic for this style (3:54). Trade duration is typically one to two hours or less, and he says two hours is usually the maximum rather than a target (3:58, 4:02, 4:04). The pip objective he gives is a low end of 15 pips to 30 pips on average (4:10, 4:12). Timing is done on the five-minute chart (4:17, 4:19), and he says the five-minute chart is what he will work off from that point in the series (17:54).
- Frequency he states: as many as 15 or more setups per week, about two to three per day, and generally about one per session, one in London, one in New York, one at the London close and one in Asia (4:25, 4:31, 4:36, 4:38).
- The qualification he adds: that does not mean one setup in every session on every pair; it means that across a basket of four or five pairs he expects a scalp to be setting up somewhere in one of those sessions (4:45, 4:47, 4:52).
- Reward to risk in his words: typically one to one, which he calls “not hot”, with the occasional better outcome, adding that when you think scalping you should think one to one (5:31, 5:32, 5:38).
- Risk per trade as he states it: a half percent to one percent, with one percent described as possibly a little high and 0.5% to 1% framed as the ceiling rather than a starting point (5:42, 5:44, 5:52).
These are his stated guidelines. Nothing in the recording tests them, and they are not personalised risk advice.
ICT Buy Setup Kill Zones
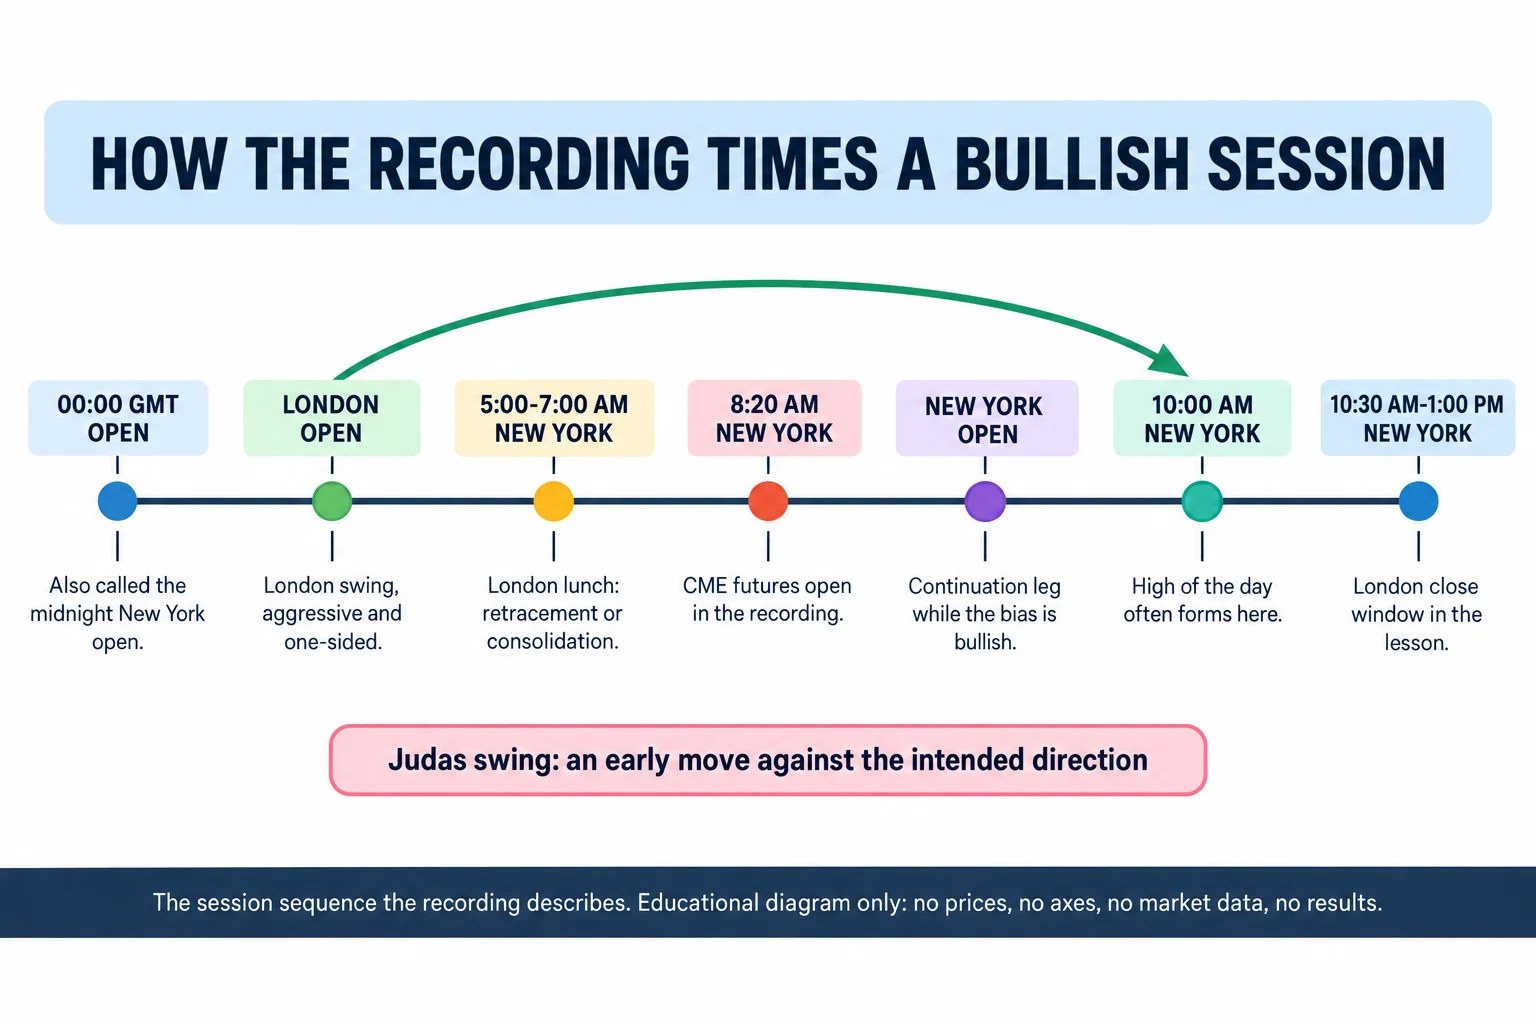
He says consistent small price movements are specific to kill zones, and that since the style is so short-term it needs the most volatile times of the day to produce a move (6:26, 6:30, 6:35). He acknowledges one exception: with limit orders an entry can execute outside a kill zone, which he says tends to happen in the London lunch between 5:00 a.m. and 7:00 a.m. New York time, or after the New York open around 10:00 a.m. and later in the afternoon (6:43, 6:49, 6:55).
His preference in that situation is to be actively following the market rather than leaving resting orders. He says to scalp with market orders and to use limit orders for exits (7:06, 7:13, 7:17). When he shows a chart of the major sessions against GMT and Eastern time, he notes that the kill zones do not line up exactly with it, and refers viewers back to the earlier lesson where he gave the specific start and end of each kill zone (7:21, 7:29, 7:33).
ICT Buy Setup Context Before Entry
At 7:44 he revisits the daily range for an up-close or bullish day. When the market is expected to trade higher based on higher-time-frame institutional order flow, he says the expectation is that the open forms at or near the low of the daily range (7:51, 7:57). He then allows for a small decline below the opening price, and clarifies that “opening price” means both the 00:00 GMT open and midnight in New York (8:03, 8:11, 8:14).
His evidence of bullish order flow is read from monthly, weekly, daily and four-hour price action: whether quarterly shifts look to go higher, whether price is trading up from daily bullish discount arrays, whether bullish order blocks are supporting price while bearish ones break away, and whether liquidity voids or fair-value gaps are being filled and then rallied from (8:19, 8:24, 8:29, 8:45, 8:50). He says plainly that you do not need trend lines or moving averages to read it, and that the evidence is up-close candles being broken while down-closed candles keep finding support (8:55, 9:00, 9:04). He repeats the same test in the negative: old highs breaking while lows are not, or lows breaking quickly and price snapping higher, which he reads as re-accumulation (9:50, 9:52, 10:00).
He describes the workflow as two required elements: a consensus on whether the market is bullish or bearish, and an entry point, with a premium area above to act as the counterparty that frames the trade (9:36, 9:38, 9:41). Within that premise he says the entry on the five-minute chart is a retracement into a fair-value gap, a bullish order block, a liquidity void, or what he calls an optimal trade entry, and he notes that the ideal version of the re-accumulation model is typically that optimal trade entry (6:21, 19:01, 19:03, 19:06).
How ICT Buy Setups Track the Daily Range
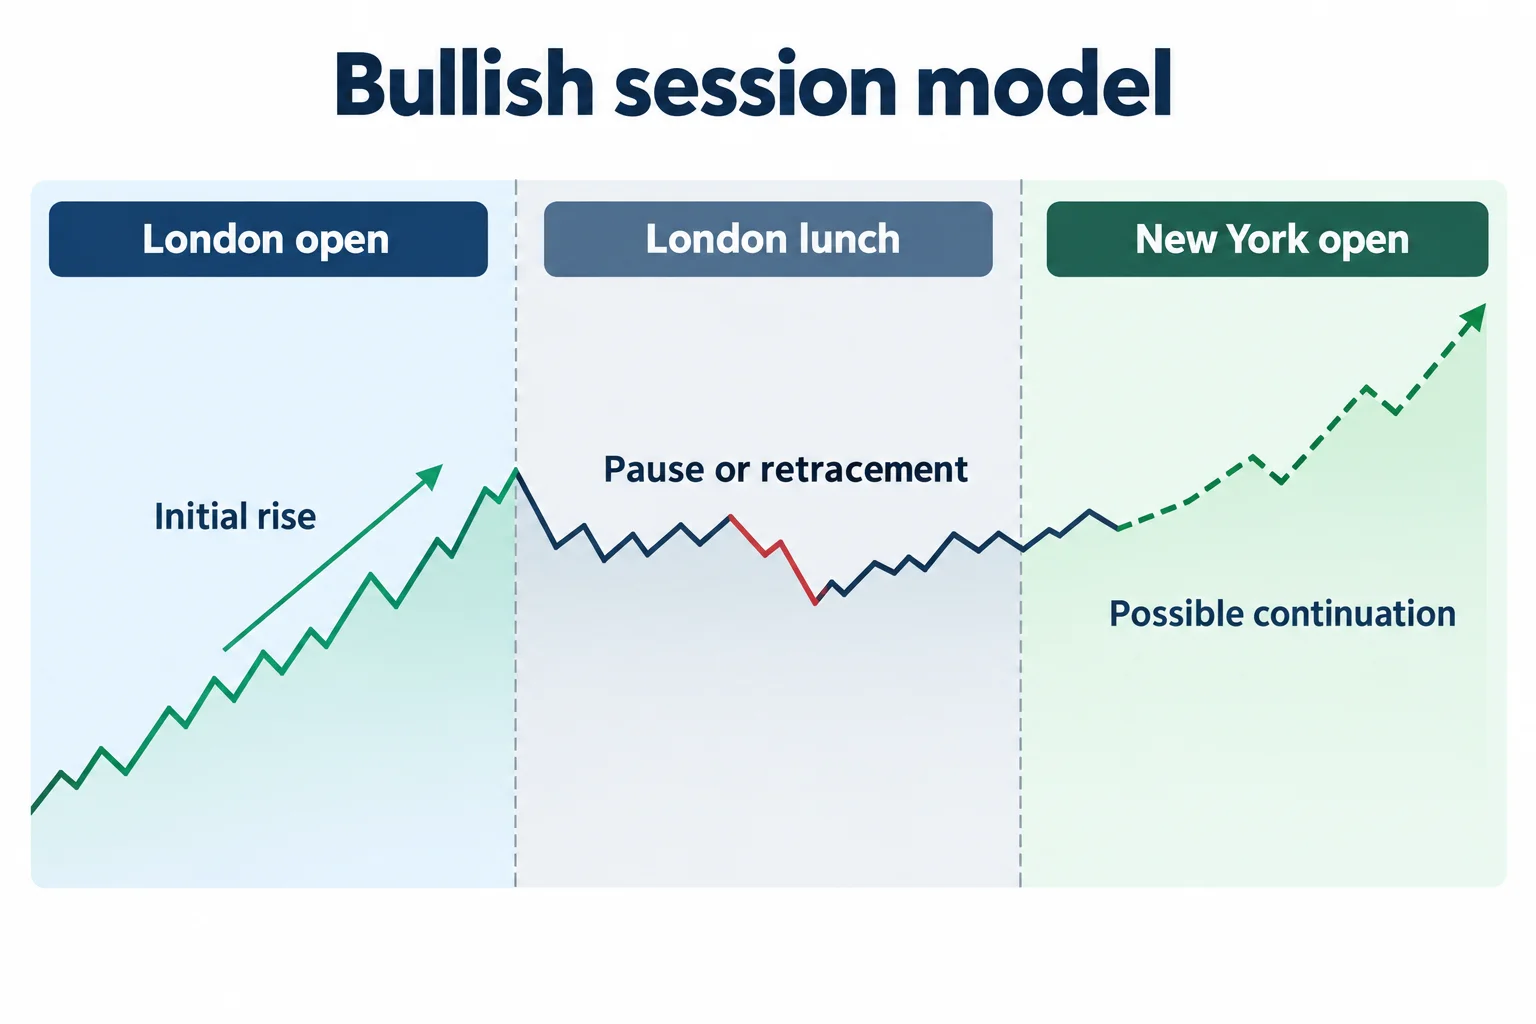
His session model for a bullish day runs in sequence. The London open posts the initial leg higher intraday and then waits for New York; he describes that London open swing as volatile, aggressive and one-sided, doing roughly 40 to 60 percent of the daily range before 5:00 a.m. New York time (10:13, 10:16, 10:21, 10:28). Between 5:00 a.m. and 7:00 a.m. New York (the London lunch), he expects some measure of retracement or consolidation (10:36, 10:38, 10:41).
He then has New York open continuing higher when the bias is bullish, usually expanding up to 10:00 a.m. New York time, where he says price tends to consolidate, create the high of the day and retrace, while adding that it could equally be a complete reversal (10:46, 10:49, 10:52, 11:01). He expects price to trade up into the five-day average daily range high, and he mentions that the indicator for this would be attached to the forum but held back until the sell-setup lesson so that its instructions come together (11:17, 11:19, 11:24, 11:28). The high of the day then forms between 10:00 a.m. and noon New York time, at or above that projected high, and price normally retraces lower to close off the high (11:42, 11:50, 11:55, 12:04).
He immediately qualifies that sequence twice. He notes that “normally” is not a precise or rigorous statement and is not a panacea, and he says the market can go a lot higher than the model implies, that neither 10:00, 11:00, noon nor 1:00 p.m. is a barrier to price, which can rally as far as the 3:00 p.m. bond close (12:08, 12:13, 12:36, 12:54, 13:01).
The London ICT Buy Setup
With a bullish higher-time-frame premise, he says he anticipates the London session low of the day forming (13:07, 13:14, 13:18). The 00:00 GMT or midnight New York open can see a protraction phase lower, and he says this can be scalped from the open or just above it prior to 1:00 a.m. New York, but only with strong conviction about the discount array (13:23, 13:26, 13:30, 13:32).
He explicitly teaches against that double-sided approach. He says he tells people not to try it, that the more appropriate approach is to wait for the Judas swing and then buy the decline, and that although he came up through the market using both sides, he gravitated away from it toward specifically looking for the Judas swing down on days he expects to be bullish, trying to nail the low rather than to capture both directions (14:02, 14:06, 14:08, 14:27, 14:31).
He says the classic London Judas swing lower is easier to scalp when timed off the midnight candle in New York, and that the 00:00 GMT open can be trickier because a tight Asian range may not produce a usable move (14:41, 14:44, 14:47, 14:57, 15:00). He also allows for the retracement between 5:00 a.m. and 7:00 a.m. New York time to provide a long scalp entry once a discount array is reached, noting that when markets are busy the retracement can arrive inside the London lunch and move before the New York open (15:03, 15:06, 15:08, 15:50, 15:55).
His general rule for that window is to treat 5:00 a.m. to 7:00 a.m. New York as a quiet period and not look for setups there, unless the London session was quiet early and became active after 3:00 or 4:00 a.m., in which case some activity can bleed past 5:00 a.m. (16:45, 16:47, 16:49, 16:55, 17:01). He then addresses the case where the initial Judas entry has already passed and a trader is afraid to chase: he says there are still opportunities if the five-minute chart is used with a scalping technique, and that he held this material back until the series reached a context where the five-minute chart could be introduced (17:03, 17:24, 17:28, 17:30, 17:34).
The chart example at 18:00 is described aloud rather than shown to the viewer in the caption track: he narrates price trading back down into a fair-value gap for re-accumulation, filling the gap at the London open, then trading up with the average daily range hit at the London open, calling it a 30-pip scalp that went a little further than that. Those figures are his spoken description of an illustration. Captions alone do not establish the chart’s prices, a fill, or a realised result, so the 30 pips should be read as his stated example, not a verified outcome.
The New York ICT Buy Continuation Setup
For New York, he first requires context: London opened and confirmed institutional sponsorship on the long side and posted the daily low (18:26, 18:28, 18:30, 18:32). With that in place he expects the New York open to continue higher unless a higher-time-frame premium array has already been hit intraday or the average daily range has been reached (18:35, 18:37, 18:40).
His sequence is then: price moves higher, begins to retrace, and the long is taken inside the New York kill zone at a discount array (a bullish order block, a fair-value gap or a liquidity void), which he frames as an optimal trade entry (18:45, 18:48, 18:52, 18:55, 18:58, 19:01).
- The 8:20 a.m. reference: he uses 8:20 a.m. New York time because that is when CME futures contracts begin trading, and he expects the New York Judas swing to fade after it (19:09, 19:12, 19:14, 19:18, 19:21).
- Targets: the five-day average daily range high and the next higher-time-frame premium array, found on a four-hour or 60-minute basis (19:23, 19:25, 19:27, 19:30).
- If the average daily range is reached before 10:00 a.m.: he says to take 80 percent off the position and leave a small portion on to capture possible range expansion, because he says the average daily range can occasionally be doubled (19:33, 19:35, 19:39, 19:58, 20:04, 20:08, 20:10).
The New York example he narrates at 20:14 repeats the London shape: price comes down, fills a fair-value gap and trades into an order block, and the line marking the CME open is where it drops afterwards, which he calls the Judas swing for that session (20:21, 20:23, 20:26, 20:28, 20:31). He generalises it into a rule of session reference points: if bullish in New York, the 8:20 open and a Judas swing dropping after it; if bullish in London, the midnight New York candle and price trading lower after it; and in Asia, the 00:00 GMT open, where he wants to see price trade down just below a previous late-session swing low (20:44, 20:46, 20:49, 20:55, 20:58, 21:05, 21:07, 21:09, 21:13, 21:16).
ICT Buy Setups for London Close and Asia
He frames the London close as the opposite construction. For a bullish day the rally happens after 10:00 a.m. New York, and that move is the Judas swing that creates the high of the day, which a London close trader would then look to sell (21:19, 21:22, 21:28, 21:31, 21:37, 21:41, 21:45). He notes he taught this material much earlier, around 2010, and that much of it came from his own S&P trading rules for the morning and afternoon trends (21:54, 21:57, 22:00, 22:04, 22:06, 22:08, 22:18, 22:27).
His conditions for the London close setup are specific: both the New York and London sessions have moved in tandem, the five-day average daily range high has been reached, and it is at least 10:30 a.m. New York time (23:03, 23:06, 23:08, 23:09, 23:11, 23:14). He then expects a retracement off the day’s high between 10:30 a.m. and 1:00 p.m., with price ideally exceeding the five-day average daily range high so that the range is genuinely stretched (23:19, 23:21, 23:25, 23:28, 23:30, 23:35).
The mechanics he gives are a five-minute failure swing at the high and a bearish order block to enter on, waiting for price to create a high, back off, and rally once more into the last up candle inside the 10:30 a.m. to 1:00 p.m. window (23:41, 23:44, 23:46, 23:48, 23:51, 23:52, 23:55). Risk is placed 10 pips above the day’s high, targeting 20 to 30 percent of the total daily range in a retracement lower (23:58, 24:00, 24:01, 24:03).
He is candid that this setup is his least favoured. He says it can be very difficult to see pan out because the range can expand far beyond the average daily range high, that the average daily range is a calculation of recent expansion and not a barrier or force field, and that he no longer trades the London close because it fell out of favour with him (either not enough pips or repeated stop-outs), and he teaches it here only for completeness (24:08, 24:10, 24:17, 24:20, 24:22, 24:27, 25:02, 25:04, 25:13).
For that trade he asks for one-to-one reward to risk based on the required stop, and says to aim for no more than 20 pips (typically 15 to 20) rather than reaching for a larger single-shot target (25:22, 25:25, 25:29, 25:32, 25:42, 25:46). In the chart example at 25:49 he notes that price went a little lower than expected and that a stop one or two pips below would have been knocked out. He then describes marking the 20 and 30 percent levels on a Fibonacci (labelled as the London close objective) anchored from the daily or London low up to the five-day average daily range high, and says the retracement typically reaches into the band between those two lines (25:58, 26:02, 26:10, 26:16, 26:22, 26:24, 26:26, 26:30, 26:39, 26:51, 26:56, 27:03).
On Asia, he says a bullish trader can enter long at or just under the 00:00 GMT opening price and expect an expansion of 15 to 20 pips as the Asian range is established (27:23, 27:29, 27:31, 27:36, 27:37, 27:39). He states that the trade has proven profitable in the past and immediately adds that nothing is promised and that past results are not indicative of future outcomes (27:46, 27:49, 27:51, 27:53, 27:55). He describes the Asian session as traditionally narrow, placing it with the London close as the two smallest windows of opportunity, and says that in his opinion neither pays enough for the risk, though he includes them for completeness and suggests observing and crunching the numbers instead (27:44, 28:25, 28:27, 28:29, 28:32, 28:34).
He points out what he sees as an internal conflict in scalping Asia: a bullish day trader wants expansion while also wanting the Asian range to be small, so demanding payment from a range he expects to be tight works against itself (28:42, 28:46, 28:48, 28:50, 28:51, 29:06, 29:08, 29:14, 29:17). He then says where his real attention goes: if the focus is more moves for the study time, look at the New York and London sessions, and in Asia take full exits rather than leaving portions on, because expecting a second leg there is not optimal (28:39, 28:40, 28:42, 30:08, 30:11, 30:15, 30:17, 30:20).
He adds that he does trade London close and Asia in the specific case where he expects a reversal profile, or where price is hovering above a higher-time-frame discount array it failed to reach in New York. In that case he would look for the Asian open to facili