
Key takeaways
This is lesson six of the April 2017 ICT mentorship, on the London session, and it is a lesson about when not to trade rather than how to enter.
Read the full summary
This is lesson six of the April 2017 ICT mentorship, on the London session, and it is a lesson about when not to trade rather than how to enter. He lists six conditions that put him on the sidelines: a prior day whose range was more than twice its five-day average daily range (1:23), three consecutive daily closes in the same direction that rule out chasing that same direction in London (2:08), an FOMC release that produced extreme two-way whipsaw (3:37), the Friday when non-farm payroll figures are expected (4:57), the session heading into a long weekend or holiday (5:07), and a calendar showing several medium or high impact releases for the currencies involved (6:26). He then adds the two overnight ranges he watches, the Central Bank Dealers Range and the Asian range, and says he wants both to sit in a small, tight, visually obvious consolidation; a wide, erratic or trending range makes London suspect to him (11:40). The lesson contains no charts by design (0:29), he states plainly that he does not know what the banks are doing under those conditions (18:19), and he frames the whole thing as his own rule set rather than a demonstrated edge. Nothing in the recording supplies fills, costs or outcome data, and no part of it is trading advice.
How we researched this article
BestProps used document-based research from primary firm sources, checked September 24, 2026. The complete source list, scope, limitations, and commercial-state record appear near the end of this article.
A lesson built to keep you out of the market
In ICT Mentorship Core Content – Month 08 – When To Avoid The London Session, the speaker opens by identifying the material as lesson six of the April 2017 mentorship and describing the month as his day-trading model (0:12). He then says the lesson will be deliberately free of charts and examples, because he wants the characteristics themselves to be considered rather than questioned line by line on a price chart (0:32).
The organising idea is stated near the end rather than the beginning: the best rules, in his framing, are the ones that keep a trader out of the market, and while bookshops are full of reasons to be a buyer or a seller, very little is written about knowing when to stand aside (31:26). He also claims the filters apply regardless of trading style — position, swing, one-shot, day trade or the scalping approach he says is coming next month (31:39). Those are his assertions about his own framework, not findings this article verified.
The six avoidance conditions he lists
Each condition is given as something he looks for before deciding whether to participate in London at all. He presents them as specific rather than ambiguous (1:10) and ties several of them to the same session, which is the day before the day being traded.
A prior day larger than twice its five-day average range
He says London is typically not ideal after a large range day that was greater than two times the five-day average daily range (1:23). The measurement he describes is the average daily range of the pair, compared against the range of the prior trading day, and he specifies that the comparison is made as the average stood on the day the large range occurred (1:45). His stated expectation for the day after is consolidation or choppy trade (2:00).
He treats this condition as linked to the FOMC one below, since an extreme whipsaw can itself be the event that produces the outsized range (3:45). The transcript gives the threshold and the reasoning but no worked example, no instrument and no historical validation.
Three consecutive daily closes in the same direction
After three consecutive up closes on a daily chart he avoids London longs, expecting either a pause or a retracement lower that can be deep enough to print a down close or a long intraday wick before price may resume (2:08). The mirror is given for three consecutive down closes, where he avoids London shorts and says the fourth trading day in a row is where a deep retracement or sideways trade tends to catch traders (2:40).
Two qualifications sit in the transcript. He states both conditions are relative to the daily timeframe, not an intraday chart (3:10), and he says a large range day on that fourth day is highly unlikely — while conceding it is not impossible (3:30). This is an avoidance rule about chasing the same direction, not an instruction to take the opposite side.
An FOMC release that produced extreme whipsaw
He asks for the market’s reaction rather than the decision itself: whether rates were changed or by how much does not interest him, only whether the event produced an extreme move both up and down (4:01). He notes that the release generally arrives at two o’clock in the afternoon, New York time, and that the resulting whipsaw is what disrupts the overnight ranges he wants to evaluate (4:23), possibly rolling into the Asian session as well (4:35). His conclusion is to avoid the London open after whipsaw of that kind (4:38).
Non-farm payroll Friday
Ahead of non-farm payroll numbers he says he does not trade the London session at all on that Friday (4:57). He identifies the release as generally landing on the first Friday of the trading month, and says so as a tendency rather than a guarantee (4:50). The employment figures are published by the U.S. Bureau of Labor Statistics; the release schedule is listed in the resources below.
The session before a holiday or long weekend
The same treatment is applied to the session heading into a long weekend or holiday, on the argument that participants leave early and capital sits on the sidelines, making a quiet session likely and the risk not worth carrying (5:07). He calls this one a hit-and-miss rule and openly acknowledges that a short holiday session can still travel, describing an example of roughly 300 pips into a holiday (5:28).
What follows is his justification for keeping the rule anyway: he says the discipline is to trade in a world of probabilities and statistical edge, that the normal case for the day before a holiday — usually a Friday, sometimes a Thursday — is a quiet London session (5:37). The word “statistical edge” is his, and the transcript attaches no measurements to it.
Several medium or high impact releases due
He recommends reading an economic calendar — naming Forex Factory and any other reputable calendar, and noting that a calendar can be used to see what is scheduled across each session for each major pair (6:05). Where several medium or high impact events stack up for a given currency, he describes the London session as potentially tricky (6:26), illustrating it with events bunched at two, three and five o’clock in the morning (6:44).
His stated preference is the opposite setup: one high or medium impact event, which in his model gives a single stage of manipulation before the expansion into New York (7:18). He also warns that an empty calendar is its own risk, describing a snap election announcement from the UK prime minister that arrived on the heels of a holiday break, moved cable sharply and was not on the London calendar beforehand (7:47). His figure for that day is a 400-pip move in one trading day in the British pound against the dollar (7:57); that is the speaker recalling a market event, and this article has not independently reconstructed the session or its prices.
The two overnight ranges he watches
The second group of filters concerns the Central Bank Dealers Range and the Asian range, both of which complete before London opens. On the first, he says a Central Bank Dealers Range wider than 50 pips already has him inclined to pass on the London session (8:39) — and he describes the practical consequence in personal terms, saying that if he has family plans the next day he will simply skip the session rather than wake at midnight to assess it (8:48). If nothing is planned, he says he still wakes around midnight to check what the Asian range did (9:20).
On the second, an Asian range wider than 40 pips moves him to consider what he calls the delayed protraction profile, but only if every criterion from the preceding lesson is met; otherwise he stands aside (9:29). Separately, a sustained rally or decline beginning around 8 p.m. New York is, in his reading, a poor indication for London, because it suggests the real move has already started and may continue with little retracement until New York (9:45). He locates that starting point at the beginning of 00:00 GMT, which he equates with 8 p.m. New York time (13:01).
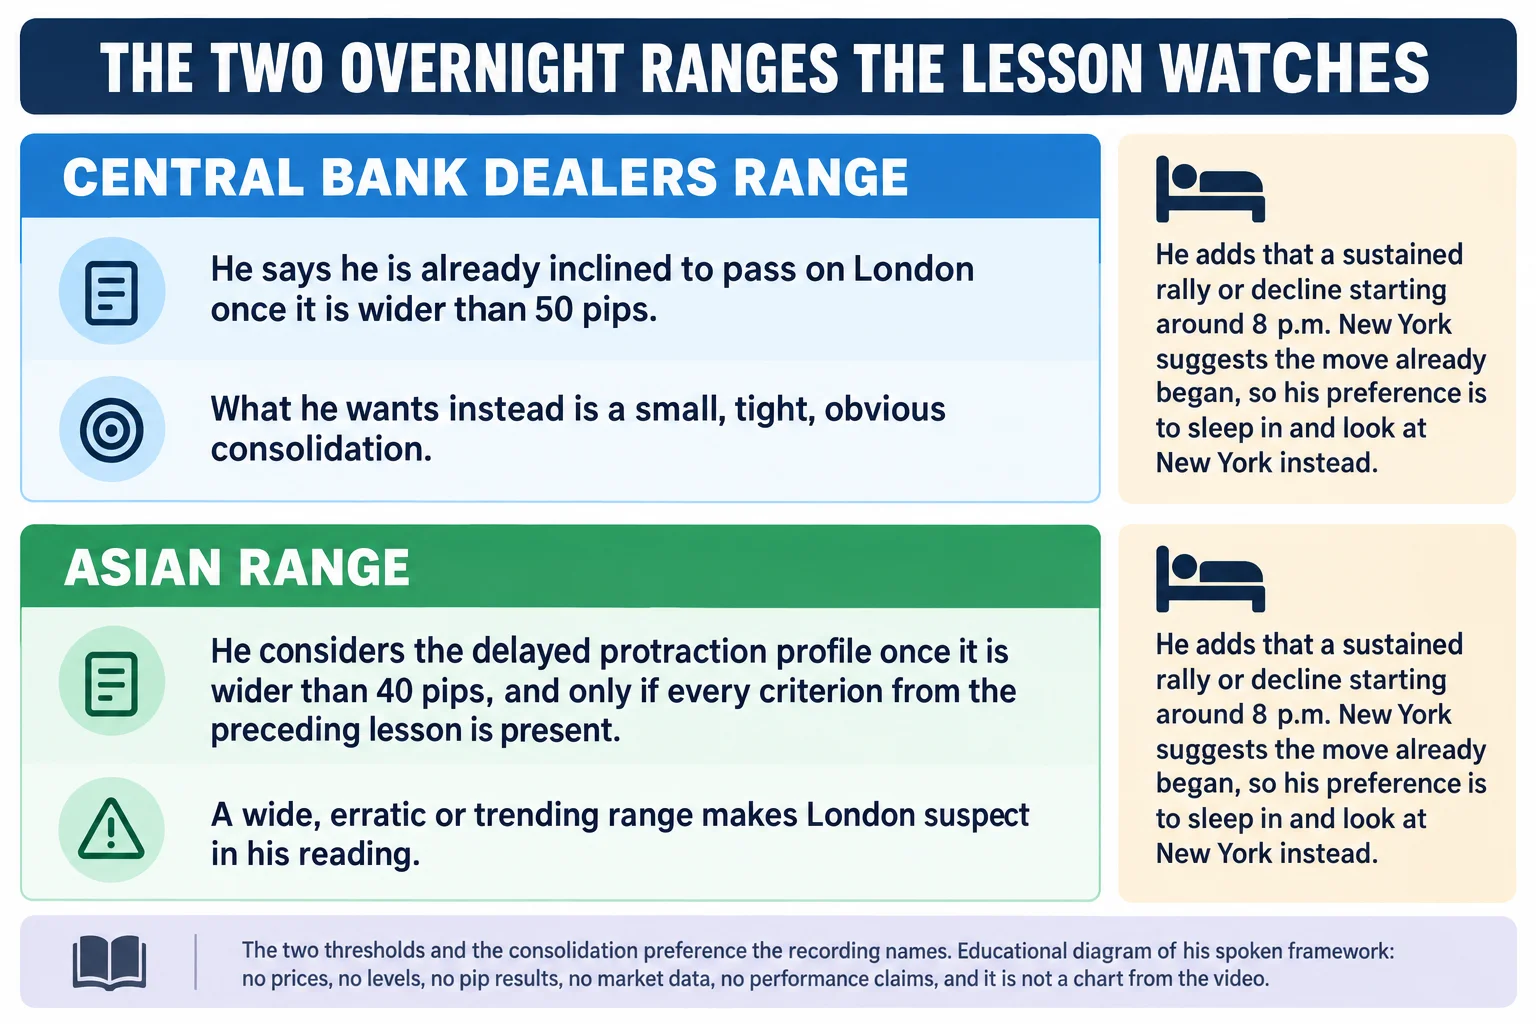
What he wants instead of a wide range is visible consolidation. He says the Central Bank Dealers Range and the Asian range must trade down into a small, tight range, and that if either is wide, erratic or trending, London is highly suspect and he does not want to trade those conditions (11:00). He adds a practical instruction that the judgement should be obvious on a 15-minute chart, where he says a genuine consolidation shows as a distinct, narrow range against the previous days (11:27). When the ranges instead trend, he expects an ugly London session without a clear manipulation cycle or protractionary state (12:43), and he gives the response that the lesson is remembered for: sleep in and trade New York (13:20).
His explanation of why a narrow range matters is an interpretation of market behaviour, and it is worth quoting as such rather than restating it as fact. He describes banks holding the market in a tight consolidation between the Asian range open and its close at midnight so that orders can build above and below the range, and says traders never need to know what those orders are or how large they are, only that the narrow range indicates them (12:09). He then develops the intraday cycle he trades from: with a directional bias read from the daily and four-hour charts through what he calls the PD array matrix, a bullish bias lets him anticipate a manipulation leg lower that induces selling and knocks out premature longs before the accumulated positions are distributed near the low of the day, with the high typically at the London close or late New York (15:25).
There is no order-book or positioning evidence in the recording for any of this, and he does not claim to have any. Later in the lesson he says outright that when these conditions are present he does not know what the central banks are doing, and that not knowing is precisely why he will not put money at risk (18:19). The distinction between the two passes matters: one is a description of market behaviour he offers as a model, the other is his admission that the model is not something he can confirm in the moment.
What he considers a qualifying London session
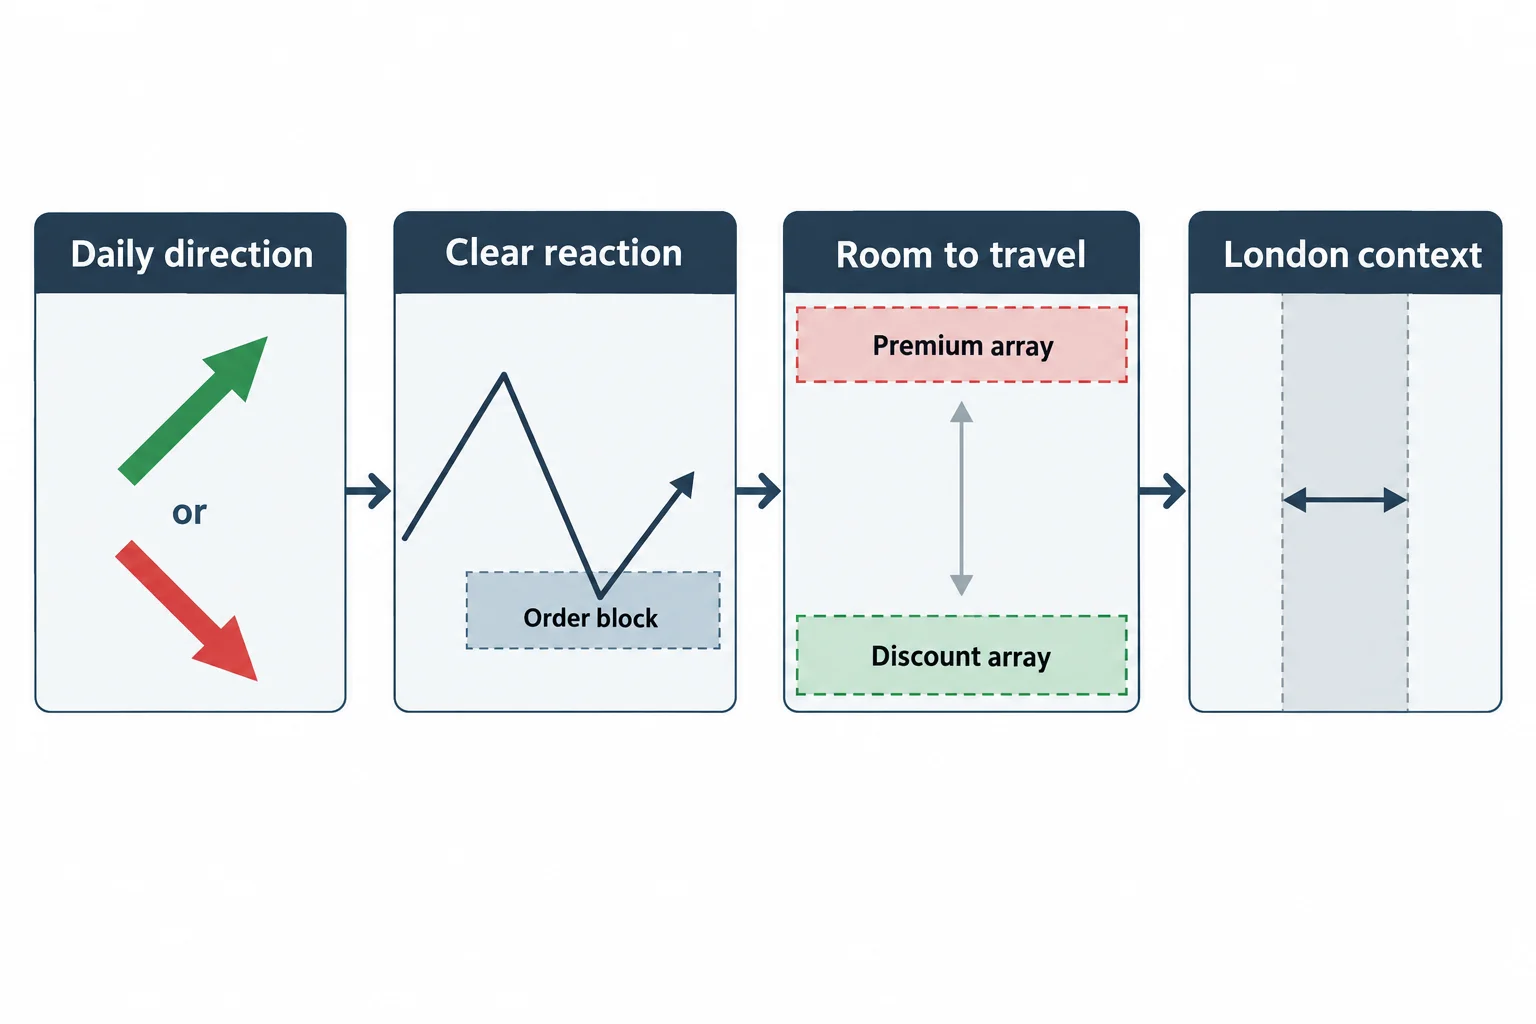
From roughly twenty minutes in, he turns the lesson around and asks what an ideal London kill zone looks like, which he answers with the daily chart and the PD array matrix. The preconditions are that the daily chart is clearly respecting unambiguous areas — an order block, a gap being closed — and responding as expected (20:44), and that there is a discernible direction on the daily chart (21:18).
With that in place he describes two mirror scenarios. If the daily chart is poised to trade higher into a premium array, London longs are his ideal entry, and the distance from market price to the next premium array is his indication of how much movement to anticipate — while noting it may take several days rather than one, and that a remaining range can set up another London trade the following day (21:29). If price has recently traded from a premium array and is reaching down into a discount array — a bullish order block, a fair value gap below market price, a liquidity void or a run below an old low — then London shorts are his ideal, and he describes that as reaching for a low-resistance liquidity run into the discount (22:36).
Both scenarios are explicitly subordinate to the avoidance list. He says the earlier conditions have to be eliminated and cannot be present for either the long or the short setup, and that either can be cancelled out if the conditions from the previous two parts of the lesson are showing (23:10). He states this again later in stronger form: if the daily bias and the avoidance conditions disagree, the daily bias falls second because what is being traded is intraday action (19:14).
He finishes the section with the volatility condition. When the daily range has not recently exceeded its five-day average daily range, he expects an expansion day to form (23:34), and his suggestion is to keep a running log comparing the five-day average against what each day actually delivers, which is also his stated reason for not trading twenty pairs (24:00). He notes that many days fall short of the average and that quiet periods can produce less than half of it (24:12), and that a large expansion day is what he is positioning for when the prior day has not exceeded the five-day average and the avoidance conditions are absent (24:37). His stated expectation for such a day is one and a half to two times the five-day average daily range (25:15) — given as a range he has seen, not a measured statistic produced here.
Why he frames the filters as risk management
The last third of the lesson is about equity curve shape rather than setups. He argues that trading every single day produces long runs of small wins and drawdown days, that the month’s results then depend on a few large range days to show a profit, and that on a twenty-day study where you remove the largest profitable day a trader may find the month was not actually profitable (26:18). The aim he sets is a smooth equity growth line achieved by removing periods of high drawdown probability (27:25).
Two numbers appear in this discussion and both are his own reference points rather than results from this recording: an average of eight to ten percent for the month as a baseline, and a claim that catching and holding one large expansion day can add ten to fifteen points on top of it (28:01). No account statement, sample of trades or verification accompanies them, and they should be read as the speaker describing his own expectations out loud.
He also makes a factual claim about his own daily-chart calls, saying that over the previous six or seven months of the mentorship they had been almost 98 percent accurate (29:40). That is unverified self-report, it appears with no methodology and without a defined denominator, and nothing in this article should be taken as confirming it.
What the lesson does not establish
The recording is a teaching monologue with no charts, no trade records and no data. It contains no fills, no transaction costs, no slippage or gap treatment and no outcome statistics for any of the six avoidance conditions, and it does not attempt to show that filtering those days improves results. The thresholds — twice the five-day average range, 50 pips, 40 pips — are stated as rules the speaker uses, without derivation or backtest.
He is clearer about the limits than the format suggests. He says a student can be wrong even when the conditions were in his favour, that some moves will later look like they should have been taken, and that the point of the filters is only to keep the odds from being against you (17:18). He also states that when these avoidance conditions are present there is a great deal of odds in favour of losing money (16:37), and warns that if a trader takes a position anyway and it loses, the reason is now known in advance rather than discovered afterwards (16:17). He concedes too that he still has losing periods when his criteria appear favourable, and that the framework has simply kept him out of a lot of trading he would rather not have done (16:46).
A note on the caption track
This article was written from the video’s own auto-generated caption track, which is the primary source for every timestamp link above. That track mis-recognises some of the speaker’s vocabulary, and the affected terms were resolved only where the surrounding context makes the intended word clear: the Asian range appears once as “agent range” (9:29), non-farm payrolls appears as “non-farm apparel” (4:57), the PD array matrix appears as “pdra Matrix” (14:55), and his 00:00 GMT reference appears as “zero DMT” (9:55). Labels in this article are the ones the context supports; nothing was reconstructed from an unintelligible passage, and no price, fill or chart value is reported from this lesson because it contains none.
Watch the original recording
ICT Mentorship Core Content – Month 08 – When To Avoid The London Session
The Inner Circle Trader · published to YouTube on 8 October 2022 · listed as 2,073 seconds, about 34 minutes 33 seconds. The recording identifies itself as lesson six of the April 2017 mentorship. This video is the primary source for every timestamp link above.
The recording is not embedded here because the video owner has disabled playback on other websites. That was tested directly on 15 September 2026 from a BestProps page origin at both desktop and mobile widths: the embedded player loads and then reports “Playback on other websites has been disabled by the video owner”, with no playable stream in either case. The link above opens the recording on YouTube itself.
The homework he sets
He does not hand out a checklist, and says so deliberately: he wants students to write the rules out in their own handwriting so they retain them and refer to them each day (33:23). He describes the material as about a hundred rules (33:15) and expects the list to be reviewed before each session, so that when the conditions from the previous two parts of the lesson are present, the probability has already been judged to have dropped (33:36).
He closes by saying the filters require no mental acrobatics and should be checked against several months of price data on whichever pair a trader follows, and that where these conditions appear a clean London session is unlikely (29:08). His stated goal in that review is to trade when volatility is compressed and the market is held in consolidation, and to miss the rest (29:28). The final line is a warning rather than a promise: what most participant