
Key takeaways
ICT Mentorship Core Content Month 08 Projecting Daily Highs and Lows, lesson four of the April 2017 Inner Circle Trader day-trading material, measures the Central Bank Dealers Range from wick high to wick low between two p.m.
Read the full summary
ICT Mentorship Core Content Month 08 Projecting Daily Highs and Lows, lesson four of the April 2017 Inner Circle Trader day-trading material, measures the Central Bank Dealers Range from wick high to wick low between two p.m. and eight p.m. New York time, preferably 20 to 30 pips and strictly under 40 pips, with wider ranges skipped, including a 58-pip example. After the counter-directional Judas swing occurs, its realized distance is copied from the opposite side of the range in the day’s intended direction and stacked as one, two or three projections, rather than forecast beforehand or treated as a Fibonacci extension. Directional bias and PD arrays take priority, including premium and discount, bullish and bearish order blocks, fair value gaps and rejection blocks, while projections and London-close windows only identify potential overlaps of time and price and may be reached early. One walkthrough takes profit with 23 pips remaining into a fair value gap, another misses a desired level by two pips, and the speaker emphasizes precision at the low on buy days or high on sell days rather than at projected targets. The method is not for daily use, requires a directional bias, and provides no verified edge because the recording contains retrospective hand-marked examples with no fills, costs, slippage, testing or outcome statistics. The roughly 30-minute recording was published by The Inner Circle Trader on 4 October 2022 and had about 282,324 views when checked on 15 September 2026.
How we researched this article
BestProps used document-based research from primary firm sources, checked September 24, 2026. The complete source list, scope, limitations, and commercial-state record appear near the end of this article.
In ICT Mentorship Core Content – Month 08 – Projecting Daily Highs & Lows, the speaker introduces it as lesson four of the April 2017 mentorship content for the ICT day-trading model (0:12). He frames it as a continuation of the previous lesson on the Central Bank Dealers Range, where the question was how far price tends to travel from that range in standard deviations. Here the question changes slightly: instead of a generic volatility band, how much of the range does price actually travel in the counter-directional move before the day’s real move begins (1:03)?
Two things are worth fixing at the start. First, he tells the reader what this is not: not Fibonacci extensions, not projections in that sense, but a measurement of the distance price covers while it is moving against the intended direction of the day (1:17). Second, and more important for reading the rest, every term here (PD array, premium and discount, order block, Judas swing) is his own chart interpretation. The recording reports no fills, no results and no testing, and the examples are retrospective walkthroughs of charts he has already marked up. This should not be read as verified performance.
ICT Daily Range for Projecting Highs and Lows
He begins by restating the range because everything else is measured from it. It is the high-to-low interval between 2:00 p.m. and 8:00 p.m. New York time (3:04). The size matters more than it might seem: he says the range is ideally 20 to 30 pips, must be less than 40 pips for this projection process to apply (3:10), and that when it is greater than 40 pips he moves to the sidelines and does not look to trade with it in his repertoire (3:23).
He also names two ways of measuring it. The primary one he describes is the spread of the wick: the wick high to the wick low between 2:00 p.m. and 8:00 p.m. New York time (3:44), and he says he also likes to look at the candle bodies, the highest high in the form of an open or close and the lowest low in the same terms (3:52). The reason for caring is stated directly: the exercise is about pinning down where the day's high or low is likely to form (3:31).
The examples make the filter concrete. He works through several days, and one of them carries a 58-pip Central Bank Dealers Range which he leaves alone outright (“that's a NYX, we don't do anything for that particular day”), though he says he will come back and comment on it when the second example comes up (5:49). Treating a qualifying day as rare rather than typical is a feature of the method, not an aside: he returns to the same filter in the closing section, reminding the reader that applying the standard-deviation work every single day is exactly where it goes wrong (24:46).
ICT Counter-Moves for Projecting Daily Highs and Lows
The measurement he is after is the protractionary move away from the range, the Judas swing (1:32). His framing is worth quoting closely, because it is the part that separates this from a volatility band: he does not need to know beforehand, to the pip, what the extension away from the Central Bank Dealers Range is going to be; he needs to know what it is once the move has already happened (1:36). He adds a practical consequence of that: even if you get London wrong, the same information can still be used on a continuation in New York (1:51).
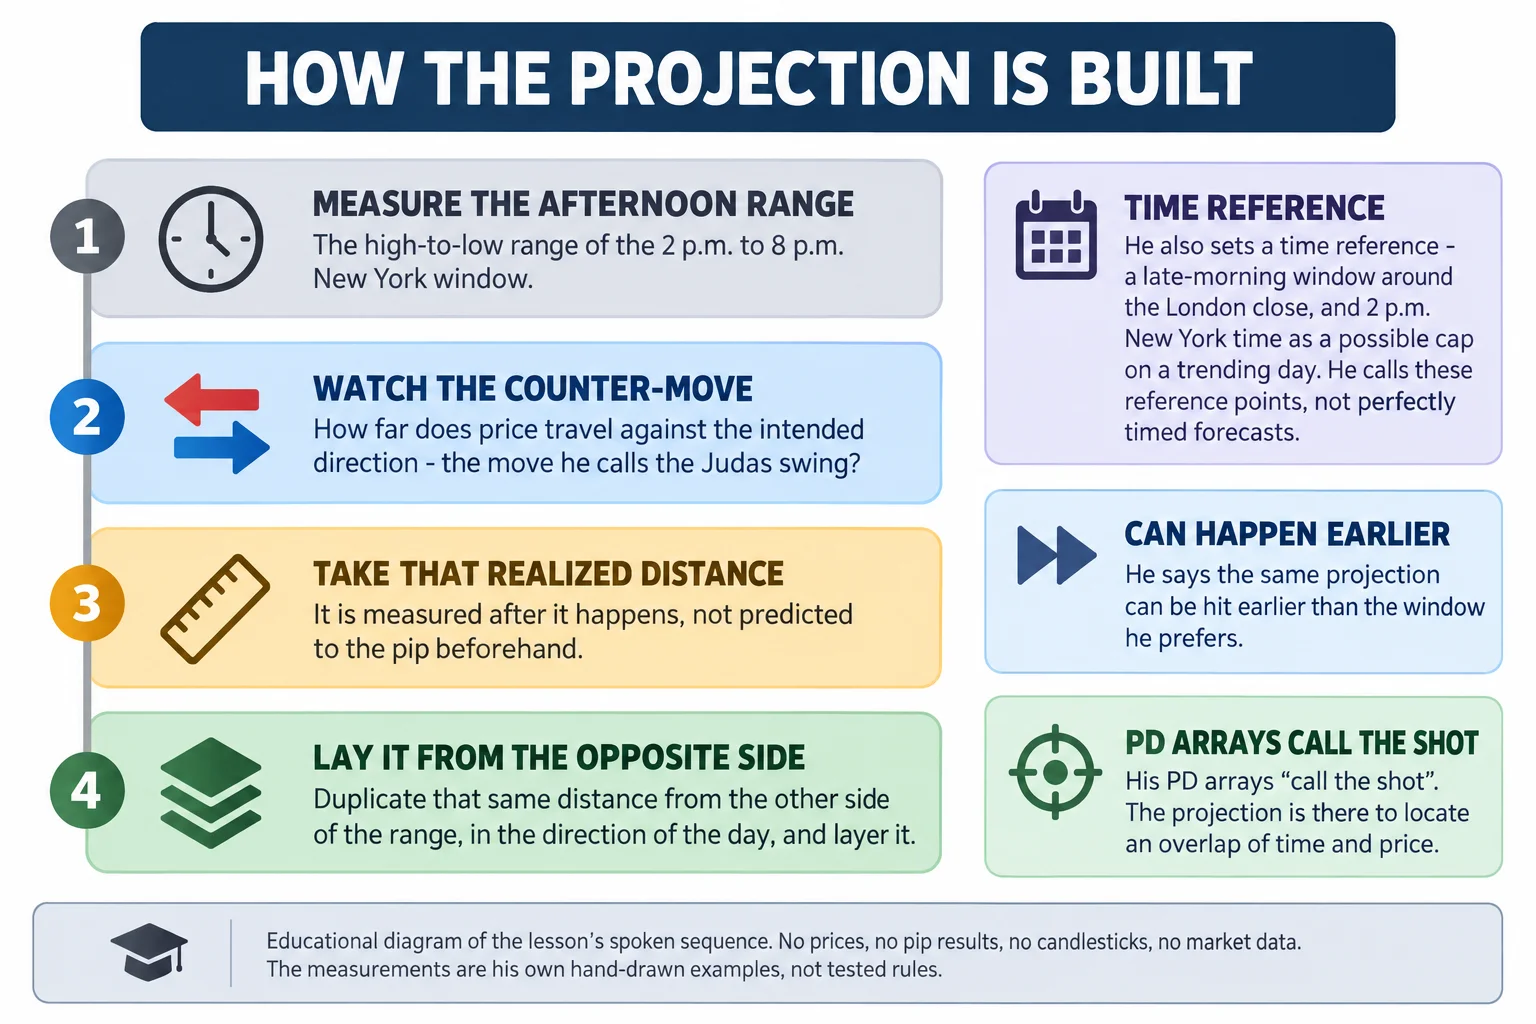
Once the counter-move has been measured, the projection is mechanical. He takes that range and lays it on the bottom of the Central Bank Dealers Range, then starts layering it down, and he notes he does all of this by hand on the chart (12:52). In the bearish walkthrough the measured move is described as roughly two standard deviations before he begins duplicating it (12:46). The bullish example does the same thing upward after a London decline into what he reads as bullish chart context (16:50), and in that one he notes the measured line misses the level he wanted by two pips before the sweep completes (16:46).
The layering is where the time element enters. He describes projecting from the low on sell days and getting one, two, three stacked copies (16:00), and in one example he works out that 23 pips of range remains to be closed into a fair value gap (18:50), which he uses to justify taking profit there rather than waiting, since he says he wants to get out early anyway (19:15).
ICT PD Arrays Before Daily High and Low Projections
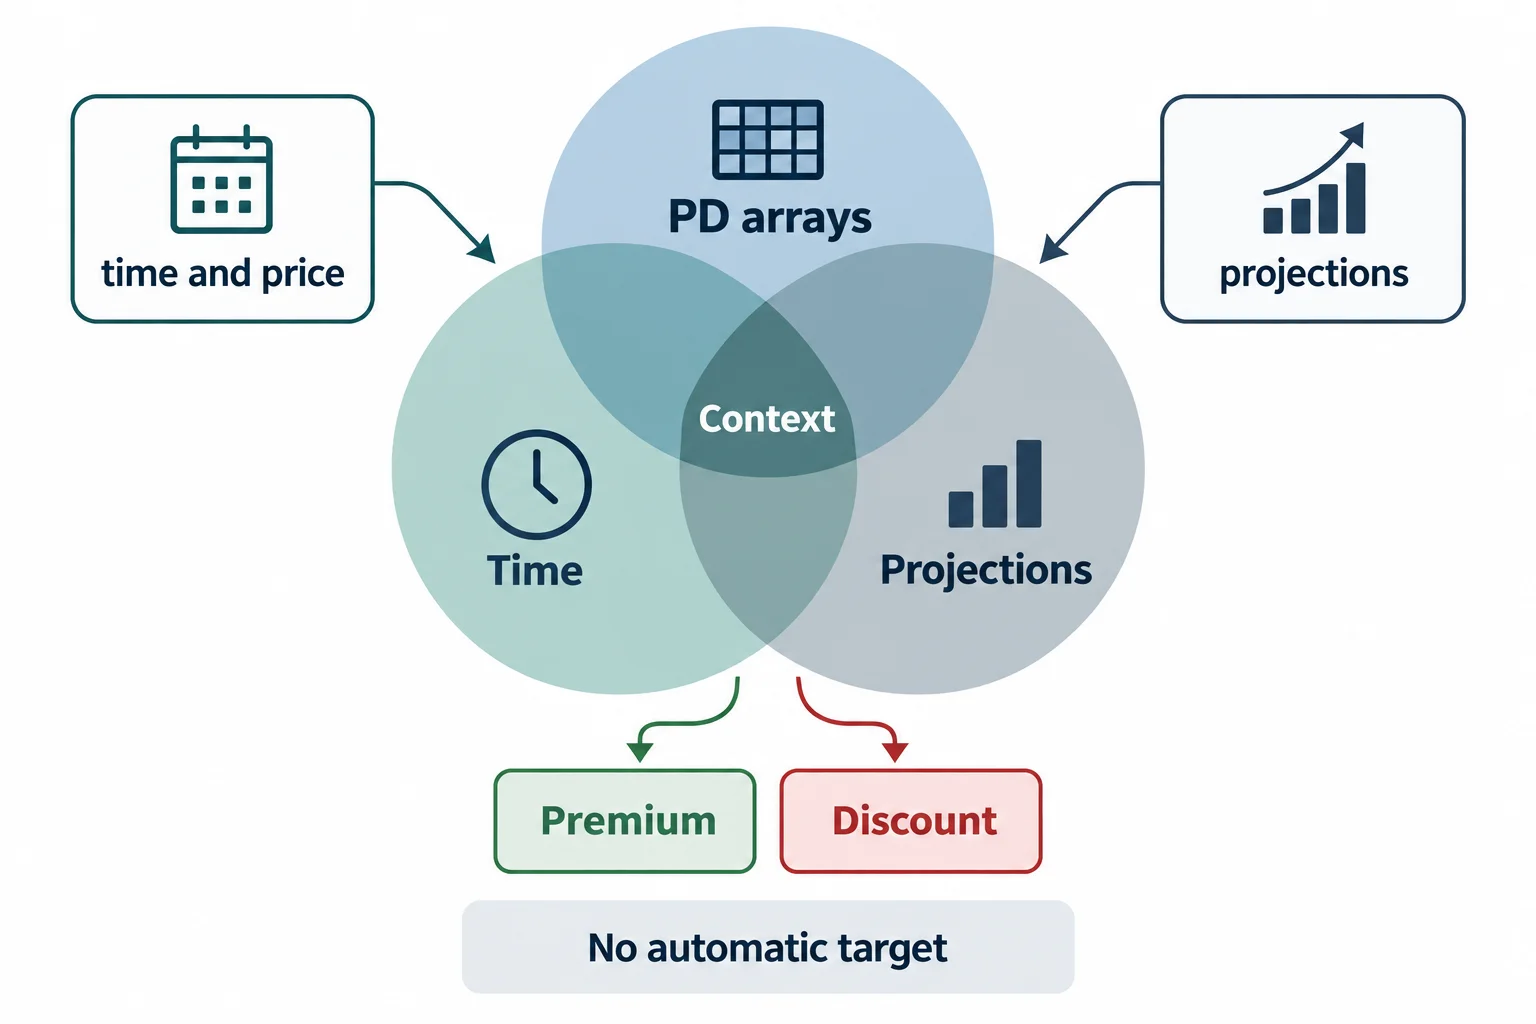
The most important qualification in the lesson is the ordering of authority. In the noon-close example, price trades up into a bearish order block and stops inside the second deviation. His comment on that is the line to keep: there may still be range permitted by the projections, but it is the PD arrays that “call the shot,” it is not the magic of the projections, which he says will lead you to an overlap of time and price rather than to a target (22:09).
He is equally clear that the method is not applied in isolation. His description of what he is actually doing is blending the PD array matrix with time and price theory: reading where price sits in premium or discount, watching it trade into the lower part of the marked range until it reaches a bullish order block (6:49). The contextual references across his examples include bullish and bearish order blocks, fair value gaps, rejection blocks and premium or discount locations, and he shows one day where price sweeps even a rejection block (the bodies of the candle) in London (16:40).
He also rejects the idea that the examples were selected after the fact to flatter the method. He tells the reader to go back and look at the material and states that none of it is cherry picking (6:43). That is his assertion about how the examples were chosen; the captions cannot independently confirm it, and the charts themselves are not reconstructable from the transcript.
ICT Timing for Projecting Daily Highs and Lows
Time is layered on top of the price measurements. He marks out a London-close window in the late morning, he identifies the candle that starts it as the middle of the London kill-zone close, then shows the projected London-close window, and finally 2:00 p.m., where the day's highest point closes (11:05). His stated use for these is as reference points rather than perfectly timed forecasts, and he acknowledges that a projected extreme can arrive earlier than the window he prefers (11:26).
The practical reading he gives the whole exercise is that the projection narrows where to look, then the time window narrows when, and the PD arrays decide whether there is a setup at all. Anyone treating the stacked copies as a sequence of automatic targets has inverted the hierarchy he describes.
ICT Limits for Projecting Daily Highs and Lows
The closing section is largely a list of conditions for not using the method, and it is worth separating from the technique itself:
- The afternoon range must be under 40 pips, preferably 20 to 30, for the projection to apply (3:13).
- A directional bias has to be present, established from where price sits in the premium or discount framework, in his worked bullish case, a move down from premium into a discount PD array and a bullish order block that was expected to bounce (25:02).
- The exercise is not to be applied every single trading day; he says that is precisely where it goes wrong (24:46).
- When the range is wider than his threshold, he says he has a harder time getting the measurements to work and steps back (29:07).
He also corrects an emphasis that could easily be misread: the precision he cares about is on the entry side (the low on buy days and the high on sell days), which he calls the standard-deviations tactic, rather than in the projections themselves (24:36). And his framing of what the filter buys him is about selection, not certainty: going through the rules tells him whether there is or is not a high-probability setup on a given day depending on where the range sits, rather than forcing a trade every day (28:57).
What the recording does not supply is equally important. There are no fills, no entry or exit prices beyond the ones he reads off his own marked-up charts, no costs, no slippage and no outcome statistics. The examples are retrospective explanations of charts he had already annotated, so the method arrives with an unquantified edge. Several of the figures he reads out (stacked deviation copies, the 23 pips remaining into a gap, the two-pip miss) are his own chart measurements, and this article does not restate them as anything more than that. Spread, slippage, gaps, volatility shifts and errors in the directional read all sit between these rules and any real result.
ICT Daily High and Low Caption Notes
The timestamped English captions used for this article are auto-generated and misrecognise a number of the speaker’s terms. This track renders “ICT” as “ipta” (1:23), “sell” as “cell” (1:12), “NYX” as written where he is describing a day he skips (5:49), “protractionary” as “projectionary” (12:44), and “bearish order block” as “shorter block” and “bullet order block” in the examples (9:17). Where the caption gives a numeric measurement it is reported only as the speaker’s own figure. Labels used in this article are the ones the surrounding context supports; where a phrase could not be resolved confidently it is described rather than quoted.
Watch ICT Projecting Daily Highs and Lows
ICT Mentorship Core Content – Month 08 – Projecting Daily Highs & Lows
The Inner Circle Trader · published 4 October 2022 · about 30 minutes 2 seconds. This recording is the primary source for every timestamp link above.
The recording is not embedded here because the video owner has disabled playback on other websites. That was tested directly on 15 September 2026 from a BestProps page origin at both desktop and mobile widths: the embedded player loads and then reports “Playback on other websites has been disabled by the video owner” with no duration and no playback progress. The video itself plays normally on the watch page, so no half-working player is left on this page.
The watch page was read on 15 September 2026 and rendered as a public video: ICT Mentorship Core Content – Month 08 – Projecting Daily Highs & Lows by The Inner Circle Trader, upload date 4 October 2022, listed duration 1,802 seconds, about 282,324 views at the time of reading, not private and not unlisted. The caption track used for this article covers about 1,803 seconds, which matches the listed duration.
ICT Daily High and Low Resources
These are the sources checked for this article. The regulator and investor-education pages are general material about trading systems sold to the public and about statistical measures; neither assesses the speaker, verifies the afternoon-range filter, the measured-distance technique, the deviation stacking or the time windows above, nor endorses anything said in the recording. Any ICT, smart-money or third-party indicator, script, note set, transcript pack, chart annotation or re-upload circulating outside the publishing channel’s own page is unofficial and untested here. The standard-deviation page is a general statistical reference and is not evidence for the method.
- [1] ICT Mentorship Core Content – Month 08 – Projecting Daily Highs & Lows The Inner Circle Trader (primary source; watch page read 15 September 2026, listed 1,802 seconds, about 282,324 views).
- [2] The Inner Circle Trader (official YouTube channel) (read 15 September 2026), the publishing channel for the April 2017 mentorship series.
- [3] CFTC: Fraud Advisory: Commodity Trading Systems Sold on the Internet (read 15 September 2026), the regulator's guidance on evaluating trading systems and advisory services, including its warnings about claims resting on hypothetical or incomplete results.
- [4] Investopedia: Standard Deviation Formula and Uses (read 15 September 2026), general reference for the statistical measure the lesson uses as its unit of distance; it neither describes nor validates the projection technique.
Source: ICT, ICT Mentorship Core Content – Month 08 – Projecting Daily Highs & Lows, The Inner Circle Trader, 4 October 2022. Transcript SHA-256 e97d67ab64fce61263c688268c06c116ae0298f06b712e66da8a4e480724edc7. Educational write-up of the speaker’s own framework; it is not trading advice, and no strategy, level or parameter above has been tested or verified here.