
Key takeaways
ICT’s fifth April 2017 mentorship day-trading lesson defines four London intraday profiles built around a fixed bullish or bearish daily-chart bias, a Central Bank dealers range preferably under 40 pips, and an Asian range of 20 to 30 pips measured from 8 p.m.
Read the full summary
ICT’s fifth April 2017 mentorship day-trading lesson defines four London intraday profiles built around a fixed bullish or bearish daily-chart bias, a Central Bank dealers range preferably under 40 pips, and an Asian range of 20 to 30 pips measured from 8 p.m. to midnight New York. Normal protraction moves against the daily bias immediately after midnight and into the 2 a.m. hour, rallying on sell days or declining on buy days by a projected one to two standard deviations of the dealers range, with continuation ideally visible through 1 a.m. to 1 30 a.m. Delayed protraction applies when that initial move never appears, prompting traders to mark 2 a.m. on the 15-minute chart and wait for a Judas swing into a premium PD array such as a bearish order block, fair value gap, or liquidity void for shorts, or a discount PD array such as an optimal trade entry, bullish order block, fair value gap, or liquidity void for longs. A dealers range above 40 pips is a warning rather than an automatic rejection when the Asian session compresses, and delayed profiles can occur on either side of 40 pips. ICT says neither profile appears every day, some sessions trend 90 or 150 pips without an entry, and the framework has no demonstrated tested predictive or profitable edge.
How we researched this article
BestProps used document-based research from primary firm sources, checked September 24, 2026. The complete source list, scope, limitations, and commercial-state record appear near the end of this article.
ICT Intraday Profiles Covered in the Lesson
The recording opens by identifying itself as lesson five of the April 2017 mentorship day-trading model and states that the teaching deals with intraday market profiles (0:16, 0:19, 0:24, 0:26). He then works through four templates in order: the sell profile with normal London protraction (0:33), the sell profile with delayed protraction (8:08), then the same two in the buy direction (11:27, 14:32). At the end he reduces the whole thing to two possibilities per direction and says the characteristics he looks for are highly specific rather than ambiguous (18:10, 18:22).
Two dates belong to this recording and they are not the same day. The watch page lists an upload date of 5 October 2022 and a duration of 21 minutes 56 seconds, while the lesson itself says it is the fifth lesson of the April 2017 mentorship month. The spoken session and the publication date are separate facts; the 2017 date is what the speaker says when introducing the material, and 2022 is when the channel published it. The caption track used for this article runs to 1,317 seconds, so it agrees with the listed duration.
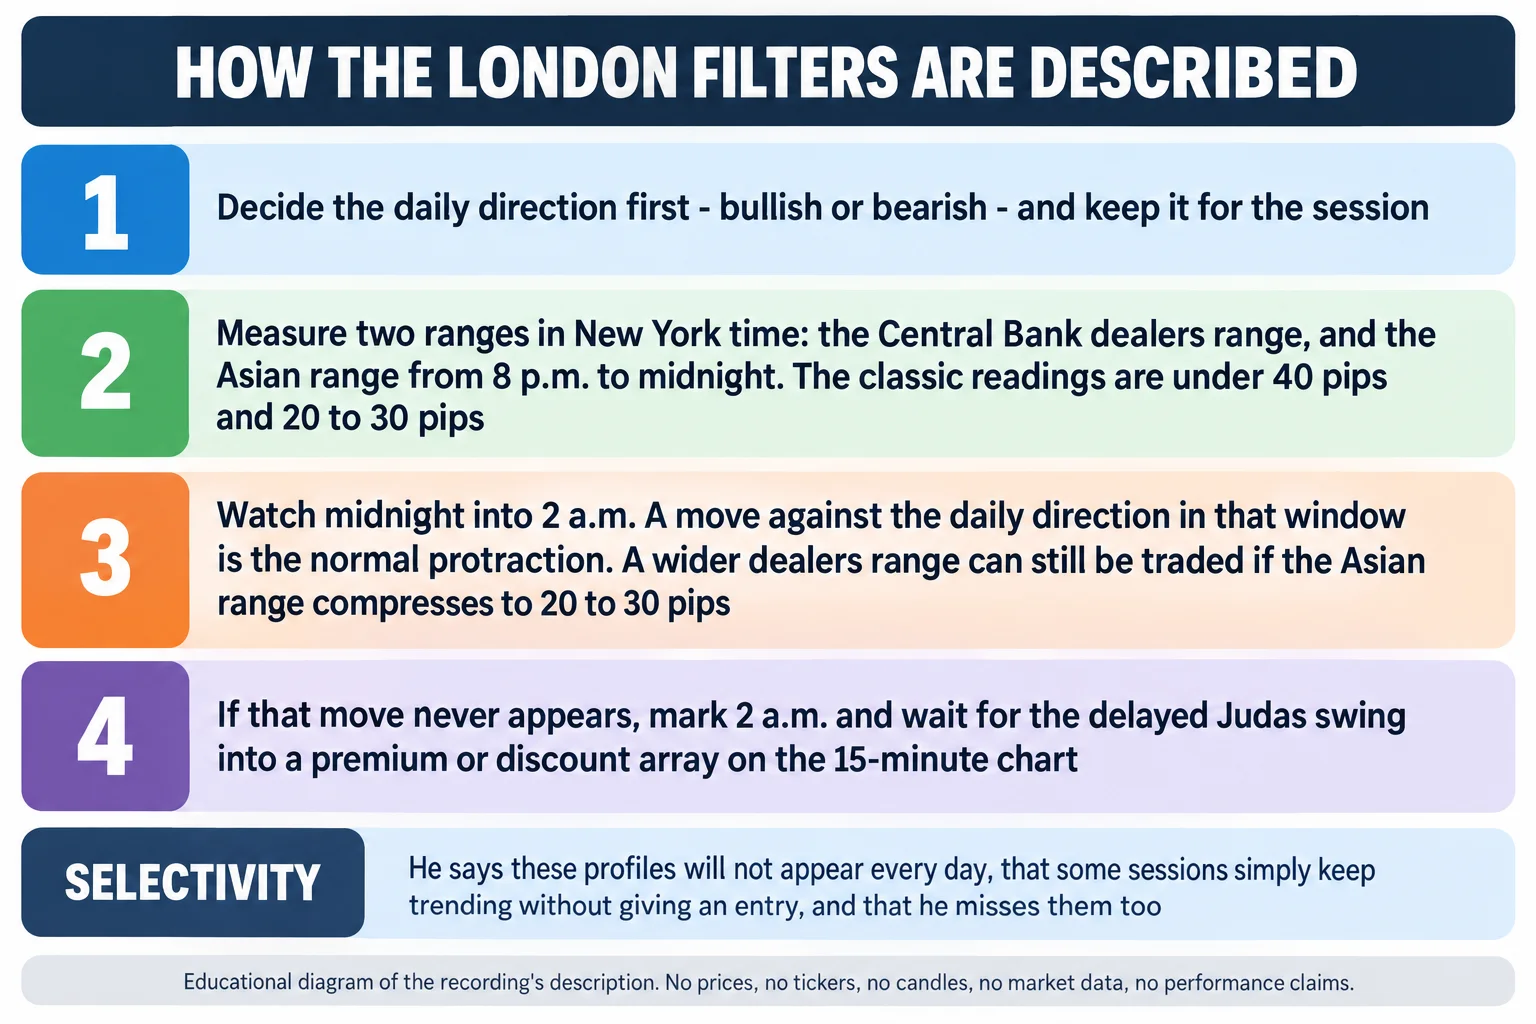
Key Filters for Every ICT Intraday Profile
Before any of the four templates, he sets two range measurements and repeats them for both directions. The first is what he calls the Central Bank dealers range, and for a classic or high-probability setup he wants it under 40 pips (1:37). The second is the Asian range, which he defines on the recording as the span between 8 p.m. and midnight New York time, with a classic reading of 20 to 30 pips (1:53, 2:03).
He also explains why the 40-pip figure is a preference rather than a switch. A dealers range wider than 40 pips tells him the late New York session has already been extended and that the market has not been allowed to build a two-sided float, which he treats as a warning rather than a disqualification (4:14, 4:35). What can change that verdict, in his description, is the Asian session then compressing into a tight 20 to 30 pip consolidation: if it does, he says he can go back to electing to look for the profile, and if it does not, he says he cannot take the London session after that much prior volatility (4:52). He adds a further condition inside the normal sell profile: the entry can come as early as 1:30 a.m. New York, and by 1:00 to 1:30 a.m. he wants price to have made a higher high than either the Asian range or the dealers range produced (6:11, 6:31). On the buy side the mirror requirement appears later in the lesson, where the decline has to continue past the same 1:00 to 1:30 a.m. window.
Normal London Protraction Sell Profile
Starting from a bearish higher-time-frame premise, the normal protraction sell profile expects the market to rally after midnight New York and to keep working higher into the 2 a.m. hour, with the London high forming in that counter-directional move (2:16). He describes that move as the protraction stage and says it draws in buyers and squeezes traders already short with stops just above the market (6:01, 6:57, 7:02). The projection he wants from it is one to two standard deviations of the Central Bank dealers range, and he says his own preference is to wait on the sideline for exactly these ingredients rather than look for something else if the criteria are not there (3:28, 3:41). If the criteria are met, he says the high of the day can be set between 2:00 and 4:00 a.m., and the London close period is where he describes the resulting low forming (7:17, 7:49).
The worked example he walks through at that point is his own description of a chart on screen: a small consolidation as the Asian range, an immediate move up after midnight, the high of the day set there, a decline into the London close period, and then consolidation off the low. He narrates the protraction as appearing immediately after the midnight candle (7:29). Because only the caption track and audio were used as the source here, no exact prices, order fills or subsequent results from that example can be established, and none are asserted below.
Delayed London Protraction Sell Profile
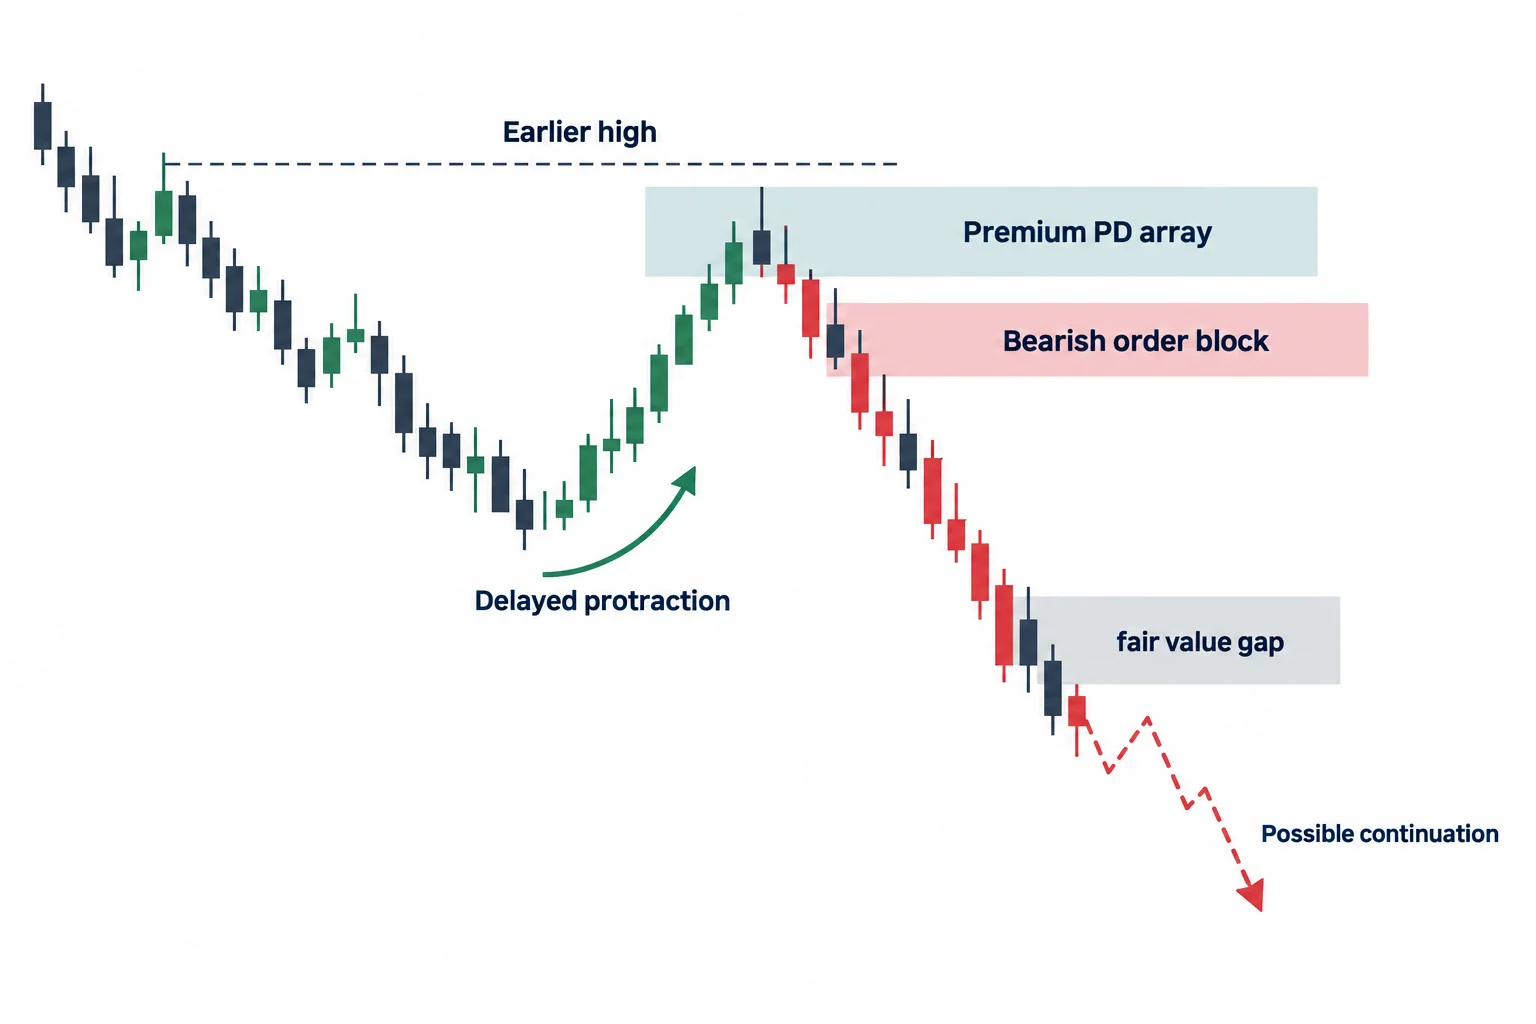
For the delayed bearish version the dealers range may be either side of 40 pips, because the filter moves to whether the session delivers the move at all. The directional bias stays bearish while the protraction is pushed later in the day: instead of a rally after midnight, he says price may simply erode and drift lower (8:08, 8:51). His instruction is then procedural: put a vertical line at 2 a.m. on the 15-minute chart and wait for a rally at or just after that time (9:00).
That delayed rally is the entry he wants for the short, taken inside the range or below the high the day has already formed, and he says it should not make a higher high. He then wants it to trade up into what he calls a premium PD array (naming a bearish order block, a fair value gap or a liquidity void), which is where he describes selling (9:30, 10:10). He restates the premise as a requirement rather than a preference: the daily chart already has to be respecting resistance and seeking sell-side liquidity, and without that the delayed profile is not the trade (10:18). The example he shows for this template has price rolling over without a higher high, then a rally after 2 a.m. into a bearish order block that he describes as creating the London session high, followed by a move lower (10:51).
Normal London Protraction Buy Profile
The buy side mirrors the sell side. He says this normal protraction profile is the one he prefers when looking to buy the London session, with the same two filter readings: a Central Bank dealers range under 40 pips and an Asian range of 20 to 30 pips (11:27, 11:40). With a bullish daily premise, price is expected to decline after midnight New York and keep trending toward 2 a.m. He calls that the fingerprint of the profile, and if the decline does not start immediately he says the session is not this profile (11:53). The projection is again one to two standard deviations of the dealers range and is treated as the projected low (12:17).
He allows a modest initial rise after midnight, but says price then has to trend lower and keep making lower lows into the 2 a.m. window, ideally continuing lower past 1:00 to 1:30 a.m., which is where he treats the profile as confirmed (13:06, 13:11, 13:24). In the example he narrates, price drops right after the midnight candle, finds the low of the day and then expands upward for a higher close (13:51, 14:08). That is his account of the chart he was showing; it is not evidence of what any trader achieved on it.
Delayed London Protraction Buy Profile
In the delayed buy version he says the dealers range is explicitly allowed to be either less than or greater than 40 pips, because the filter shifts to the Asian range and a small Asian consolidation is a favourable factor rather than a requirement. The profile can appear with or without it (14:32, 14:52). The main premise stays a bullish directional bias with a delayed protraction, entering at or shortly after 2 a.m. New York, and the entry he looks for is a discount PD array bought during that delayed retracement (15:21, 15:28).
The array types he lists for the long are a classic intraday optimal trade entry, a bullish order block closing a fair value gap below market price, or a liquidity void (16:49, 16:55). In the example he narrates, the market starts higher without the initial drop, the 2 a.m. delay arrives, and price dips into a previous down-close candle he identifies as a bullish order block before the bullish close he describes for the rest of the day (17:17). These are his labels and his reading of the charts on screen.
When ICT Intraday Profiles Do Not Apply
The part of the lesson worth keeping separate from the templates is what he says about the days that do not fit. He states that the criteria are specific, that if the London protraction characteristics are not present he looks for justification for the delay, and that the key time is 2 a.m. New York (18:22, 18:38). He also gives the practical demand plainly (that a London trader has to be awake from midnight New York until roughly 2:30 or 3:00 a.m.). to see these conditions develop (19:05, 19:12).
He is equally direct that the profiles keep him out of trades. He says there will be times when neither profile provides an entry, that the market may simply keep going for a 90 or 150 pip day without one, that missing it is a trade he misses too, and that the characteristics should be looked for rather than forced (20:23, 20:41, 20:45). That is the strongest qualification in the recording and it belongs next to the templates rather than after them.
ICT Intraday Profile Checklist
The following is a general educational ordering of what he describes, not a tested system and not the speaker’s own wording:
- Fix the daily-chart direction first, bullish or bearish, and choose only the matching pair of profiles.
- Measure the Central Bank dealers range and the Asian range (8 p.m. to midnight New York) and note whether they read under 40 pips and 20 to 30 pips.
- Watch midnight into 2 a.m. A move against the daily direction in that window is the normal protraction candidate.
- If that move never appears, mark 2 a.m. on the 15-minute chart and look for the delayed Judas swing into a premium array on a sell day or a discount array on a buy day.
- Log the sessions that fit neither template instead of forcing them, which is the selectivity he describes at the end.
Anyone comparing this framework across dates should also fix the time zone and daylight-saving handling first, because every condition in it is expressed in New York time, and should keep the two range measurements defined the same way before drawing conclusions from old charts.
ICT Intraday Profile Caption Notes
The transcript used for this article is the automatic YouTube caption track for the recording, not a human-checked transcript, and it mishears several terms. Where the wording of the track is not what he said, the term has been normalised only where context makes the intended word unambiguous: the track’s “Inay market profiles” is intraday market profiles, “the cell profile” is the sell profile, “Judith swing”, “Judah swing”, “Judi swing” and “du to swing” are Judas swing, “proactionary”, “protractionary” and “prary stage” are protraction, “shoulder block” is bullish order block, “barish” is bearish, and “C Bank dealers range” is Central Bank dealers range. The recurring “IPA” is left as the track renders it rather than expanded, because the acronym itself is not spoken out in full anywhere in the recording. Where a term could not be resolved confidently it has been described rather than quoted. Numbers were not adjusted except where the surrounding sentence and the repeated readings confirm them; the 40-pip and 20-to-30-pip figures are stated the same way several times across the lesson. The recording also contains long passages where he is describing charts on screen, and this article reports only what he says about them.
Watch the ICT Intraday Profile Lesson
ICT Mentorship Core Content – Month 08 – Intraday Profiles
The Inner Circle Trader · published 5 October 2022 · about 22 minutes. This recording is the primary source for every timestamp link above.
The recording is not embedded here because the video owner has disabled playback on other websites. That was tested directly on 15 September 2026 from a BestProps page origin at both desktop and mobile widths: the embedded player loads, then reports “Playback on other websites has been disabled by the video owner” with no duration and no playback progress, while the video itself plays normally on YouTube. No empty or half-working player is left on this page.
The watch page was read on 15 September 2026 and is publicly listed as ICT Mentorship Core Content – Month 08 – Intraday Profiles by The Inner Circle Trader, upload date 5 October 2022, listed duration 1,316 seconds (about 21 minutes, 56 seconds). The caption track used for this article runs to 1,317 seconds, so the transcript and the listed duration agree, and the upload date is distinct from the April 2017 lesson date the speaker gives at the start of the recording.
ICT Intraday Profile Resources
These are the sources checked for this article. The regulator and investor-education pages are general material about short-term trading and about how trading systems and advisory services sold to the public should be assessed; neither one evaluates this speaker, verifies any profile, filter, array or timing rule described above, nor endorses anything said in the recording. Any ICT, smart-money or third-party indicator, script, note set, chart annotation, transcript pack or re-upload circulating outside the publishing channel’s own page is unofficial and has not been tested here.
- [1] ICT Mentorship Core Content – Month 08 – Intraday Profiles The Inner Circle Trader (primary source; watch page read 15 September 2026, listed duration 1,316 seconds).
- [2] The Inner Circle Trader (official YouTube channel) (read 15 September 2026), the publishing channel for the recording used here.
- [3] Investor.gov (SEC), Day Trading (read 15 September 2026), investor education describing day traders as buying, selling and short-selling through the day in the hope of locking in quick profits, and stating that day trading is extremely risky and can result in substantial financial losses in a very short period of time.
- [4] CFTC, Fraud Advisory: Commodity Trading Systems Sold on the Internet (read 15 September 2026), the regulator’s guidance on assessing trading systems and advisory services sold to the public, including its warning that hypothetical trading results typically are based on simulations using historical price data and may overestimate or underestimate a system’s performance.
Source: ICT, ICT Mentorship Core Content – Month 08 – Intraday Profiles, The Inner Circle Trader, published 5 October 2022; the lesson identifies itself as lesson five of the April 2017 mentorship day-trading model. Automatic YouTube captions were the transcript used for this article, and the terms the track mishears are listed above. This commentary is educational and is not investment advice.