
Key takeaways
The Inner Circle Trader on YouTube presents a roughly 23 minutes 42 seconds lesson for entering higher-time-frame positions without trading the London session, using the midnight GMT daily open after price has already reacted to a higher-time-frame premium or discount PD array.
Read the full summary
The Inner Circle Trader on YouTube presents a roughly 23 minutes 42 seconds lesson for entering higher-time-frame positions without trading the London session, using the midnight GMT daily open after price has already reacted to a higher-time-frame premium or discount PD array. For a bullish setup, buy at the midnight GMT open or place a limit 10 to 20 pips below it after a prior daily discount reaction. For a bearish setup, sell at the open or 10 to 20 pips above it after rejection from a premium area such as a bearish order block, old high or Turtle Soup pattern. The anticipated counter-move is called the Judas swing, while Power of Three describes an open near one daily extreme, expansion toward the other and a close near that opposite extreme. Long stops equal the entry minus the five-day average daily range, short stops equal the entry plus that range, and stops may be 90 to 100 pips because the objective is a higher-time-frame move of several hundred pips into the opposing PD array. Traders can split risk equally, placing half at the open and half at the 10 to 20 pip offset so a move without a pullback still produces a partial fill. A five-period average true range can approximate the five-day range when no ADR indicator is available. The method reports no fills, testing, costs or performance statistics, cannot predict the counter-move size, and explicitly allows for price to hit the stop before moving as expected. Homework requires three recent examples using only the midnight GMT open, comprising one successful buy, one successful sell and one failure, with movement from the open compared against the five-day average daily range.
How we researched this article
BestProps used document-based research from primary firm sources, checked September 24, 2026. The complete source list, scope, limitations, and commercial-state record appear near the end of this article.
In ICT Mentorship Core Content – Month 08 – Integrating Daytrades With HTF Trade Entries, the speaker introduces himself as on lesson eight, the last of April 2017's content for the ICT day-trading model (0:06), and frames the lesson around a practical problem: how to enter a higher-time-frame setup when you cannot be at the screen for the London session (1:21). He says the method needs very little analysis time and does not require the London kill zone (0:36), and he grounds that claim in his own situation, describing a period when he was caring for three children including a newborn and could not trade London, so he built this approach as the answer.
Two boundaries belong at the front. First, every term here (PD array, premium and discount, institutional order flow, Judas swing) is his reading of a chart, not an established market law, and the recording identifies no participant or order behind the moves he describes. Second, the recording reports no fills, no results and no testing. What it contains is a stated method, some arithmetic examples and an explicit acknowledgement that the stop can be hit. This should not be read as verified profitability.
ICT Daytrade Framework Using Power of Three
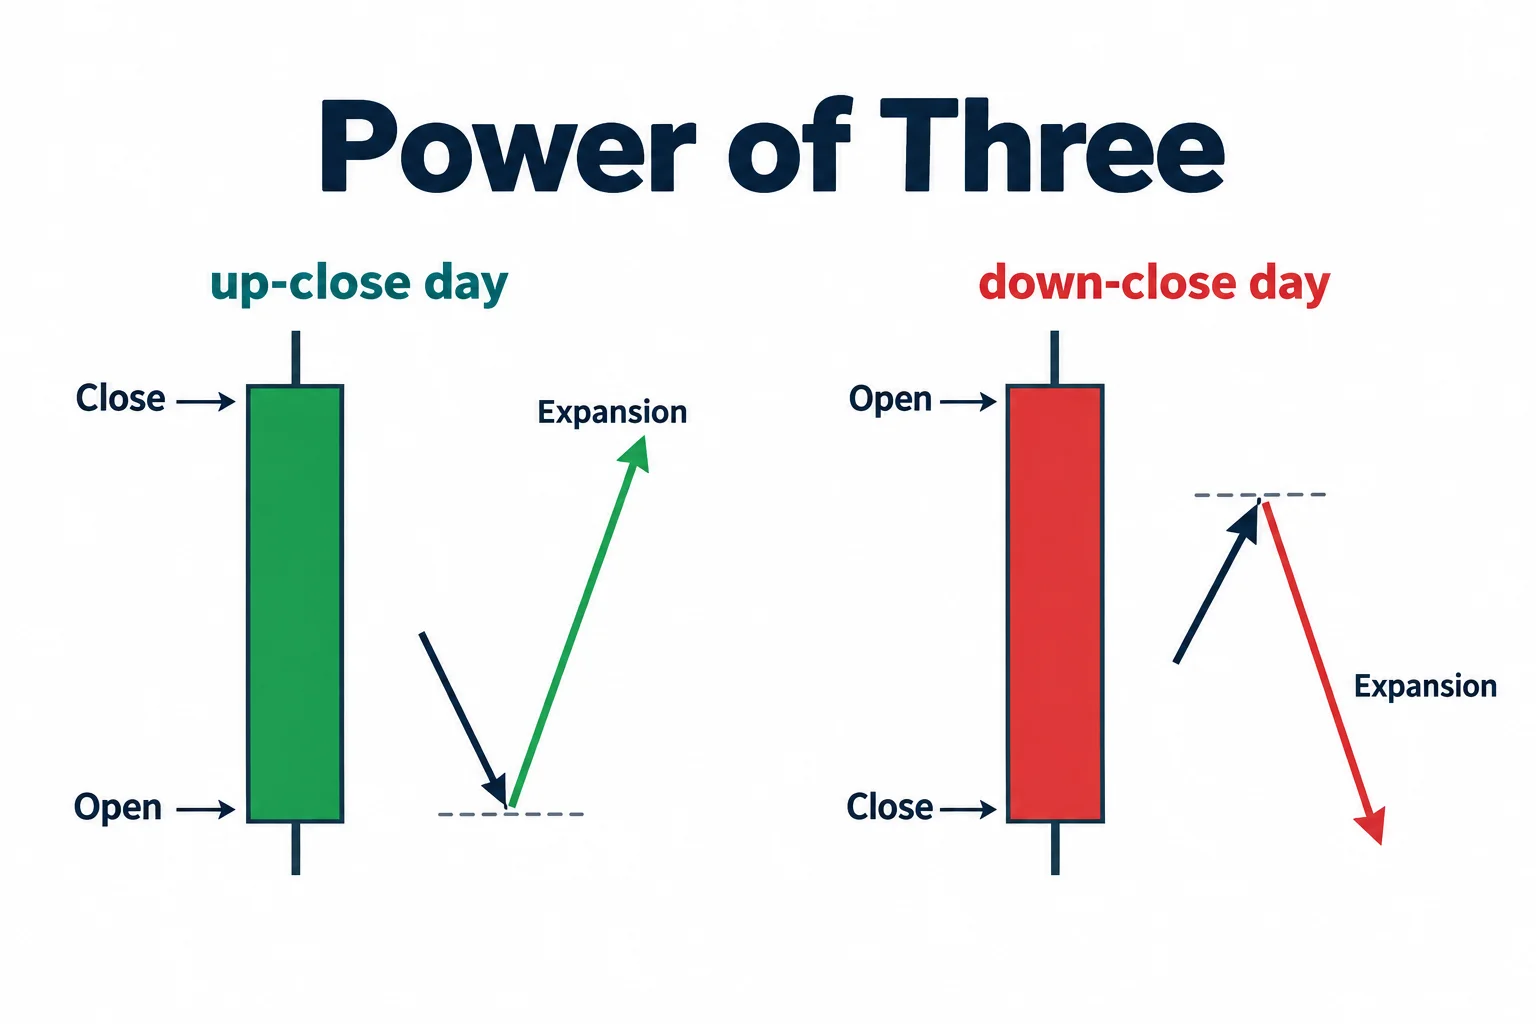
He starts by revisiting Power of Three. On an up-close day he describes the open arriving near the low of the day with only a small wick below it, then range expansion upward, then a close that typically finishes just a little off the high. The down-close day is the mirror: open near the high of the day, a small wick above it, expansion lower, and a close coming off the low. He summarises it as “the open rally up close or open decline down close,” with the open near one extreme of the daily range and the close near the opposite one (2:18). The teaching value he attaches to that shape is the question it creates, which he puts as: if it is going to be an up-close day, how much lower than the opening will price go first; and if it is going to be a down-close day, how much higher than the opening will it go before it closes lower (7:11).
ICT Daytrade Entry Opening References
His answer is the opening price itself. He names the two session openings he monitors daily: the 00:00 GMT open, which he calls the standard reference on the platform he teaches from, and the midnight New York opening price. Both are read off the hourly chart at the start of the daily candle (4:02). He tells the reader to calibrate the 00:00 GMT time to their own platform, because platform timestamps differ, and to know what that time is where they live (4:04).
The 00:00 GMT reference is the one the lesson develops, and he explains the choice in terms of availability: he presents the New York midnight candle as his own “true day” opening when he is awake and trading London, so he can work the small pre-expansion move with a very tight stop, but the 00:00 GMT open is what lets someone frame the position without being awake for that session at all (10:14). He also notes what else happens at that hour: the Central Bank dealers range is closing, which he says gives some expectation of how much of a counter-move to anticipate (12:18), though he never claims to know its size in advance (10:50).
HTF Trade Conditions Before Daytrade Entries
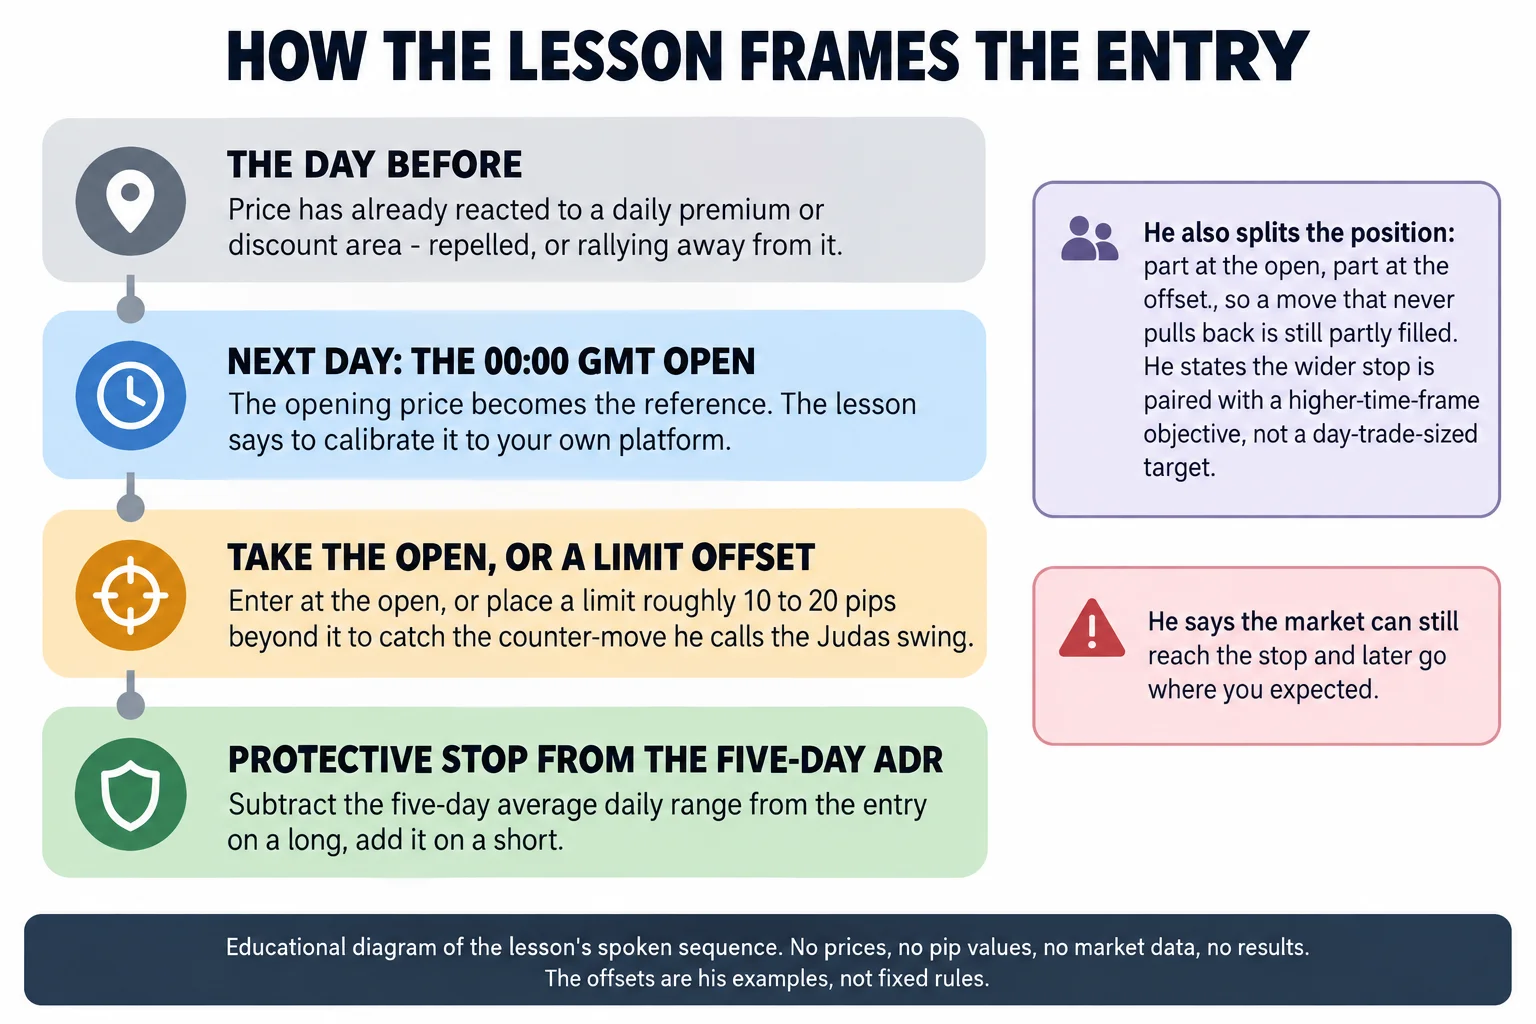
The opening price alone is not the setup. He is explicit that the trader has to know where price sits on the higher-time-frame PD array matrix (are we moving from a discount up into a premium, or from a premium down into a discount) and that this is what supplies the directional bias (5:04). The sequence is anchored on the previous day: for the bullish case the daily chart has to have already traded down into a discount array and respected it, so that the next trading day shows little or no movement below the opening price at 00:00 GMT (9:16); for the bearish case price has to have recently traded at a premium array and been repelled by it, or failed to go higher (9:23).
Bullish HTF Trade Entry Sequence
He walks the long version through as a scenario. Price has traded down into a discount PD array on the daily chart, institutional order flow has been bullish, price has hit a bullish order block and shown a willingness to rally away from it, then the next day at 00:00 GMT the opening price becomes the reference (9:42). He notes that this is the same expectation his earlier London teaching built: that opening price followed by a move down. What changes is the participation question. If you cannot be awake for the London protraction, he says you can still take the setup, because you already know what you would have been waiting for, the Judas swing lower to seek liquidity before the move higher (10:17).
The mechanics he gives are deliberately blunt. Buy at the 00:00 GMT opening price (13:04); or, if you want to try to catch the pullback, place a limit 10 to 20 pips below it (20:02). The protective stop is the five-day average daily range subtracted from the opening price (14:07), and the position is then held until price reaches a premium PD array on the higher time frame (14:13).
Bearish HTF Trade Entry Sequence
The short version reverses each piece. The prior session must have respected a premium PD array on the daily chart (he lists a bearish order block, or a rejection of an old high in the shape he calls Turtle Soup (9:23)) and the entry is a short at the 00:00 GMT opening price, or a sell limit 10 to 20 pips above it (16:10). The stop is the five-day average daily range added to the entry (16:40). Here he is explicit about the assumption underneath: because he reads the day as a bearish cycle, there should be very little upside above the opening, which is what makes a limit placed above it reasonable rather than arbitrary (19:03).
He offers an arithmetic illustration for the stop placement, and it is worth treating carefully: the caption track renders it as a set of prices he reads out, and the figures do not survive transcription cleanly enough to reproduce as a worked example. The point he draws from it does come through, the resulting stop is relatively small in his framing, and he argues on that basis that a 60 to 70 pip rally above the open before a down-close is, in his view, highly unlikely when the previous day has respected a daily premium area (19:50). That “highly unlikely” is his assessment of his own setup, not a measured frequency.
ICT HTF Trade Entry Stop Placement
The five-day average daily range does the work of the stop for both directions, and he is candid about the size that produces. He puts it at possibly a 90 pip stop, or 100 if that is what the range gives, and says: then that is what it is (13:15). His justification is the objective rather than the stop. This is not, in his words, day trading with minute risk trying to capture 20R; the point of the lesson is integrating day-trade concepts into higher-time-frame entries, and since the target is a move of several hundred pips, a 90 to 100 pip stop is, in his phrasing, relatively insignificant (13:42).
He also addresses the obvious failure mode, placing a limit that never fills because price runs away. His answer is to split the intended position: take half the risk you had planned for the offset order and place it at the 00:00 GMT opening price immediately, then keep the second half at the 10 to 20 pip offset, accepting that it may not fill (18:46). The purpose he gives is simply to have something on rather than nothing. In his own words, once positioned you can go to sleep and let the higher-time-frame objective do the work (14:07).
Limits of the ICT Daytrade Entry Framework
The acknowledgement that matters most comes near the end, and he states it without hedging: knowing the stop from the average daily range does not mean you will not get stopped out, and the market can take the stop and still go where you thought it would (22:45). He also says the size of the pre-expansion move is not knowable in advance. There is no way to know how much of a counter-move there will be, only a reasonable expectation (10:50). Both points sit in the recording rather than being attached to it afterwards.
Beyond that, the recording contains no fills, no transaction costs, no slippage or gap treatment and no outcome statistics for any of the scenarios. The stops described are wide relative to the entry, so the arithmetic he sketches around a small stop only holds if the higher-time-frame objective is in fact reached. The captions also expose no chart values from the on-screen examples, so no level, date or instrument in this article is reproduced from his charts, and the worked arithmetic in the bearish section is too garbled by the caption track to restate. The method as presented is a planning framework with an unquantified edge; spread, slippage, gaps, volatility shifts and errors in the directional read all sit between the rules and any real result.
ICT Daytrade Lesson Caption Notes
The timestamped English captions used for this article are auto-generated and misrecognise a number of the speaker’s terms. This track renders “HTF” as “hard time frame” (0:36), “ICT” as “ifta” and once as “ipta” (1:21), “protraction” as “projectionary” (10:50), “sell” as “cell” (19:03), “bearish order block” as “bear shoulder block” and “Turtle Soup” as “Turtle suit” (9:23), and the daily range indicator he calls ADR as “ADR” in one place and the range concept as “Central bike dealers range” elsewhere. The price figures in the bearish arithmetic example are among the passages that do not survive transcription reliably. Labels used in this article are the ones the surrounding context supports; where a phrase could not be resolved confidently it is described rather than quoted.
Watch the ICT HTF Trade Entry Lesson
ICT Mentorship Core Content – Month 08 – Integrating Daytrades With HTF Trade Entries
The Inner Circle Trader · published 8 October 2022 · about 23 minutes 42 seconds. This recording is the primary source for every timestamp link above.
The recording is not embedded here because the video owner has disabled playback on other websites. That was tested directly on 15 September 2026 from a BestProps page origin at both desktop and mobile widths: the embedded player loads and then reports “Playback on other websites has been disabled by the video owner” with no duration and no playback progress. The video itself plays normally on the watch page, so no half-working player is left on this page.
The watch page was read on 15 September 2026 and rendered as a public video: ICT Mentorship Core Content – Month 08 – Integrating Daytrades With HTF Trade Entries by The Inner Circle Trader, upload date 8 October 2022, listed duration 1,422 seconds, about 203,650 views at the time of reading, not private and not unlisted. The caption track used for this article covers about 1,423 seconds, which matches the listed duration.
ICT Daytrade Entry Homework
He closes with an assignment rather than a summary. Students are to find three examples in recent weeks using only the 00:00 GMT opening price: one that worked as a buy, one that worked as a sell, and one that failed (20:52). He asks them to compare how far price moved from the opening against the five-day average daily range (21:59), and to post the pair, the location and the measured movement in one post on the April content thread (21:55).
Two details from that section are worth carrying over. He insists on the failed example, not just the two that worked, and he explains the assignment as forcing the cycle of looking for PD arrays and higher-time-frame order flow rather than simply being shown setups (21:37), though he also concedes that the student has the benefit of hindsight (21:51). And for readers without an average-daily-range indicator, he says a five-period average true range on most platforms will land close to his own number, and that the line and colour change his indicator adds are presentation rather than analysis (22:16). The five-day ATR proxy is his suggested approximation, not a published study; anyone using it should verify it against their own platform's calculation.
ICT Daytrade Entry Resources
These are the sources checked for this article. The regulator, investor-education and indicator-reference pages are general or platform material; none of them assesses the speaker, verifies the 00:00 GMT method, the offset examples or the stop convention above, or endorses anything said in the recording. Any ICT, smart-money or third-party indicator, script, note set, transcript pack, chart annotation or re-upload circulating outside the publishing channel’s own page is unofficial and untested here. The average-true-range page is a platform reference for the indicator he names as an approximation and is not evidence for the method.
- [1] ICT Mentorship Core Content – Month 08 – Integrating Daytrades With HTF Trade Entries The Inner Circle Trader (primary source; watch page read 15 September 2026, listed 1,422 seconds, about 203,650 views).
- [2] The Inner Circle Trader (official YouTube channel) (read 15 September 2026), the publishing channel for the April 2017 mentorship series.
- [3] CFTC: Fraud Advisory: Commodity Trading Systems Sold on the Internet (read 15 September 2026), the regulator's guidance on evaluating trading systems and advisory services, including its warnings about claims resting on hypothetical results and about performance figures that omit costs.
- [4] Investopedia: Average True Range (ATR): Formula, What It Means, and How to Use It (read 15 September 2026), general reference for the average true range indicator the lesson names as a five-period approximation to its average-daily-range measure.
- [5] TradingView: Pine Script reference: ta.atr() (read 15 September 2026), the platform documentation for computing average true range, relevant to the five-period proxy the lesson suggests when its own indicator is unavailable.
Source: ICT, ICT Mentorship Core Content – Month 08 – Integrating Daytrades With HTF Trade Entries, The Inner Circle Trader, 8 October 2022. Transcript SHA-256 ad619357423bdbc2c026a5245a7e6aa4a54508b33cd3b693da216bef923b97fd. Educational write-up of the speaker’s own framework; it is not trading advice, and no strategy, level or parameter above has been tested or verified here.