
Key takeaways
ICT lesson seven presents a discretionary London open day-trading framework led by daily and four-hour direction, using previous-day, previous New York session, London kill zone, and London-to-New-York ranges to identify retracements, stop raids, and moves between discount and premium PD arrays.
Read the full summary
ICT lesson seven presents a discretionary London open day-trading framework led by daily and four-hour direction, using previous-day, previous New York session, London kill zone, and London-to-New-York ranges to identify retracements, stop raids, and moves between discount and premium PD arrays. Ideal filters are Monday through Wednesday, an Asian range of 20 pips or less before Frankfurt, a Central Bank Dealers Range under 40 pips, and execution on five-minute or 15-minute charts during 2 a.m. to 4 a.m. New York time, seeking the daily low when bullish and daily high when bearish. Long and short setups mirror each other and include Asian-range raids of at least five pips, fair value gaps beyond short-term New York session extremes, order blocks beyond short-term highs or lows, one or two standard-deviation extensions overlapping a PD array, midnight-to-2 a.m. Judas swings, liquidity-void completions, first retracements into order blocks, and turtle soup patterns involving a second failed break. Stated stop rules include 30 pips beyond entry for a Central Bank Dealers Range and PD array overlap, 40 pips beyond an Asian-range entry, 30 pips beyond a raided low or high, and 10 pips beyond the day’s extreme for a first order-block retracement. ICT advises leaving the initial stop unchanged until price covers 40 to 50 percent of the daily range rather than quickly moving to break-even. Seasonal and quarterly bias can support selection, but seasonal alignment is not required, and every setup requires a clear path toward the opposing PD array. The lesson supplies no sample size, success rate, account results, or tested risk parameters, and ICT explicitly says the setup list is not a panacea.
How we researched this article
BestProps used document-based research from primary firm sources, checked September 24, 2026. The complete source list, scope, limitations, and commercial-state record appear near the end of this article.
In ICT Mentorship Core Content – Month 08 – High Probability Daytrade Setups, he opens by naming it lesson seven of the day trading model series and stating the question the lesson answers: what makes day trades high probability (0:17). The watch page dates the upload to 8 October 2022, so this is a re-release of earlier mentorship material rather than new teaching.
ICT Daytrade Setup Direction Ranges and Filters
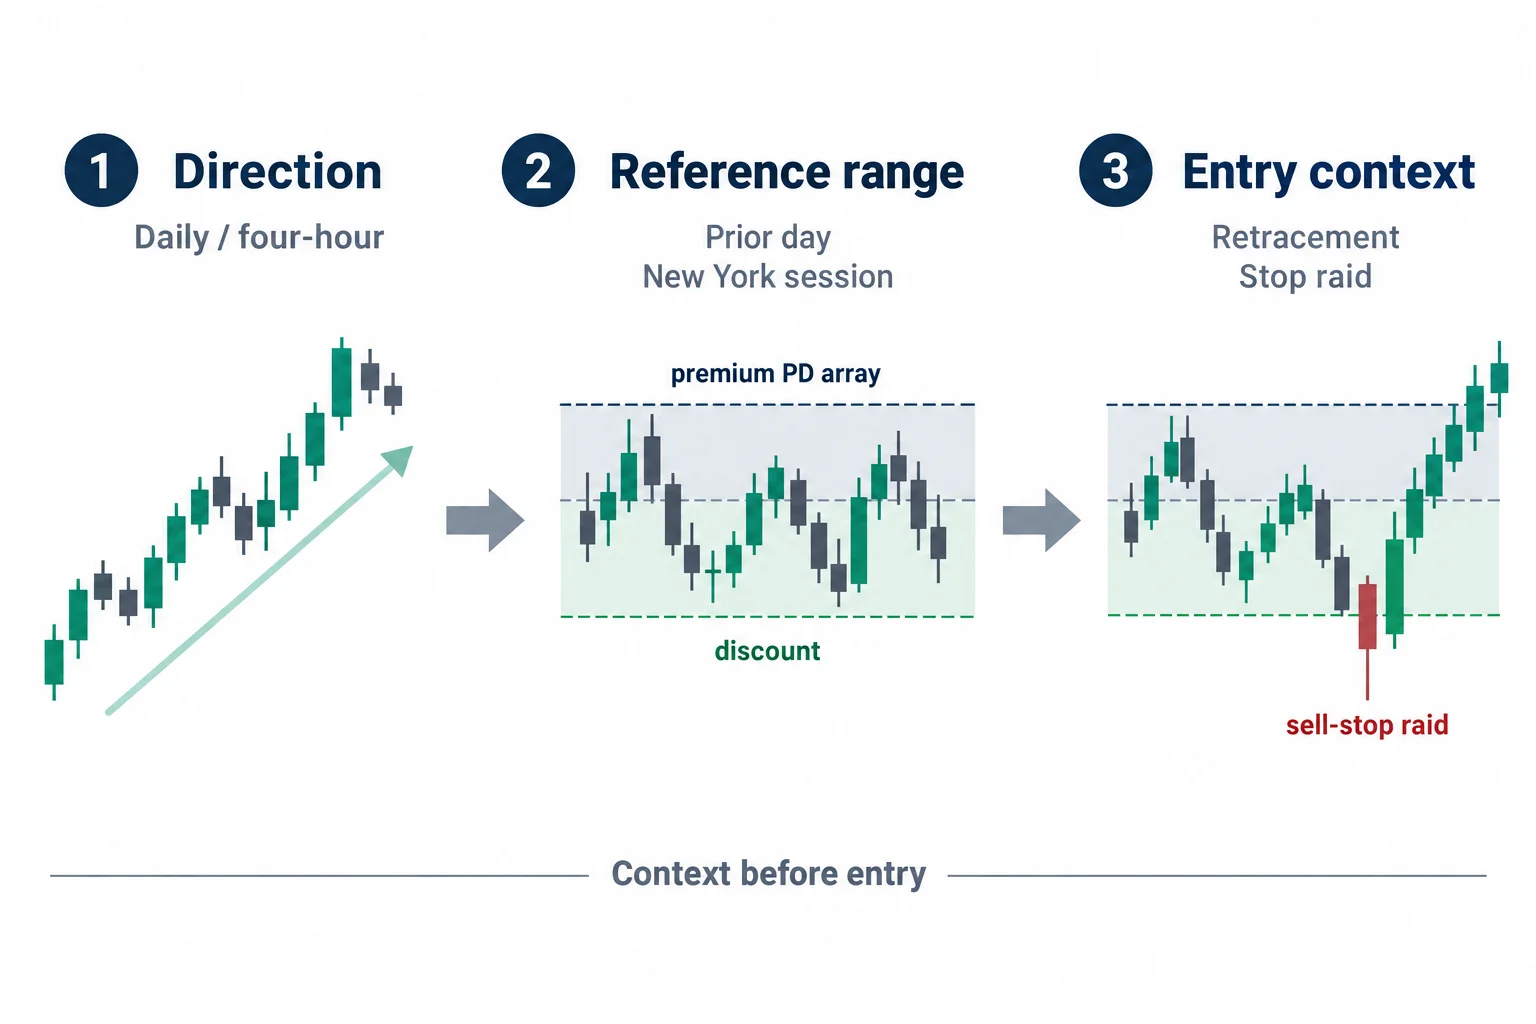
His ordering is explicit. The highest importance is placed on the higher-time-frame daily and/or four-hour direction (0:34). When that direction is bullish, the ranges he works from are the previous day’s low to high for retracement entries, the previous day’s New York session low to high for the same purpose, and the previous day’s low for a sell-stop raid to accumulate longs, all in service of the anticipated move from a higher-time-frame discount to a premium PD array (0:40, 1:02).
When the direction is bearish he inverts every one of those: previous day’s high to low for retracements, the previous New York session high to low for retracements, and the previous day’s high for a buy-stop raid to accumulate shorts, targeting the anticipated move from a premium to a discount array (1:11, 1:32). He summarises the whole exercise as three questions: what is the next most likely direction, from what level, and trading up to what level for profit (1:37).
The ranges he says to keep in view are the previous day’s high and low, the previous New York session’s highest high and lowest low, and two he adds himself. The first addition is the London session high and low for the London kill zone (1:55, 2:15). The second is the range from the London session’s extreme, whether that is the high or the low, across to the opposite extreme recorded before the New York session begins (2:32, 2:53).
He gives two reasons for measuring that London-to-New-York range. If he is bullish, it helps frame the next trading day’s retracement into that range; if he is bearish, the move up during what he calls the protractionary state is a retracement into the same range (4:02, 4:22). He measures the New York session high and low on the same basis, saying that range many times frames the next day’s higher low or higher high as a retracement inside it (4:41).
The stop raids are the reason he keeps previous day’s extremes marked. He says those scenarios generally appear at the end of a recent move: after several days up into a premium array, he expects price to trade above an old high, and he looks for a buy-stop run there before going short the next day (4:57, 5:17). He states the mirror case for a market that has been trading lower into a discount array: he looks for price below a previous day’s low, buys the sell stops, and uses that as a day trade (5:26).
Then he describes how he reads direction from price itself on the daily and four-hour charts, independently or together. For bullishness he looks for price bouncing off bullish order blocks, rejecting old lows and showing willingness to go higher, and filling gaps below before rallying; for confirmation he wants to see short-term premium arrays violated (5:43, 6:03). He says the opposite applies when bearish (6:23).
He also flags what the list is not. He calls it not the panacea list, not every possible scenario, but the criteria he looks for each trading day when the conditions are ripe and after doing his due diligence on the higher time frame (3:36). The same material appears on lower time frames, he says, with nothing different from what the daily, weekly or monthly charts have already shown (3:07).
Bullish ICT High Probability Daytrade Setups
The buying section starts with a seasonal preference he immediately downgrades: he likes seasonal bullish periods but says it is not required, and what is required is that a condition from the list is met for the trade to belong in what he calls the high probability series (6:26). The conditions are a current or new quarter expected to be bullish, and a daily chart that has reacted positively from a discount PD array (a bullish order block or any of the discount arrays he says should be known from the PD array matrix (6:40)).
His second condition is about visibility rather than levels: price should have a clear, unobscured path to an opposing premium array, meaning it is very easy to see what price would be reaching for above the current price; if you cannot see it easily, he says it is probably not a high probability setup (6:58).
The filters and timing follow. His ideal days for buying are Monday, Tuesday and Wednesday (7:17). He refers to the Central Bank Dealers Range and wants it ideally less than 40 pips, and demands the Asian range be 20 pips or less ahead of the Frankfurt open (7:24). The stated buying window is 2:00 a.m. to 4:00 a.m. New York time, seeking the low of the day, buying one to two standard deviations of the Central Bank Dealers Range and/or the Asian range coupled with a discount PD array (7:39). Execution is on the 15-minute and/or five-minute chart (7:58).
He then lists the bullish setups he actually looks for:
- Buying under the Asian range plus five pips for the spread (8:10).
- A fair value gap below a short-term low from the previous day’s New York session, looking back into the prior day’s range at the start of the new day for the low that generally forms, and if price can drop into it during London he looks for sell stops to trigger and buys from there. He insists it has to overlap with the Central Bank Dealers Range or Asian range and be in the London kill zone (8:16, 8:36).
- A bullish order block below a short-term low, either the previous day’s or one formed earlier the same day, the case where price trades below an intraday low into a bullish order block, which he calls a very strong condition when the overall market outlook is bullish, and he would be buying during London (8:56, 9:17).
- One standard deviation below the dealers range or Asian range with any discount PD array overlap while in the London kill zone, for the case he describes as being very bullish (9:21).
- Inside the protraction lower after midnight, from 12:00 a.m. to 2:00 a.m., buying the decline he calls the Judas swing, again only where it overlaps a discount PD array (9:39).
- A liquidity void completing below a short-term low, which he frames as the same fair-value-gap idea at larger size: a bigger gap that fills below a low, so that the trade is really about buying below lows to accumulate sell-stop liquidity (10:01, 10:21).
- If price rallies straight after midnight with no protraction lower into a discount, he buys the first retracement into a 15-minute or five-minute bullish order block once the 2:00 a.m. to 4:00 a.m. window arrives (10:28, 10:48).
- One or two standard deviations of the Asian range coupled with a discount PD array. He describes this as blending the two, looking for one to two standard-deviation drops of the Asian range’s total range that overlap the array (11:05, 11:25).
- A turtle soup, his term for buying a second failure: if a short-term low is taken out twice but there has been no upside protraction first, he says the case is weak and price probably keeps going lower; where there has been no prior Judas swing up, and price makes a low and then blows out that low once more, he buys that (11:28, 11:49).
He is explicit that these are preferences rather than a checklist to complete. He calls them his favourite setups, the ones that typically enter his thought process, and uses a sports analogy: a coach has a playbook and likes certain plays, and these are the scenarios he loves when trading the London open (11:53, 12:13, 12:34). On frequency he says these types of trades form several times a week when the market is bullish and has shown respect to a daily discount array, and that he expects something on the list to form in every London session (12:43, 13:05). Asked implicitly which one to pick, his answer is that they do not share characteristics and it depends on what the market is providing, so the work is watching from midnight New York time to see which scenario unfolds (13:10).
Bearish ICT High Probability Daytrade Setups
The shorting section is constructed as the inverse of the buying section, and he says so at each step. He likes seasonal bearish periods but again says it is not required; what matters is a current or new quarter expected to be bearish and a daily chart that has reacted at a premium PD array, that is, positively, after which he wants a clear unobscured path to an opposing discount array (20:32, 20:55).
His filters and timing match the long side: Monday, Tuesday and Wednesday as the ideal days, a Central Bank Dealers Range ideally under 40 pips, and an Asian range of 20 pips or less ahead of the Frankfurt open, which he translates as around 1:00 a.m. New York time (21:02, 21:23). The shorting window is 2:00 a.m. to 4:00 a.m. New York time seeking the high of the day, selling one to two standard deviations of the dealers range and/or the Asian range coupled with a premium PD array, executed on the five- or 15-minute chart (21:25, 21:46).
- A run above the Asian range of at least five pips, selling short there (21:55).
- A fair value gap above a short-term high from the previous day’s New York session, where he says buy stops will be resting, selling as price rallies above it during the New York session (22:06).
- A bearish order block above a short-term high, previous day or intraday: where a bearish block sits in price action with an untested short-term high just below it, and price trades above that high into the block during London, he shorts there (22:21, 22:41).
- One standard deviation with a premium PD array in the open kill zone, for the case he calls very bearish (22:44).
- Inside the protraction higher after midnight, 12:00 a.m. to 2:00 a.m., into a premium PD array. He says that alone is enough to get short, and describes it as a Judas swing from midnight up into 2:00 a.m., which can happen earlier but which he generally wants to see right after midnight (22:54, 23:15).
- A liquidity void completing above a short-term high (23:25).
- The first retracement into a bearish order block after the post-midnight drop, on a 15- or five-minute chart (23:32).
- One to two standard deviations of the Asian range coupled with a premium PD array (23:45).
- A turtle soup on the short side: a short-term high taken out twice with no initial downside move (23:52).
Stop Loss Rules for ICT Daytrade Setups
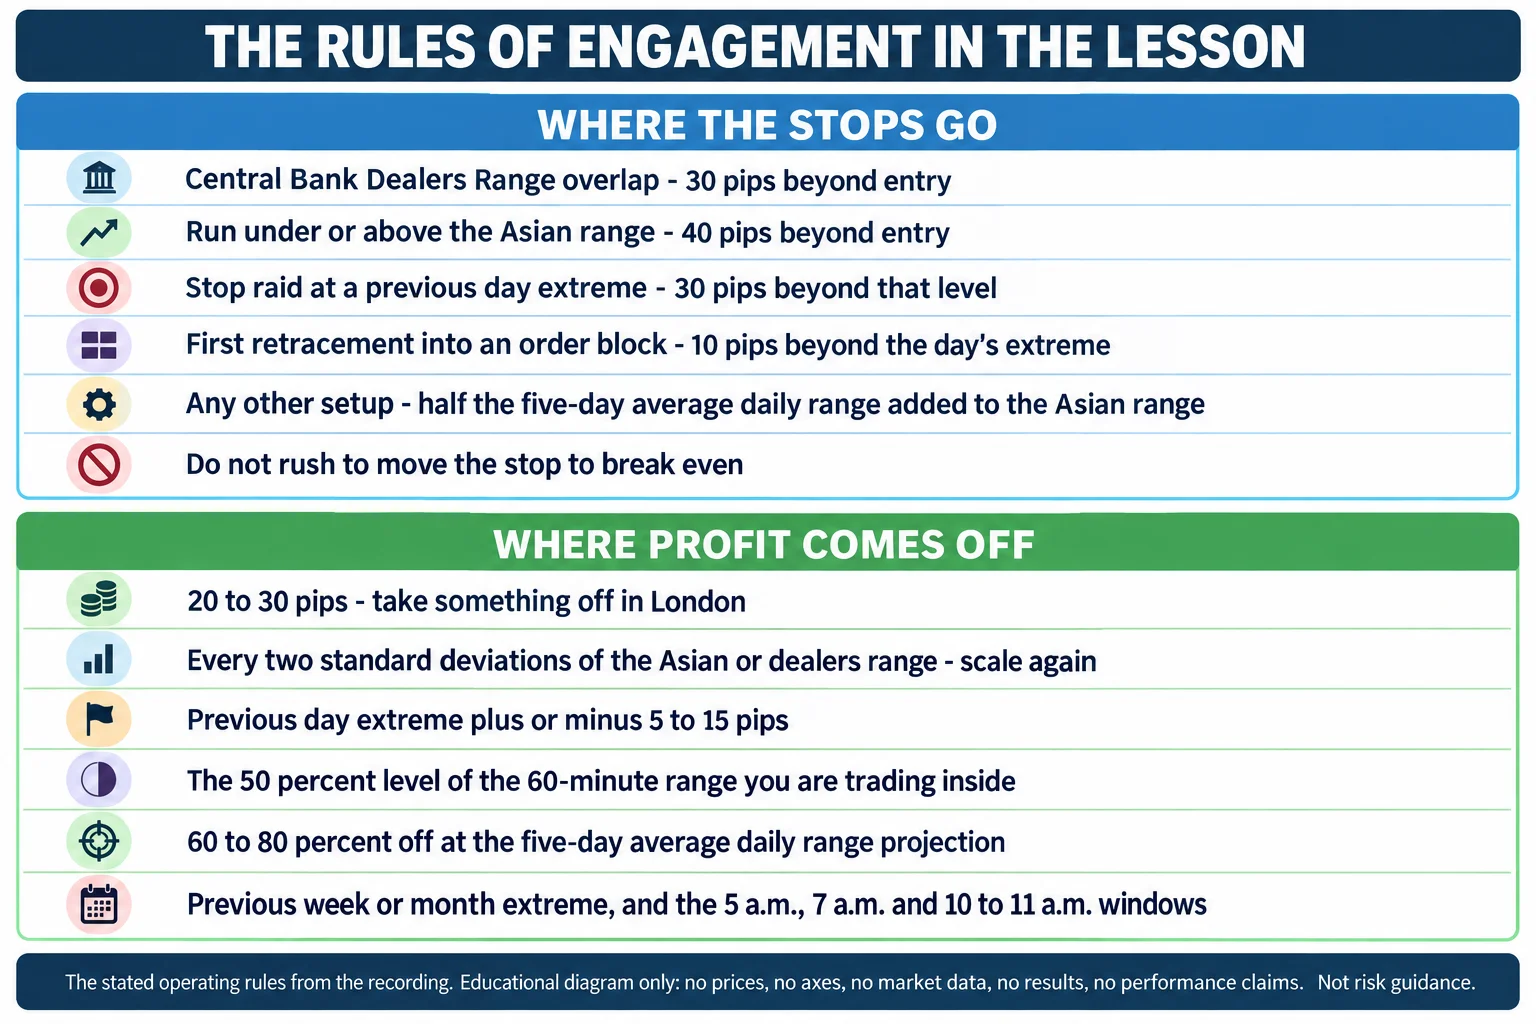
His first instruction is behavioural rather than numerical. Whatever initial stop is used, he says do not rush to move it: he anticipates viewers wanting to take it to break-even plus five or plus twenty and tells them to forget that in London day trading, because price can come back and knock them out and they miss the entire move (13:52, 14:13). His stated threshold for moving to break-even is 40 to 50 percent of the daily range; before that, he says, leave the stop where it is (14:14).
The distances themselves are attached to specific scenarios, and this is the part worth reading precisely because they are not interchangeable:
- Central Bank Dealers Range overlapping a PD array: 30 pips under the entry on the long side (14:29) and 30 pips above the entry on the short side (24:17).
- A run under the Asian range: 40 pips below the entry, with the range defined as anything below the Asian range low, whether that is half a standard deviation or a full one (14:39); mirrored as 40 pips above the Asian range high when shorting (24:26).
- A sell-stop raid: 30 pips under the low he is using as the entry, with that low itself the primary entry point and the entry placed below it (14:59); for a buy-stop raid, 30 pips above the high or the entry (24:31).
- The first retracement into an order block: 10 pips beyond the day’s extreme under the lowest low of the day for a long (15:22), or above the highest high for a short (24:42).
- The second return for stops, his turtle soup condition: 30 pips beyond the raided extreme (15:32, 15:52), and the mirror case on the short side where no immediate move lower has followed midnight (24:51).
- Any setup not covered above: half the five-day average daily range, subtracted from the Asian range low for a long (16:01, 16:22) or added to the Asian range high for a short (25:09).
He works the last rule through with a hypothetical: assume a 100-pip average daily range over the last five days, take 50 pips, and subtract that from whatever the Asian range low is. That is where the stop goes (16:12).
Profit Targets for ICT Daytrade Setups
The buy-side profit rules begin with a fixed first scale. He says to always try to take something off at a gain of 20 to 30 pips, and to always do it in London (16:27), then to scale something off at every two standard deviations of the Asian range or Central Bank Dealers Range, which he clarifies means waiting for two full standard deviations after the first 20 to 30 pips before taking the next portion (16:40, 17:00).
- The previous day’s high plus 5 to 15 pips, because he says it could turn into a turtle soup scenario and retrace on you (17:03); the equivalent on the short side is the previous day’s low minus 5 to 15 pips (25:38).
- The 50 percent level, or equilibrium, of the 60-minute range being traded inside, because he says equilibrium can be an impactful level and price could reverse there (17:13); stated the same way for shorts (25:45).
- 60 to 80 percent off at the five-day average daily range projection, which he says to always do. He explains the rule as a fallback: if nothing else has been hit (no two-standard-deviation move, no previous day’s high, no 50 percent level in the last 60 minutes), then the average daily range is the point at which at least 60 to 80 percent must come off, with a small portion left on in case more is available later in the day (17:35, 17:55, 18:16).
- Above the previous trading week’s high, and above the previous month’s high, because he says both can produce a turtle soup setup or a reversal (18:27); mirrored below the previous week’s low and the previous month’s low for shorts (26:02).
- Time-of-day exits: at or just above the 5:00 a.m. New York hour (18:41), at the short-term high forming before the 7:00 a.m. New York open because New York can be a reversal (18:51, 19:12), and between 10:00 a.m. and 11:00 a.m. New York during the rally (19:23). The short-side equivalents are the 5:00 a.m. window scaled out at or prior to it (26:18), the short-term low before the 7:00 a.m. open (26:25), and the 10:00 a.m. to 11:00 a.m. window while price is still declining (26:48).
He addresses the obvious objection himself: with only two positions how can a trader take this many portions off? His answer is that you cannot, and that not all the conditions can be present. The point is to look through the list before taking a trade, see which of them are potential candidates, and take profit on the ones that are there (19:49, 20:10).
He also notes two things the list leaves out. Any projection on the Fibonacci 127, 168 and 100 percent levels, or the 100 percent symmetrical price swing and measured move, would amplify these profit-taking points, but he says he did not include them because they were taught elsewhere and he did not want filler (27:30, 27:52). And the scaling framework is explicitly conditional: if you already took 20 to 30 pips in London and price then fulfilled the whole average daily range during London, you would not also take something off ahead of 7:00 a.m., because you have already taken profit against the average daily range being met (29:26, 29:46).
What ICT High Probability Setups Actually Claim
- Claimed as his operating rules: specific stop distances and specific profit-taking points for each named scenario, in both directions, with the timing filters and the range-size filters attached (14:29, 14:59, 15:22, 16:01).
- Claimed as method, not statistics: that these setups form several times a week and that something on the list appears in every London session (12:43, 13:05). No sample size, win rate or account result is given anywhere in the recording, so “high probability” is his framing rather than a measured property.
- Stated as a limitation: the list is not a panacea and not every scenario, that not all conditions can be present at once, and that some exits will be irrelevant to a given trade because the level is too distant or already reached (3:36, 19:55, 30:01).