
Key takeaways
ICT’s Central Bank Dealers Range, taught in lesson three of the April 2017 mentorship day trading model and re-released by The Inner Circle Trader on YouTube on 3 October 2022, defines a range from 2 p.m.
Read the full summary
ICT’s Central Bank Dealers Range, taught in lesson three of the April 2017 mentorship day trading model and re-released by The Inner Circle Trader on YouTube on 3 October 2022, defines a range from 2 p.m. to 8 p.m. New York time, ideally 20 to 30 pips and under 40 pips, then projects that same height one to four times above the high and below the low as so-called standard deviations rather than statistical deviations. ICT predominantly measures candle bodies because broker spreads can make wick highs and lows differ, although he calls the choice a judgment call. The projections require a directional bias and are intended to frame a possible London session high on bearish days or low on bullish days. He says typical extremes occur within three units, ideal setups often within one or two, while a fourth may correspond with high-impact London news or a New York reversal. Chart examples use 13, 58, 19, and 16-pip ranges, with the 58-pip range rejected as too large. Bias inputs include two-to-three-day and weekly targets, seasonal tendencies, quarterly shifts, and unmet premium or discount PD arrays, with Tuesday through Thursday preferred for a bullish one shot one kill weekly low. The approximately 16 minutes 30 seconds lesson provides no instrument names, sample size, hit rate, trades, account results, equity curve, or forward test, and ICT acknowledges that the examples can look cherry-picked in hindsight.
How we researched this article
BestProps used document-based research from primary firm sources, checked September 24, 2026. The complete source list, scope, limitations, and commercial-state record appear near the end of this article.
In ICT Mentorship Core Content – Month 08 – Central Bank Dealers Range, he opens by naming the recording as lesson three of the April 2017 mentorship content and part of the day trading model (0:15). The YouTube page for the re-release is dated 3 October 2022, so the spoken lesson and the upload date are five years apart; the teaching itself is the April 2017 session. He assumes the viewer has already seen his earlier YouTube tutorial on the same range and says this lesson covers substantially the same ground with the day-trading application (0:34).
How ICT Central Bank Dealers Range Projections Work
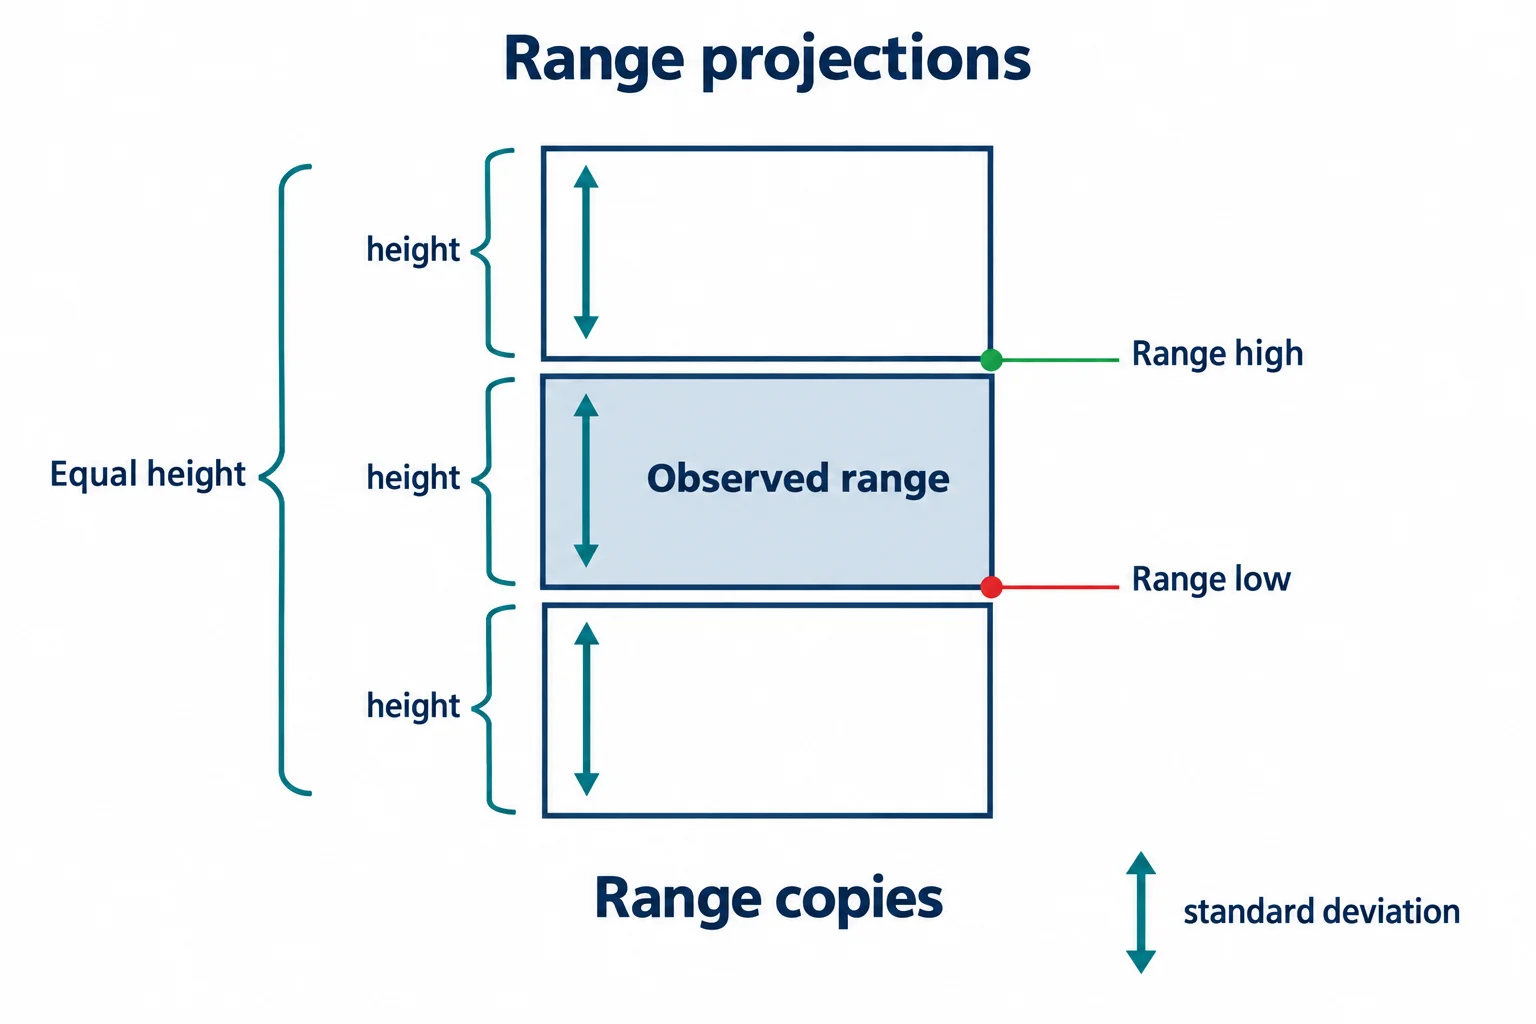
He starts from the general idea of a range with a high, a low and a height measured in pips, and then treats that height as a reproducible unit (1:01). One copy of the height is added above the range high and one copy is subtracted below the range low, giving what he calls one standard deviation either way. The next copy is measured from the first projection rather than from the original range, and he continues that stacking as far as four units (2:00, 2:27, 2:50).
The word matters less than the arithmetic. What the lesson actually performs is repeated addition and subtraction of the observed range height, not a standard deviation computed from a return series, a variance or a probability distribution. He does not present it as a statistical measure in that sense, and nothing in the recording tests the levels against a sample.
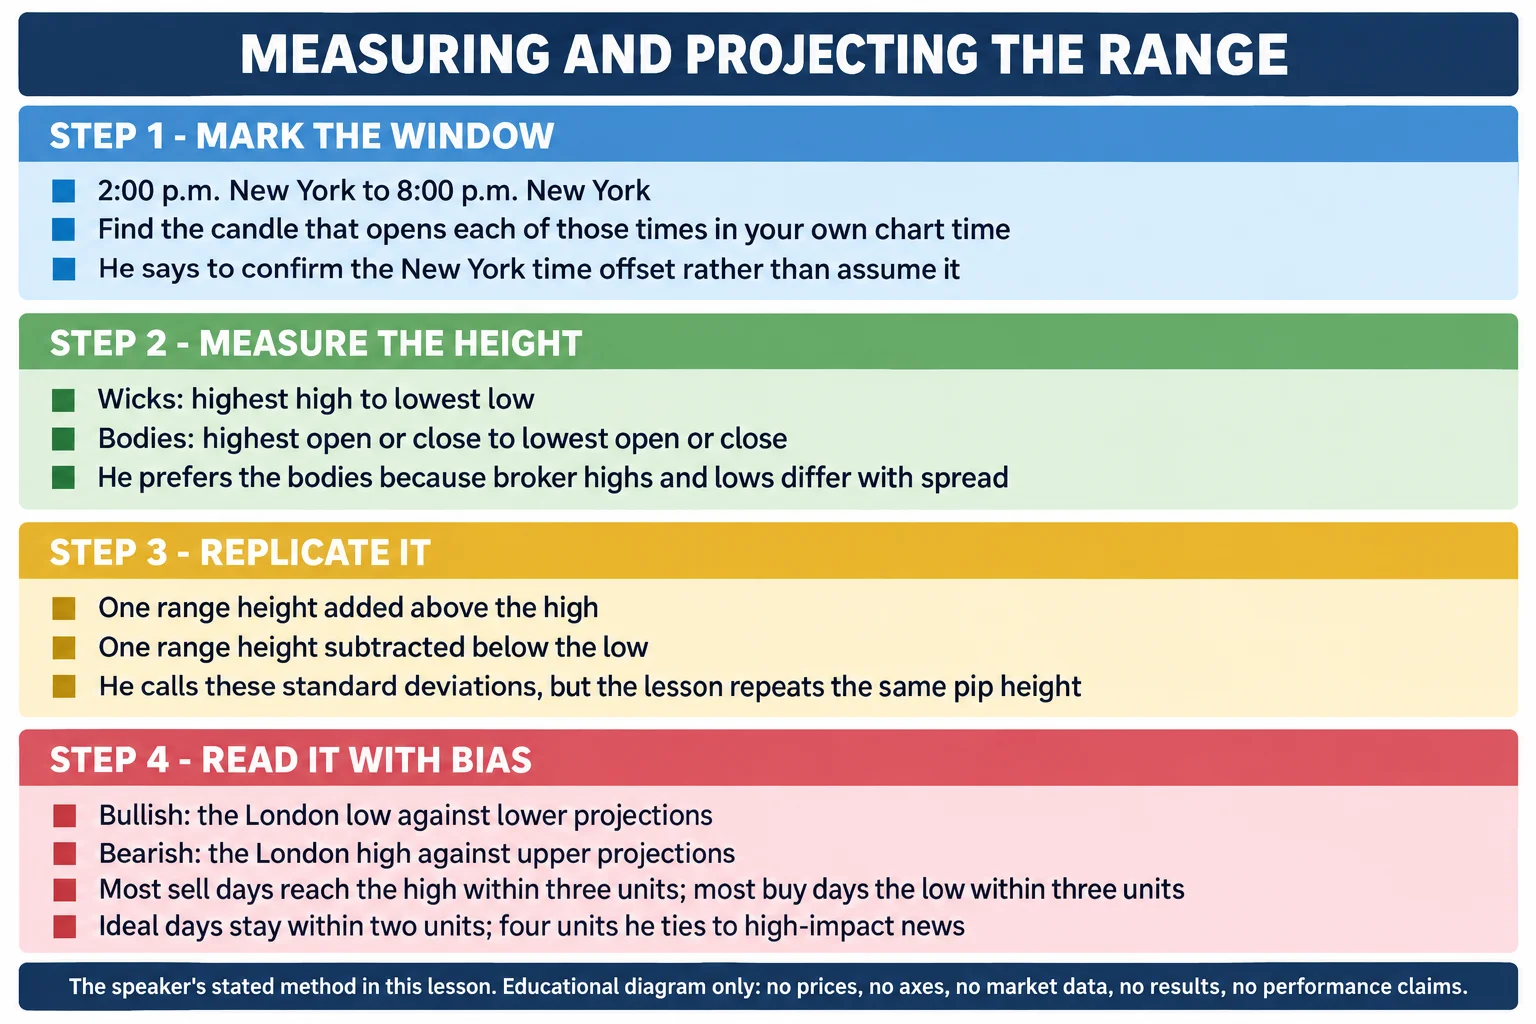
He then attaches rough behavioural expectations to the stacked levels, and this is where the lesson is easiest to overstate. He says most sell days put in the high of the day somewhere between the range and three units above it, that most buy days put in the low between the range and the third unit below, that his ideal sell day tops out within two units and often within one, and that his ideal buy day bottoms at least two units below and often just one (3:05, 3:27, 3:49). A fourth unit he ties to a high-impact news event in the London session, or to a possible New York session reversal profile (3:56, 4:17). Those are the speaker’s reported tendencies from his own experience. The recording gives no count of days, no instrument list and no measured hit rate, so they read as description of his model rather than as established frequencies.
ICT Central Bank Dealers Range Time Window and Size Filter
The operational rule is explicit: the range is the price action between 2:00 p.m. and 8:00 p.m. New York time (4:29). He tells viewers to work out what New York time corresponds to on their own platform and mark it with vertical lines at both hours, rather than assume the offset (4:54, 5:19). Inside that window the highest high and lowest low form the range (5:39).
He gives a size filter as well. Ideally the total range is less than 40 pips, and preferably no more than 20 to 30 pips high to low; he says a range larger than 30 pips tends to be unfruitful for the projections (4:43, 5:44). Further on he repeats that 20 to 30 is the ideal and that it generally has to stay under 40, and gives his reasoning: if the daily candle on the instrument being traded tends to run around 100 pips, then a third of that is roughly 33 pips, so a 20 to 30 pip range sits inside a typical day rather than consuming it (11:57, 12:22, 12:43). He adds that daily ranges are not always 100 pips, which is why he calls the figure a ballpark and a rule of thumb.
He also describes a bullish accumulation day in those terms: price opens, trades down 20 to 30 pips, ideally no more than 33 and not beyond 40, and closes higher, with the range used to help confirm the drop rather than to generate it (12:56, 13:16).
ICT Central Bank Dealers Range Candle Bodies and Wicks
The range can be measured either way. Calibrating from high to low uses the wicks; alternatively the highest body and the lowest body can set the boundary, taking the highest open or close and the lowest open or close in the window (6:04). He says he works predominantly from the bodies, and gives his reason: wicks reflect dealing spread at the broker, so every trader’s displayed high and low on a candle will differ, and using the body (in his phrase, the bulk of the trading) gets him closer, in his view, to what the larger participants are doing (9:01, 9:22, 9:43, 10:03). He also says he still looks at the ranges with wicks included, and describes it as a judgement call with no definitive answer (10:24). That is his stated rationale from his own study over two decades; the lesson offers no comparative test showing that body-based measurement performs better.
One caption detail is worth flagging. When he describes measuring the bodies, the auto-generated captions phrase the span in reverse order as “between 8 pm and 2 pm New York time” (6:22). His explicit statement of the window elsewhere in the same lesson, and the range drawn on screen, is 2:00 p.m. to 8:00 p.m. New York time, so the reversed phrasing reads as caption imprecision rather than a second, overnight window. He separately notes that 8:00 p.m. starts the Asian range (11:28).
Using ICT Central Bank Dealers Range With Daily Bias
The range is not offered as a standalone signal. He says plainly that a directional bias is needed for it to be of any assistance, and that it has to be used in conjunction with that bias (6:28). Its purpose in his words is to aid selection of the day’s low or high (6:40, 7:58). In a bullish context he looks for the low of the day in the London session and asks whether that day is a favourable one for the event to unfold; in a bearish context he looks at the upper projections for a London high (6:54, 15:34).
He is careful, by his own standards, about frequency. He says he does not trade every single day and that trying to trade every day is not productive (7:11). When the conditions he wants are present he says there is a reasonable expectation, better than most days, that the high or low forms in London, and that the range gives a ballpark idea of where it should form (7:23, 7:44). For a bullish “one shot one kill” week he says he would look for the low of the day in London, on Tuesday, Wednesday or Thursday preferably, though it could occur on Monday, and that wanting a bullish close every day does not by itself make it the highest probability setup (8:05, 8:26). Later he lists what he would weigh when forming that bias: where price is likely to go over the next two or three days, the present or coming week, seasonal tendencies, whether a quarterly shift is underway, and whether premium or discount PD arrays remain unmet (14:27, 14:47). Those concepts are named rather than defined here, so this lesson alone does not give a complete method for arriving at the bias; he says the next lesson will deal with picking the high and the low of the day using this range together with the Asian range (16:08).
ICT Central Bank Dealers Range Chart Examples
He walks through a set of marked-up charts. Each blue box he points to is a Central Bank Dealers Range for that day, with the day’s pip height noted beside it: 13 pips, then 58, then 19 and 16 in the same example (8:51, 10:06). In the first case the 13-pip height is duplicated upward, one unit and then a second measured from the first, and he says that takes the rate to the high of the day formed in London in the session immediately after the range closes; he adds that it does not have to call the level to the pip and may overshoot or fall short (10:42, 11:03, 11:26).
The 58-pip day he sets aside. He says it is too large under the criteria, that this is not what he taught in the free YouTube teaching, and that on such a day a day trader has to let the market do what it wants rather than apply this framework (11:50, 12:11). The last two examples are downward projections: one unit below, which he says created the low of the day inside the first deviation before price rallied, and then one and two units below, which took price to the London low with the projection off by a single pip (13:35, 13:59).
These are narrated charts, not results. The recording does not name the instrument or pair being shown, does not state the prices or the session dates on those charts, does not show entries, fills, position sizes or account outcomes, and the timestamps above point at his narration of the levels rather than at independently verified market data.
ICT Central Bank Dealers Range Hindsight Caveat
Immediately after the downward examples he says it looks like “cherry picking hindsight and all that business”, and then argues the point he wants the viewer to take: that price has to be read against a bias about where it is likely to go (14:19). The lesson’s own framing is therefore that the levels are a way of organising expectations, not evidence that a projection identifies a session extreme. On the bearish side he describes a premium PD array with bearish conditions as a setup for looking for lower prices and a lower weekly close, with one, two or three units of the range projected higher while the range is around 20 to 30 pips, and says that with such a projection into London he would have a great deal of advantage on his side that the high of the day forms in the London session (15:30, 15:50). That is his expectation, stated as an advantage rather than as a measured outcome, and it is the kind of claim the recording does not test.
ICT Central Bank Dealers Range Limits
- No performance evidence. There is no sample, no win rate, no equity curve, no fill report and no forward test. The pip figures are stated operating rules and narrated chart levels, not results.
- No instrument or price detail for the examples. The captions identify the pip heights of the marked ranges but not the pair, the prices, the dates of the charts shown, or the trades he refers to (10:06).
- No chart detail verified first-hand. The comments above rest on the spoken captions. Nothing here is a claim about what the on-screen candlesticks showed beyond what he says about them.
- Named but undefined concepts. Premium and discount PD arrays, the PD array matrix, quarterly shifts and seasonal tendencies are referenced as inputs to bias but not defined in this recording (14:50, 15:11).
A note on the transcript: this is an auto-generated caption track and it mishears several terms. It renders “ICT” as “ipta” (16:17), “sell days” and “sell dates” as “cell days” and “cell dates” (3:05, 3:27), “buy days” as “by days” and “on by days” (3:38, 4:08), “wicks” as “Wix” through the body-measurement section (9:10), “Central Bank Dealers Range” as “central thing deals range” (3:46), “the next is 19” as “the Nexus 19” (10:17) and “power of three” as “power three” (12:56). It also inserts repeated non-speech artifacts rendered as “foreign” where the audio is unclear (0:30, 1:31, 6:01). The labels used above are the ones the surrounding context supports; where the wording stays genuinely ambiguous the ambiguity is flagged rather than resolved.
Watch the Original ICT Central Bank Dealers Range Lesson
ICT Mentorship Core Content – Month 08 – Central Bank Dealers Range
The Inner Circle Trader · YouTube page dated 3 October 2022 · lesson three of the April 2017 mentorship content · about 16 minutes 30 seconds. This recording is the primary source for every timestamp link above.
The recording is not embedded here because the video owner has disabled playback on other websites. That was tested directly in a real player on 15 September 2026 from a BestProps page origin at both desktop and mobile widths: the iframe loads and then reports “Playback on other websites has been disabled by the video owner” with no duration and no playback progress. The video itself plays normally on YouTube, so no empty or half-working player is left on this page.
The watch page was read on 15 September 2026 and rendered as a public video: ICT Mentorship Core Content – Month 08 – Central Bank Dealers Range by The Inner Circle Trader, upload date 3 October 2022, listed duration 990 seconds and neither private nor unlisted. The caption track used for this article covers about 989 seconds, matching the listed duration within a second.
ICT Central Bank Dealers Range Resources
These are the sources checked for this article. The regulator and investor-education pages are general material about day trading and about trading systems sold to the public; neither assesses the speaker, verifies any level, pip figure or window above, nor endorses anything said in the recording. Any ICT, smart-money or third-party indicator, script, note set, transcript pack, chart annotation or re-upload circulating outside the publishing channel’s own page is unofficial and untested here.
- [1] ICT Mentorship Core Content – Month 08 – Central Bank Dealers Range The Inner Circle Trader (primary source; watch page read 15 September 2026, 990 seconds).
- [2] The Inner Circle Trader (official YouTube channel) (read 15 September 2026).
- [3] Investor.gov (SEC), Day Trading (read 15 September 2026), the regulator’s definition, which states that day trading is extremely risky and can result in substantial financial losses in a very short period of time. Relevant to a lesson built entirely around intraday session extremes.
- [4] CFTC, Fraud Advisory: Commodity Trading Systems Sold on the Internet (read 15 September 2026), the regulator’s guidance on evaluating trading systems sold to the public, including its warnings about hypothetical results calculated from prices that occurred in the past.
Source: ICT, ICT Mentorship Core Content – Month 08 – Central Bank Dealers Range, The Inner Circle Trader, YouTube page dated 3 October 2022, lesson three of the April 2017 mentorship content. Automatic YouTube captions were the transcript used for this article; that track mishears several terms as listed above, and the labels used are the ones the surrounding context supports. The window, pip thresholds, projection method and reported tendencies are the speaker’s stated rules and interpretations, reported with no fills, no sizes, no instrument list and no account results, and the on-screen charts were not independently verified. This commentary is educational and is not investment advice.