 Futures
 Forex
 Crypto
 Perpetuals
 Interactive
 Calculators
 Guides
 About BestProps

How we researched this article
BestProps used document-based research from primary firm sources, checked September 24, 2026. The complete source list, scope, limitations, and commercial-state record appear near the end of this article.
In ICT Mentorship Core Content – Month 08 – Essentials To ICT Daytrading, he names the recording as April 2017 content for the ICT mentorship and lesson one of the day trading model (0:32). The YouTube page for the re-release is dated 2 October 2022, so the upload is five years after the spoken session; the teaching is the April 2017 lesson. He frames the month around capitalising on the movement inside a single 24-hour period, and immediately separates the name from the practice: day trading, he says, does not equate to everyday trading, and not all dates are ideal (0:43, 1:08). He gives his own average as two primary setups per trading day, with the detail promised for the next lesson (1:30, 5:25).
ICT Daytrading Daily Range Trade Targets
His stated objective is to capture at least 65 to 70 percent of the daily range, accepting that a little is left near the extreme (1:47). The expected size for the coming day is the largest move of the last five days, averaged (2:13, 2:33). He adds that there are times he teaches where the average daily range can be doubled, or expected to be more than doubled, in a single day (2:34).
It is worth stating plainly that this is a trailing average and not a forecast of what must happen. Averaging five past daily ranges describes what the instrument has recently done; it does not establish how far the next session will travel, and nothing in the recording tests it as a predictor. His framing of a partial capture is a restraint message rather than a target to hit: he walks through a 120-pip average day that delivered 100 pips where he took 30 or 40, and calls that successful rather than a missed opportunity (5:42, 6:02).
He reinforces the point about activity, arguing that more trades do not mean better results and that volume is not the answer to profitability (6:28). The stop-loss argument sits next to it: he presents day-trade entries as a way to limit the stop on all trades, and says the same technique can lower initial risk on longer-horizon position or swing trades and on one-shot-one-kill setups (3:26, 3:48). He describes the usual target as three-to-one or five-to-one and claims that overlapping a day-trade entry with a higher-time-frame setup can produce multiples in the double digits very easily (4:56). Those are his stated expectations for his own framework; the recording shows no completed trade, no fill, no position size and no account result, so the multiples are not something this lesson establishes.
Essential ICT Daytrading Entry Setups
Directional bias, in his words, frames a large portion of all day-trade setups, and the ideal is to trade in the direction of the weekly time frame (2:45, 3:06). He says the more higher-time-frame ideas support a day trade the better, and that his first concern is higher-time-frame institutional order flow read from monthly, weekly and daily PD arrays over the last 20, 40 and 60 trading days (3:14, 7:37). For day trades he says the daily chart is generally enough, because something on the daily will usually line up with a premium or discount array (7:56, 8:17).
He describes what the interbank price delivery algorithm is doing in his model, and it is worth marking as methodology rather than mechanism: it seeks new levels of liquidity, so he reads the weekly candle direction and blends that with where he expects liquidity to be taken above or below price (8:22, 8:35, 8:55, 9:15). He states the day of the week as paramount to understanding day trading, because some days carry higher probability, some can behave contrary to expectation, and others are predisposed to be quiet (9:34). Time of day he calls absolutely paramount (9:57).
The order he describes:
- Read higher-time-frame context, working primarily from the daily chart (7:37, 8:05).
- Find the premium and discount PD arrays across the last 20, 40 and 60 trading days (7:42).
- Forecast the present or next weekly candle against those arrays (8:53, 9:16).
- Apply the day-of-week profile, then the specific time window (9:34, 9:57).
- Take the setup only inside that window, and stand down on his no-setup days (6:50).
- Reassess when price reaches a higher-time-frame array that opposes the premise (26:57).
ICT Daytrading No-Trade Days and the 80 Percent Rule
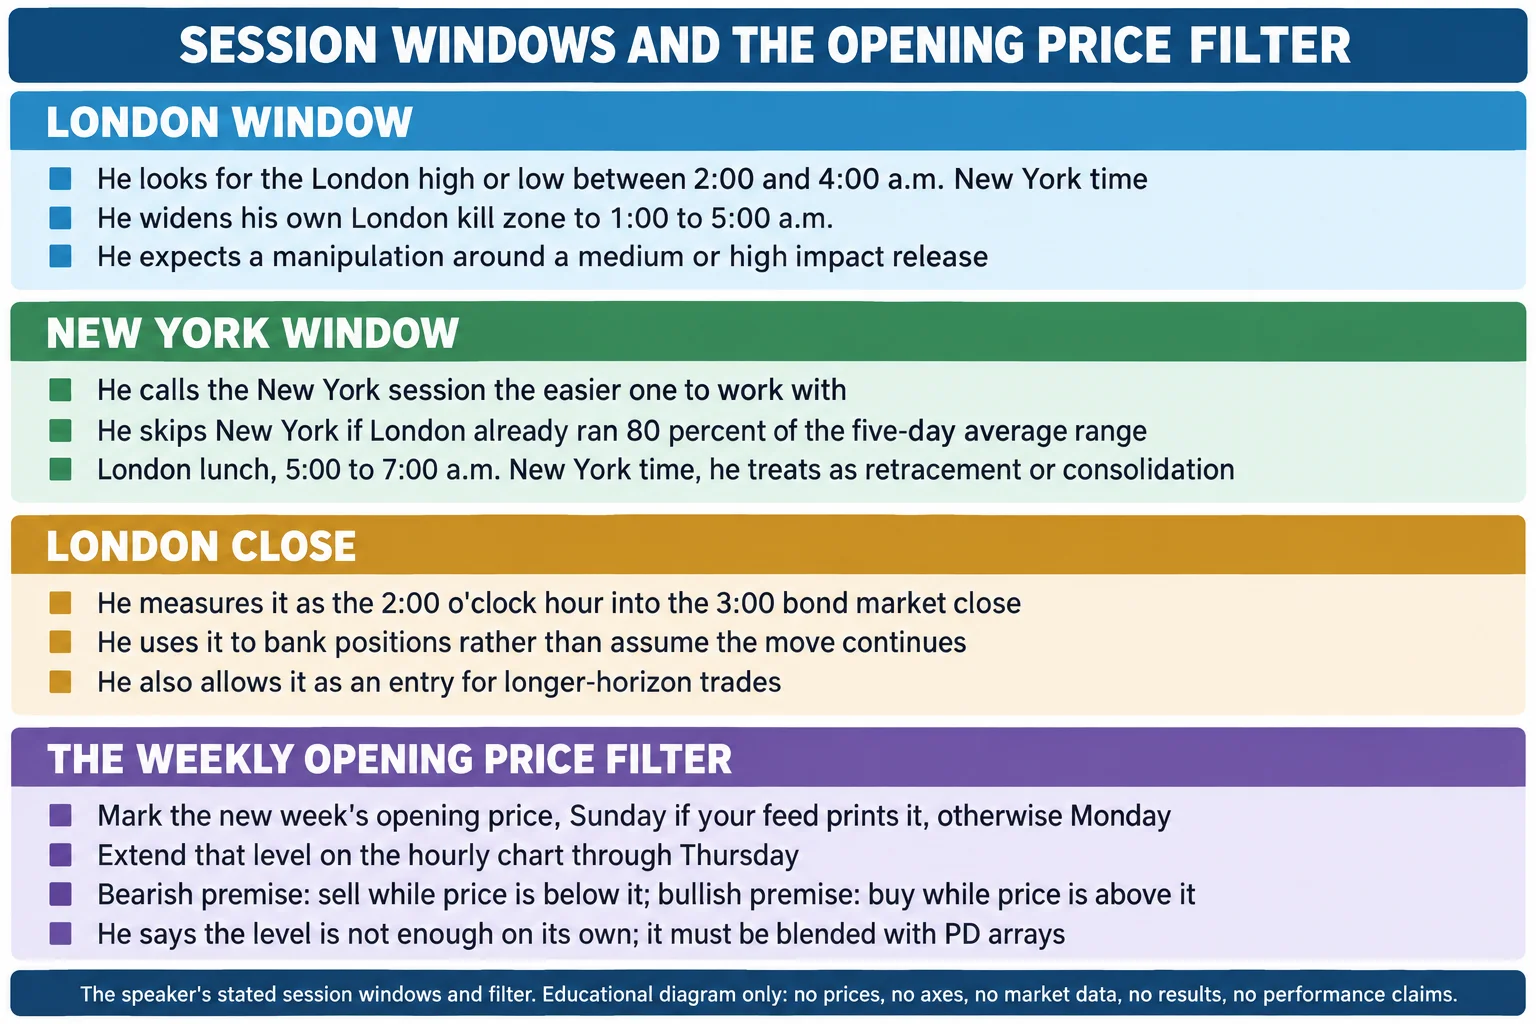
Two exclusions are stated directly. FOMC days and non-farm payroll days keep him on the sidelines and are what he calls a no-setup day; he says being able to forecast analytically where price may go does not justify participating in them (6:50, 7:12). The second applies to New York: if London has already delivered 80 percent of the five-day average daily range, he says to move to the sidelines and not even consider trading New York, because it will probably go sideways or catch a trader in an unexpected reversal (13:55, 14:17).
Essential ICT Daytrading Session Windows
All times in the lesson are New York time (11:45). For London he names 2:00 to 4:00 a.m. as the usual hot spot for the day’s high or low, notes that it can shift earlier or later with the economic calendar and daylight saving transitions, and says he widens his own London kill zone to 1:00 to 5:00 a.m. so nothing escapes him (11:38, 11:57, 12:17, 12:39). He looks for a manipulation just before or at a medium or high impact release and treats the setup as appearing after it (12:44).
The New York session he calls primarily the easier one to work with, and the reason he gives is that London demands a better understanding of how the daily range forms inside the weekly and monthly ranges (13:00, 13:39). London close he measures as the two o’clock hour running into the three o’clock bond market close, which is where he places the end of the New York session on FOMC days (15:32, 15:53, 16:13). He says London close is where he banks positions, and that it can also serve as an entry for longer-horizon trades rather than only as an exit (14:54, 15:17).
Two further windows are treated briefly. The Asian session open he puts around 8:00 p.m. New York time, where he looks for small setups, and he notes that yen, Aussie and Kiwi pairs can form an important daily high or low there rather than in London (16:31, 16:53). London lunch, 5:00 to 7:00 a.m. New York time, he describes as the market going quiet and preparing for the next leg, with behaviour splitting between retracement and consolidation, and he says he takes something off a London position at or just before 5:00 a.m. in case of a lunch reversal or a deeper retracement (17:20, 17:46, 18:00, 18:20, 18:43).
ICT Daytrading Weekday Trade Profiles
He gives each day a characteristic, as his own reading rather than a measured distribution (19:05):
- Sunday: he generally opts out because the usable range is too small, being only a couple of hours, and says traders whose feed prints no Sunday candle should fold it into Monday’s data (19:18, 19:38).
- Monday: generally a small range, with the exception he flags as a tip for one-shot-one-kill work. A large-range Monday running into a premium daily array can mark the high of the week, and a large-range Monday down into a discount array can mark the lowest low (19:45, 20:06, 20:28).
- Tuesday: his stated best day for the specifics, with a 77 percent figure for bullish weeks creating the low of the week in London and 70 percent for bearish weeks creating the high (20:51, 21:13). Those percentages are given in the captions with no dataset, sample or test method attached, so they are his stated figures rather than validated statistics.
- Wednesday: the ideal scenario, because Monday and Tuesday are behind the trader and give context going into London and New York (21:24, 21:44).
- Thursday: generally ideal but to be treated with care, because he says Thursdays can reverse the week and that the weekly range is usually capped by Thursday’s New York session (21:53, 22:13).
- Friday: typically a small range as the week closes, but he allows a surprise expansion if a PD array objective has not been met by Thursday, which makes it a toss-up depending on what the weekly range has already delivered (22:21, 22:41).
ICT Daytrading Weekly Open Trade Filter
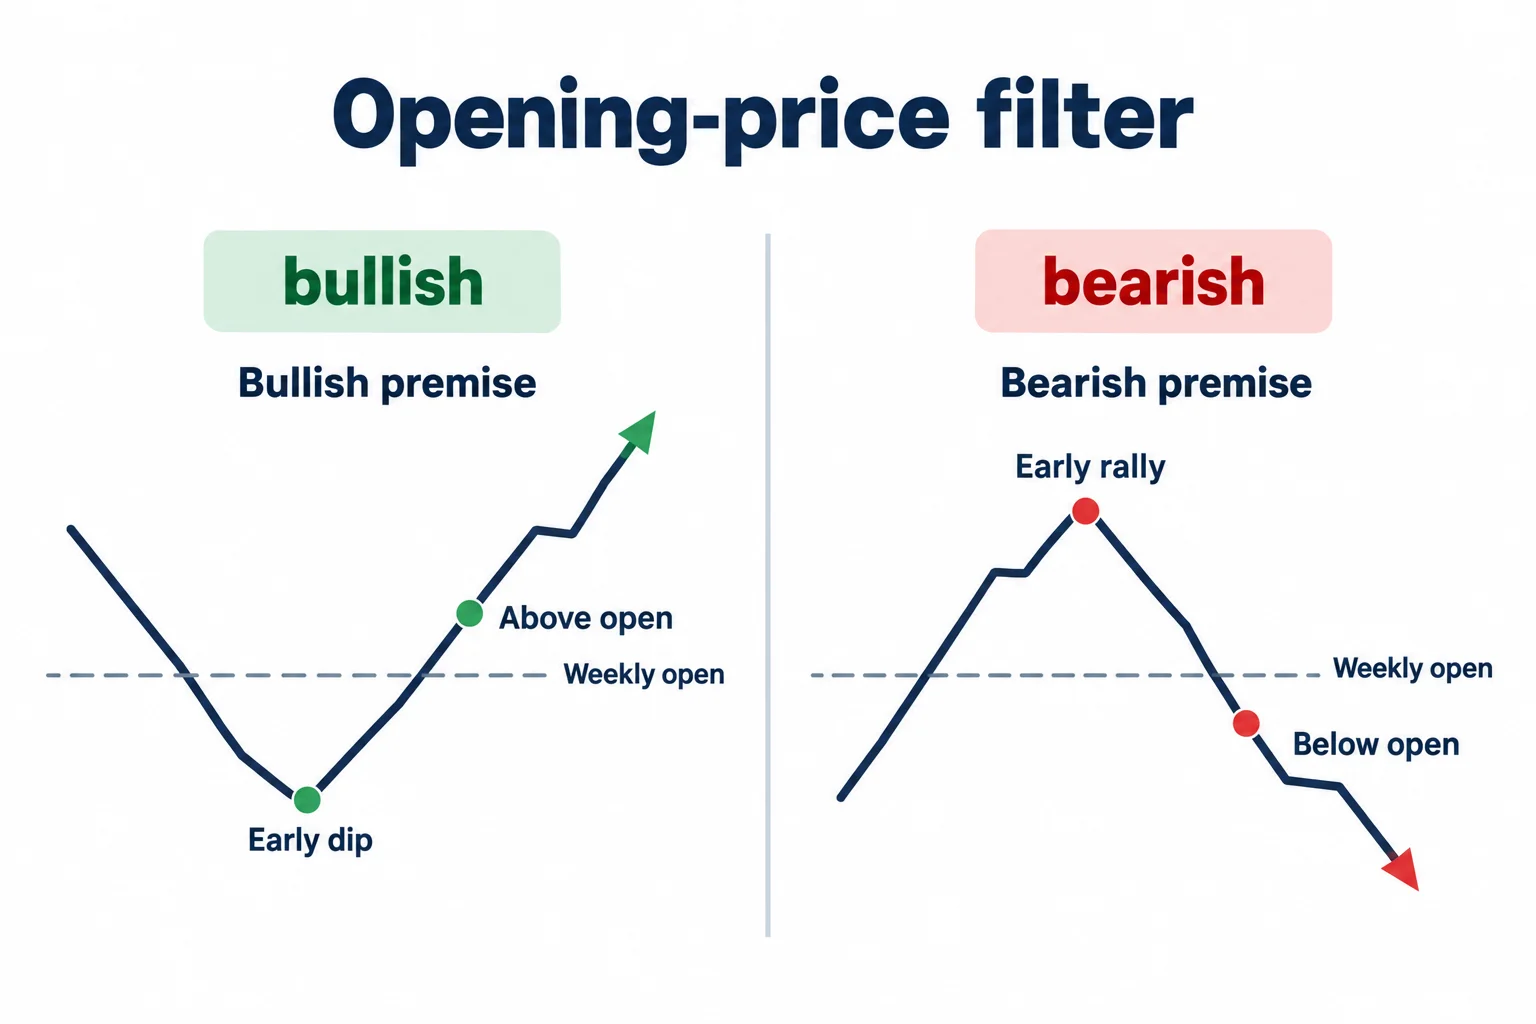
The construction is simple. He marks the new trading week’s opening price on Sunday, or Monday’s opening for a feed that prints no Sunday candle, and draws that level forward on the hourly chart all the way to Thursday (23:09, 23:30). He stops at Thursday because his own Thursday profile allows a reversal to unfold, and he says a move back through the level during Thursday frames what he calls a high-probability reversal confirmation (23:53, 24:13).
On a bearish weekly premise he looks for price to trade above the opening price early in the week, which he reads as the manipulation or Judas swing away from an already fulfilled premium array, and then sells day trades while price stays below that level through the week (26:11, 26:32, 26:53). On a bullish premise he reverses it: price trading below the level early, while the daily chart sits at a discount array, sets up buying while price holds above it, looking for the London low and a New York continuation through the week (28:11, 28:34, 28:55, 29:15).
The caveat is the part he stresses. The filter holds only until price reaches a higher-time-frame PD array contrary to the direction being worked, at which point he expects a potential intra-week reversal and changes gears (26:57, 28:09). He ties a move back through the weekly opening on Thursday to an intermediate-term reversal and says that changes what he expects to do on Friday and into the following week, rather than being a signal in itself (24:30, 24:50, 25:19).
He then states the obvious objection himself (that being above or below the opening price is trivially visible) and answers that the level is only useful combined with the daily PD arrays and the expected weekly profile (25:08, 44:50).
He also describes the weekly shape the filter is working with, on a bullish candle whose open sits near the week’s low and whose close sits near the week’s high, the operating range being that opening price through Friday’s close (31:28, 32:16, 32:38). On that structure he counts five weekday opportunities, and says he would call roughly nine setups genuinely solid, adding that he does not rush a London setup on Monday unless a big range has already started out of the gate from Sunday into Frankfurt (32:45, 33:05).
ICT Daytrading GBP/USD Trade Examples
The lesson closes with the cable, shown on weekly and daily charts (35:01). He sets out the purpose of the examples and, just before them, the limits of the approach: some weeks are small and the candles wick high and low around a tiny body, and those can be challenging; a trader will break his own rules or the market simply will not do what was hoped; and no one makes money every week, day or month. He then adds his own defence of the framework, that on a large-scale probability spectrum he finds more opportunities with this criteria than any other discipline gives him (29:31, 30:45, 31:05). That last sentence is his own comparative claim about his method. Nothing in the recording measures it against another approach.
- First example: a daily rejection block as the premium array with an old low as the discount array, and the week’s opening price drawn through Thursday so the days are separated on the chart (35:08, 35:29). Price traded up into that rejection block above Sunday’s opening, then went softer from Monday; a sell-off came after the Monday-to-Tuesday transition into consolidation (35:45, 36:05).
- Second example: a daily rejection block as the premium array with a bullish order block as the discount array (37:48). Price shot out of the gate on Monday, traded higher, sold off again in London on Tuesday and then traded down through the opening price (38:08).
- Third example: a bullish order block as the discount array with an old high or equal highs as the premium array (41:39). Price went up a little on Monday, traded down into the bullish order block, rallied, made one more attempt lower on Tuesday into the same array, and then expanded up through Sunday’s opening (41:54, 42:15).
The teaching point of the second example is the one he repeats. After price traded down through Sunday’s opening, the mechanical reading was to sell, but it had traded into a fair value gap and a daily discount bullish order block, which he describes as stopping it dead. Because the array was discounted it acted as support, so he says a seller could not be short in that particular setup; the expectation became a reversal, and he then drops the opening-price filter and works from the weekly profile instead (38:26, 38:46, 39:06, 39:28). He states the general rule from it: when price trades down into a daily discount array and it holds, the array resists lower prices and it will still paint patterns that look like short setups to a retail reading before the market turns higher (40:51, 41:11).
The first example carries the concrete numbers he gives. With the premise bearish below Sunday’s opening after price had traded into the daily rejection block on a premium basis, his stated short objectives were 1.2420, 1.2375 and 1.2310. He reports that 1.2310 was not reached but 1.2375 was, and that the week’s low was 1.2365, which he describes as ten pips below the low of the old low discount array (37:05, 37:28). He also describes the Wednesday behaviour as price being held at 1.2430 on Tuesday and Wednesday before rallying, and a Thursday high that exceeded Wednesday’s consolidation before being rejected and sold off on the non-farm payroll Friday (36:38, 37:00). These are levels and outcomes he reports from his own marked-up charts. The recording does not show fills, position sizes or account results, and the chart levels were not independently verified.
The third example is used to show the overlap. The week before the one under discussion had rallied into daily equal highs, and he says the failure swing around 1.2590 created the high of the week on the Tuesday, which is why the following week’s high formed on the Monday and Tuesday rather than later (43:46, 44:07). He also points out that in that example the weekly range was capped by Thursday’s New York session and Friday was quiet, which is the Friday profile he had described earlier in the lesson (43:31).
What the ICT Daytrading Lesson Does Not Prove
- No performance evidence. No sample, no win rate, no equity curve, no fill report and no forward test. The pip figures and the 65 to 70 percent objective are stated targets, not results (1:47).
- The 77 and 70 percent weekday figures are unsupported in the recording. They are given as statements about Tuesday with no dataset, no sample size and no method (21:01).
- The chart levels are his narration. The objectives and the week’s low in the first example come from his own chart reading, and the instrument is identified only as the cable, with no session dates for the individual charts shown (35:04).
- No first-hand chart verification. The comments above rest on the spoken captions. Nothing here is a claim about what the on-screen candlesticks showed beyond what he says about them.
- PD arrays are assumed, not defined. He states at the outset that he assumes the viewer already knows what a PD array is and how to read the last 20, 40 and 60 trading days, so this lesson supplies no definition of rejection blocks, order blocks, fair value gaps, liquidity voids or the PD array matrix (7:53).
- The execution detail is absent. Entry technique for the setups is deferred to a later lesson in the same month (4:45).
A note on the transcript: this is an auto-generated caption track and it mishears several terms. It renders “ICT” as “ipta” and “ifta” (7:13, 8:58), “PD arrays” as “PDA rays” and similar (9:01), “IPDA ranges” as “if the data ranges” and “the data ranges” (6:42, 9:05), “Asian range” as “H in range” in one place, “sell” as “cell” (37:08, 41:14), “trader” as “traitor” (16:58), “Sunday’s” as “suddenly” (26:11), “intra-week” as “intro week” (24:38) and “my time” as the speaker refers to New York in the London-lunch discussion (18:18). It also inserts repeated non-speech artifacts rendered as “foreign” where the audio is unclear (15:31). The labels used above are the ones the surrounding context supports.
Watch the Original ICT Daytrading Lesson
ICT Mentorship Core Content – Month 08 – Essentials To ICT Daytrading
The Inner Circle Trader · YouTube page dated 2 October 2022 · lesson one of the April 2017 mentorship content · about 46 minutes 38 seconds. This recording is the primary source for every timestamp link above.
The recording is not embedded here because the video owner has disabled playback on other websites. That was tested directly in a real player on 15 September 2026 from a BestProps page origin at both desktop and mobile widths: the iframe loads and then reports “Playback on other websites has been disabled by the video owner” with no duration and no playback progress. The video itself plays normally on YouTube, so no empty or half-working player is left on this page.
The watch page was read on 15 September 2026 and rendered as a public video: ICT Mentorship Core Content – Month 08 – Essentials To ICT Daytrading by The Inner Circle Trader, upload date 2 October 2022, listed duration 2,797 seconds and neither private nor unlisted. The caption track used for this article covers about 2,798 seconds, matching the listed duration within a second.
Essential ICT Daytrading Resources
These are the sources checked for this article. The regulator and investor-education pages are general material about day trading and about trading systems sold to the public; neither assesses the speaker, verifies any window, pip figure or level above, nor endorses anything said in the recording. Any ICT, smart-money or third-party indicator, script, note set, transcript pack, chart annotation or re-upload circulating outside the publishing channel’s own page is unofficial and untested here.
- [1] ICT Mentorship Core Content – Month 08 – Essentials To ICT Daytrading The Inner Circle Trader (primary source; watch page read 15 September 2026, 2,797 seconds).
- [2] The Inner Circle Trader (official YouTube channel) (read 15 September 2026).
- [3] Investor.gov (SEC), Day Trading (read 15 September 2026), the regulator’s definition, which states that day trading is extremely risky and can result in substantial financial losses in a very short period of time. Relevant to a lesson that opens by acknowledging day trading is the hardest time frame to trade.
- [4] CFTC, Fraud Advisory: Commodity Trading Systems Sold on the Internet (read 15 September 2026), the regulator’s guidance on evaluating trading systems sold to the public, including its warnings about hypothetical results calculated from prices that occurred in the past.
Source: ICT, ICT Mentorship Core Content – Month 08 – Essentials To ICT Daytrading, The Inner Circle Trader, YouTube page dated 2 October 2022, lesson one of the April 2017 mentorship content. Automatic YouTube captions were the transcript used for this article; that track mishears several terms as listed above, and the labels used are the ones the surrounding context supports. The windows, thresholds, weekday profiles and the opening-price filter are the speaker’s stated rules and interpretations, reported with no fills, no sizes and no account results, and the chart levels in the worked examples were not independently verified. This commentary is educational and is not investment advice.