
Key takeaways
This is the second lesson of ICT’s short-term trading module, and it is a classification exercise rather than a set of entry rules: he walks through the recurring weekly range profiles and names the day each weekly extreme is said to form.
Read the full summary
This is the second lesson of ICT’s short-term trading module, and it is a classification exercise rather than a set of entry rules: he walks through the recurring weekly range profiles and names the day each weekly extreme is said to form. The classic Tuesday low of the week is a bullish premise — price hovers above a higher-timeframe discount array on Monday, then drops into it on Tuesday from the London open or the New York session (1:12) — and the Tuesday high is its bearish mirror, with price rising into a premium array (1:54). The same two shapes can arrive a day later on Wednesday (3:04), and he attaches one caveat to both: the London-session extreme can be run out during New York and the weekly extreme still form afterwards (2:23). Consolidation Thursday reversals expect Monday-to-Wednesday consolidation, a run beyond the developing weekly low or high, and rejection, which he links to market-driver news or a rate release late in the New York session around 2 p.m. (5:16). Midweek continuation profiles treat a Monday-to-Wednesday pause as a base for expansion into Friday (6:34), and the Friday he calls Seek and Destroy is described as neutral or low probability, tied to rate announcements or non-farm payrolls and avoided in July and August (7:57). He finishes by asking students to classify weeks on an hourly chart and look for the conditions he outlined beforehand (10:16). The recording states no prices, fills, risk rules or results, and nothing here is advice.
How we researched this article
BestProps used document-based research from primary firm sources, checked September 24, 2026. The complete source list, scope, limitations, and commercial-state record appear near the end of this article.
In ICT Mentorship Core Content – Month 07 – Short Term Trading Defining Weekly Range Profiles, the lesson is introduced as the second of the short-term trading module and, in his words, March 2017 mentorship content (0:10); its subject is stated as defining the weekly range profiles (0:16).
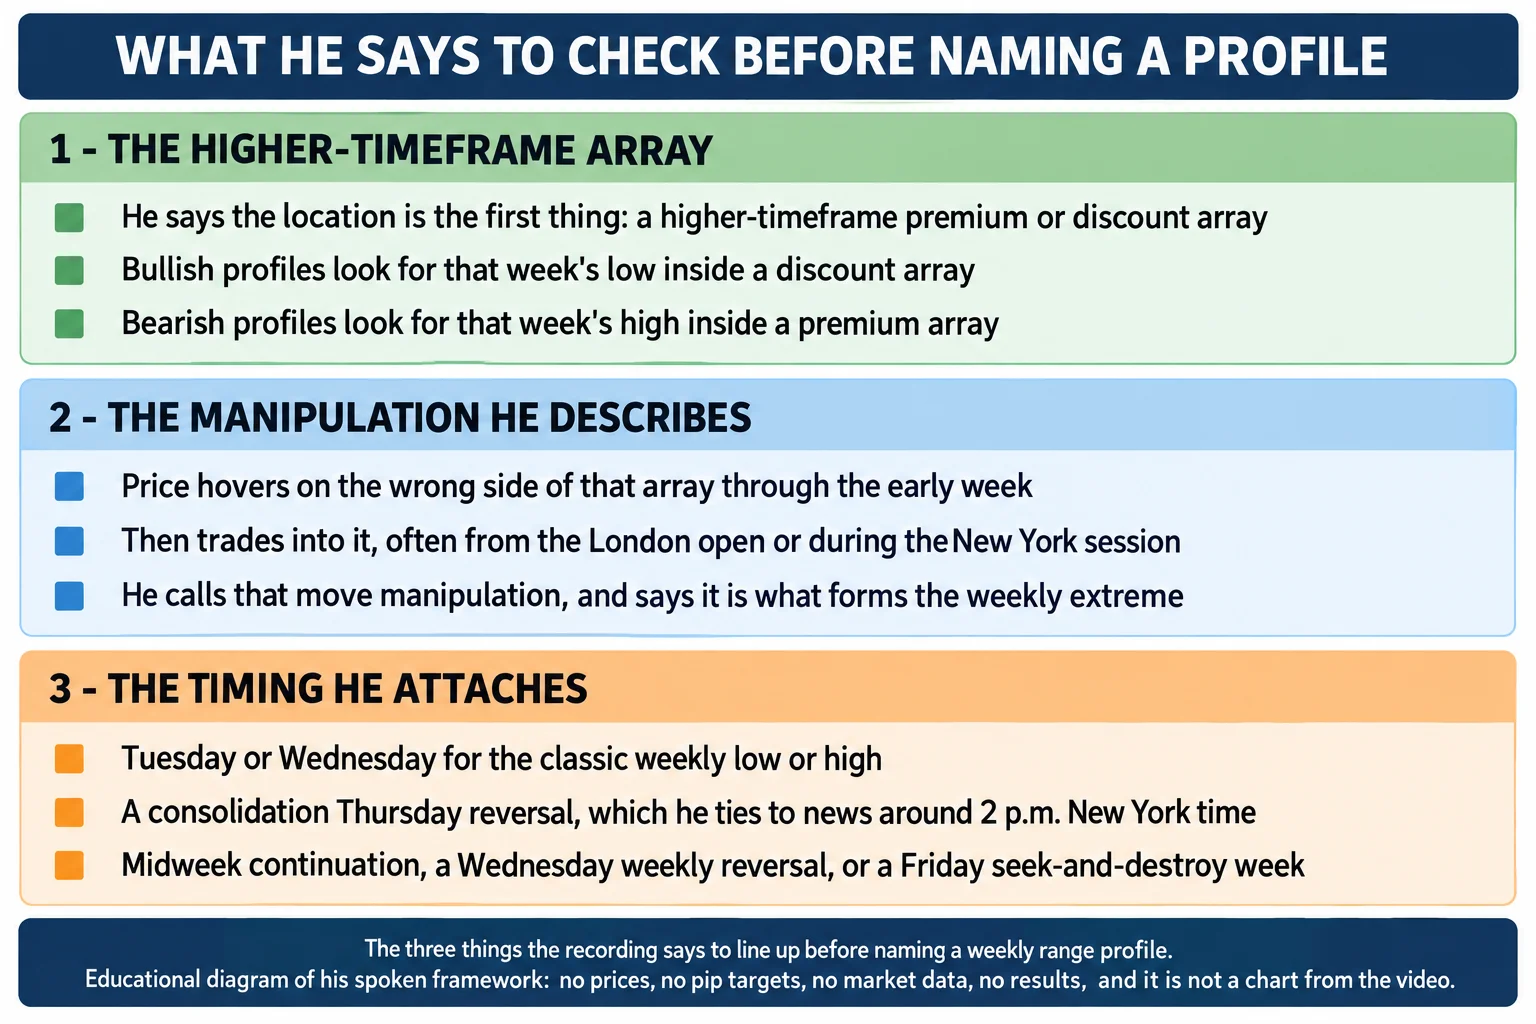
He opens with a warning about how the material is likely to read. He says that if you go through it quickly and without paying much attention it will look ambiguous and seem unfruitful, and that its impact is shown and solidified by going through price data and seeing the profiles unfold in hindsight — how they operate, how they unfold, and the conditions he describes as generally precursors to them performing (0:25).
Two limits are worth stating before the profiles themselves. He does not define premium or discount arrays here, and the transcript contains no price levels, no entries, no risk rules and no results. Every profile below is his stated classification, not a measured pattern.
The classic Tuesday low and high of the week
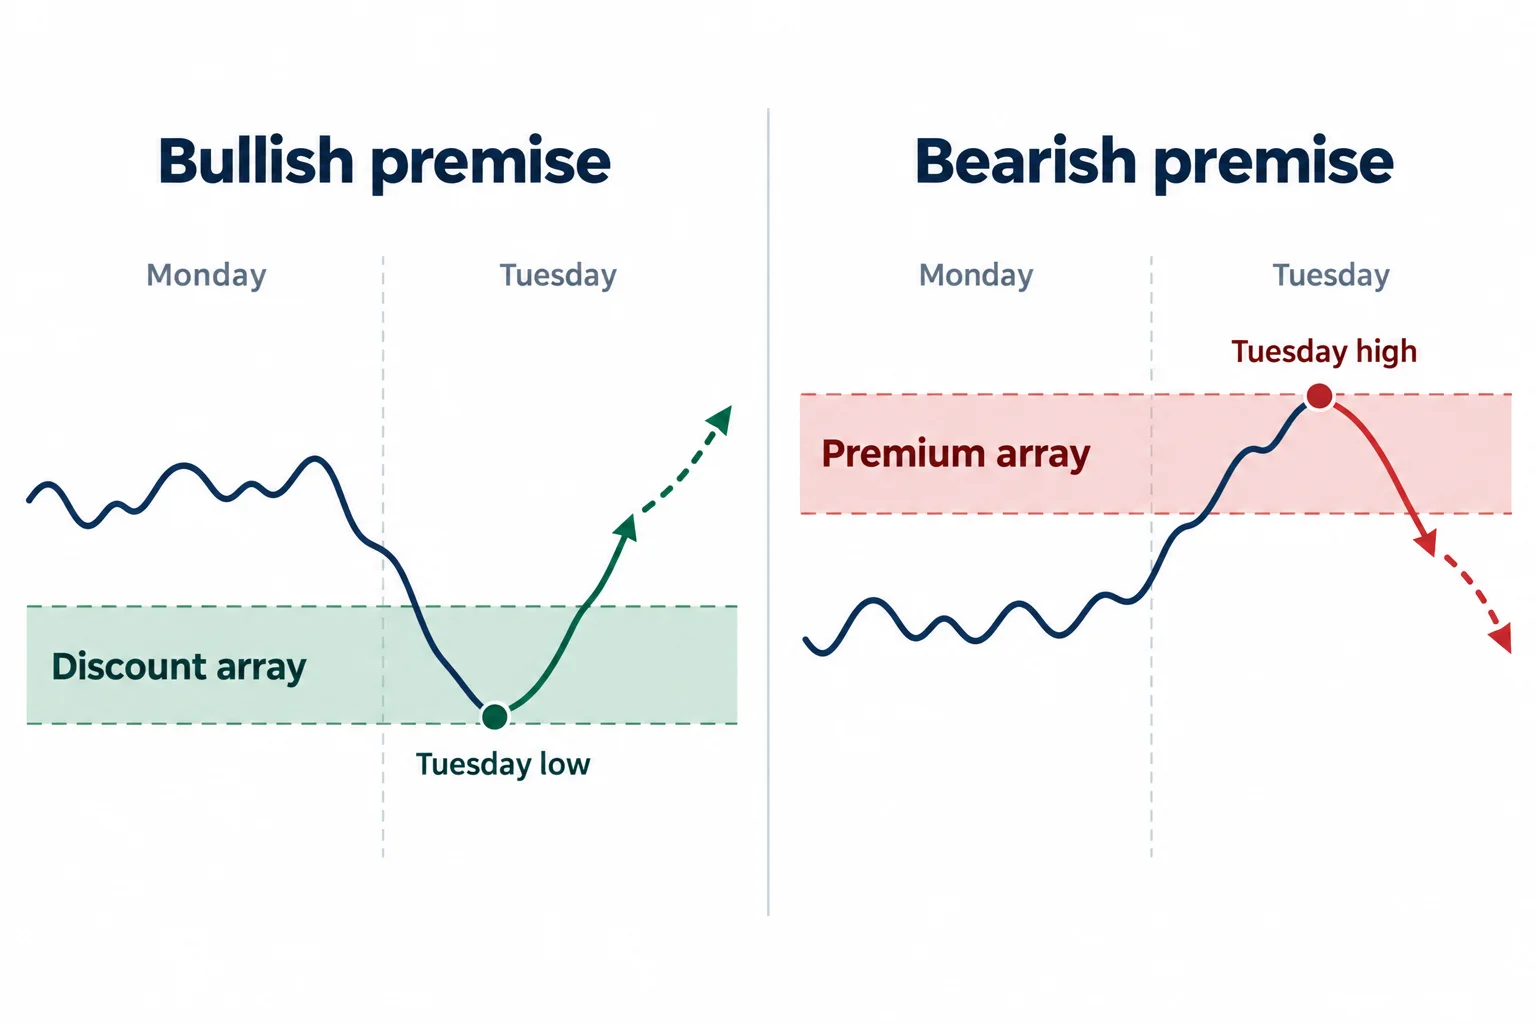
The first profile is the classic Tuesday low of the week. He calls the week generally bullish, so the directional premise is already higher prices, and the manipulation he is looking for is price hovering above a higher-timeframe discount array on Monday and then dropping into that array on Tuesday to form the low of the week. To anticipate it, he says you have to know the higher-timeframe discount arrays, and that when the market fails to drop into the array earlier, the odds are that Tuesday will produce the drive lower, during the London open and or the New York session (1:22).
The classic Tuesday high of the week is the bearish counterpart. That week is read as generally bearish, so lower prices are already expected, and the manipulation is price hovering below a higher-timeframe premium array on Monday and then rising into that array on Tuesday to form the high of the week; the same anticipation rule applies, with the drive higher expected around Tuesday’s London open or New York session (2:04).
One caveat is attached to both, and he tells students to note it. For the Tuesday high there can be another run higher than the highest formed in Tuesday’s London session — “they can come back and run the London high out” and still form the weekly high (2:23) — and for the Tuesday low price can come back and make a lower low during the New York session (2:37).
The same two shapes, arrived a day late on Wednesday
The Wednesday low of the week is the same construction delayed by a day: with the market already read as bullish, price hovers above the higher-timeframe discount array on Monday and Tuesday and then drops into it on Wednesday to form the low of the week. He adds that Monday and Tuesday can themselves be down days within this profile (3:27).
The Wednesday high of the week is its bearish mirror, with price holding below a higher-timeframe premium array on Monday and Tuesday and then rising into it on Wednesday, and he notes those two days can be up days instead (4:18). The London-open extreme is again allowed to be run out during Wednesday’s New York session while the weekly extreme still forms after it (4:26).
Consolidation Thursday reversals
At 4:40 he introduces the bullish consolidation Thursday reversal as a generally bullish market condition. What he looks for is consolidation from Monday through Wednesday, then price running the intraweek low and rejecting it to form a market reversal; the key, he stresses, is that the week is consolidating rather than only going higher or lower through those days (4:49). The anticipation rule is that when the market fails to drop into the higher-timeframe discount array, the drive lower is more likely to arrive on Thursday — on market-driver news or a rate release during the late New York session, which he places around two o’clock Eastern, or 2 p.m. New York time (5:16).
The bearish consolidation Thursday reversal reverses the premise: consolidation Monday through Wednesday, then a run beyond the developing weekly high and a rejection to form the reversal, with the same expectation of a Thursday drive higher on market-driver news or a rate release late in the New York session around 2 p.m. He adds that this variation is generally about rate announcements — FOMC or interest rate adjustments (6:06).
Midweek continuation: the pause that resolves with the bias
Not every week reverses. The consolidation midweek rally assumes a bullish profile is already in place, and what he calls the manipulation is consolidation Monday through Wednesday followed by a run of the intraweek high and expansion higher into Friday. The way he anticipates it is specific: the market is bullish and has not yet run to the premium array on the higher timeframes, and it has recently rallied out of a discount array and simply paused without any bearish reversal price action — which he reads as price about to expand higher toward the premium array (6:43).
The consolidation midweek decline is the inverse framing: a bearish profile, consolidation Monday through Wednesday, a run of the intraweek low and expansion lower into Friday, anticipated when the market is bearish, has not yet run the discount array, and has recently declined from a premium array and paused without bullish reversal price action (7:18).
The Friday profile he calls Seek and Destroy
The Seek and Destroy bullish Friday profile is the one he downgrades. He describes it as a neutral or low probability market profile, and the telltale manipulation is price consolidating Monday through Thursday while running shallow stops both under and above the intraweek highs and lows, then running the intraweek high and expanding higher into Friday (7:57).
The bearish Seek and Destroy Friday profile is described the same way — neutral, low probability — with consolidation Monday through Thursday, shallow stops taken on both sides, then a run of the intraweek low and expansion lower into Friday (8:42). He says the market waiting on interest rate announcements or non-farm payrolls can create this profile, that in the summer months of July and August it is better to avoid trading these conditions altogether (8:12), and he repeats the avoidance instruction for the bearish version (8:53). That is his stated preference; the recording offers no measurement of the profile’s frequency or outcome.
The Wednesday weekly reversal
The last pair is the bullish Wednesday weekly reversal. This week is read as bullish, and what he looks for is prices consolidating Monday through Tuesday, then driving lower into a higher-timeframe discount array to induce sell stops, followed by a strong reversal. The context he requires is that the market is trading at a long-term or intermediate-term low, where he says price will pair institutional buying with pending sell-side liquidity, or what is traditionally called a sell stop raid (9:18).
The bearish Wednesday weekly reversal uses the same mechanics with the opposite bias: consolidation Monday through Tuesday, a drive higher into a higher-timeframe premium array to induce buy stops, then a strong reversal, in the context of the market trading at a long-term or intermediate-term high, where he describes institutional selling being paired with pending buy-side liquidity — a buy stop raid (9:53).
What he asks students to do with the lesson
The closing minutes turn the profiles into an exercise. He acknowledges that the walk-through may look simplistic — “a squiggly line and a few comments” — and says the value shows up when you go through price action on a one-hour chart (10:06), on any pair, over any segment of time, going back as far as you want (10:21). The task he sets is to break down price, define the moves in what you are seeing, and then look at the characteristics of what was happening before each of these profiles formed, on the expectation that the conditions he outlined recur as precursors (10:31). He also says more is coming on market maker templates, that he will refer back to these profiles, and that PD arrays will be involved (10:51).
What the recording does not establish
This is a spoken classification framework delivered over chart work, so the transcript records the descriptions rather than the prices. It contains no levels, no entries or fills, no stop or target figures, no position sizing, no costs and no outcome for any of the profiles, which means none of them can be reconstructed or checked from the text alone. The premium and discount arrays the whole framework rests on are referenced but not defined in this lesson, and the terms FOMC, non-farm payrolls, July and August are supplied as conditions he avoids or watches for rather than as tested seasonal findings.
Two of his statements are explicitly framed as anticipation rather than certainty: the drive lower or higher is what the market will “likely” produce once it has failed to reach the array (1:28), and the profile list itself is offered as something to be confirmed by reviewing historical price data afterwards (10:36). Nothing in this article tests whether the profiles recur, and the recording presents no statistics for them.
A note on the caption track
This article was written from the video’s own auto-generated caption track, which is the primary source for every timestamp link above. That track is machine-generated and mis-recognises some of the speaker’s vocabulary; terms were normalised only where the surrounding context makes the intended word clear. “Entry week” and “enter week” appear where intraweek is meant (4:54, 7:13); the discount array is once called a “discount to raise” (5:11); the London open becomes “Wednesdays long and open” in one place (4:16); and the stop raids are rendered as “sell stop rate” (9:24) and “buy stop read” (10:04). No price, level, entry or result is reported from this lesson, because the recording does not state any in a form the captions preserve. The transcript used here is the automatic caption track (source kind youtube_captions, SHA-256 9112a50c8093ec66527392f2d7ac974844c72ebc786a579f5d69b20f605cff6c).
Watch the original recording
ICT Mentorship Core Content – Month 07 – Short Term Trading Defining Weekly Range Profiles
The Inner Circle Trader · published to YouTube on 27 September 2022 · listed as PT664S, about 11 minutes 4 seconds. The recording identifies itself as the second lesson of the short-term trading module. This video is the primary source for every timestamp link above.
The recording is not embedded here because the video owner has disabled playback on other websites. That was tested directly on 15 September 2026 from a BestProps page origin at both desktop and mobile widths: the embedded player loads and then reports “Playback on other websites has been disabled by the video owner”, with no playable stream in either case. The link above opens the recording on YouTube itself.
Resources
These are the sources checked for this article. The regulator pages are general reference material about day trading and about trading systems sold to the public; neither assesses the speaker, verifies the weekly range profiles, the array locations or the day-of-week timing above, nor endorses anything said in the recording. Any ICT, smart-money or third-party indicator, script, note set, transcript pack, chart annotation or re-upload circulating outside the publishing channel’s own page is unofficial and untested here.
- [1] ICT Mentorship Core Content – Month 07 – Short Term Trading Defining Weekly Range Profiles — The Inner Circle Trader (primary source; watch page read 15 September 2026, listed at PT664S).
- [2] The Inner Circle Trader — official YouTube channel (page read 15 September 2026) — the publishing channel for the ICT mentorship core content series that this short-term trading lesson belongs to.
- [3] Investor.gov (U.S. Securities and Exchange Commission) — Day Trading (read 15 September 2026) — the regulator’s definition, which states that day trading is extremely risky and can result in substantial financial losses in a very short period of time. Relevant background to a lesson that assigns directional bias to individual days of the week.
- [4] CFTC — Fraud Advisory: Commodity Trading Systems Sold on the Internet (read 15 September 2026) — the regulator’s guidance on evaluating trading systems sold to the public, including its warnings about hypothetical results based on historical price data and about performance claims that omit costs.
Source: ICT, ICT Mentorship Core Content – Month 07 – Short Term Trading Defining Weekly Range Profiles, The Inner Circle Trader, YouTube page dated 27 September 2022; the recording identifies itself as lesson two of the short-term trading module and as March 2017 mentorship content. Transcript SHA-256 9112a50c8093ec66527392f2d7ac974844c72ebc786a579f5d69b20f605cff6c. Every timestamp above points at the passage being described. This is an educational write-up of the speaker’s own framework: it is not trading advice, and no profile, level, timing rule or parameter above has been tested or verified here.