
Key takeaways
This is lesson one of ICT’s March 2017 mentorship month on short-term trading, and it covers combining higher-time-frame monthly and weekly ranges (0:10).
Read the full summary
This is lesson one of ICT’s March 2017 mentorship month on short-term trading, and it covers combining higher-time-frame monthly and weekly ranges (0:10). He defines short-term trading as holding for a few days to about a week, framed on the monthly and weekly charts, and he calls the weekly range the backbone of the approach (1:39). The core model is a higher-time-frame point of origin paired with an opposing lower-time-frame objective: from a monthly premium array he looks for an opposing weekly discount array, and from a monthly discount array he looks for an opposing weekly premium array (8:21). Order blocks, breakers, mitigation blocks, fair value gaps, liquidity voids, rejection blocks and old highs or lows are the chart areas he groups as “PD arrays”, and he scans them across the monthly, weekly, daily and four-hour charts before executing on the one-hour chart (21:19). He also layers in a day-of-week filter built on the range formed Monday through Wednesday, and presents a break of that range as his aggressive confirmation condition (42:50). Supporting inputs he names are seasonal tendencies, interest rates, the Commitments of Traders report and inter-market divergence, all optional extras rather than requirements (26:56). He works a dollar-yen monthly example to show how the monthly and weekly ranges are recorded and refined down to the four-hour chart (36:34). Throughout, he says nothing in the method is ironclad and that he deals only in probabilities (34:05). The recording contains no chart coordinates, no order fills, no position sizing, no statistics and no verified results; his performance comments are his own claims and are not independently established here.
How we researched this article
BestProps used document-based research from primary firm sources, checked September 24, 2026. The complete source list, scope, limitations, and commercial-state record appear near the end of this article.
How this lesson frames short-term trading
The recording opens the month’s content and identifies itself as lesson one, on combining higher-time-frame monthly and weekly ranges (0:10). He describes short-term trading as his own preferred discipline and places the month in context: bond, index, stock and commodity trading are said to come later in the summer, with this model revisited in more detail at that point (0:43). He also notes that the January long-term notes and the February swing-trading notes are meant to be used alongside this month rather than replaced by it.
His working definition is a holding period of a few days up to roughly one week, with the monthly and weekly charts used to frame the setup and the trade taken in the direction of the current or next week’s probable range (1:16). He is emphatic that the weekly range is the backbone of the approach, and repeats that framing later when he returns to what he calls the PD array matrix as the backbone of how he frames trades (7:18). The stated aim is trades that are already clear on the chart; if a setup is not obvious he says to sit on your hands rather than force it, and he ties forcing trades to psychological strain and to losing money (2:04).
The monthly-to-weekly framework
The central mechanic is simple to state: find the higher-time-frame area price is moving away from, then look for an opposing area on the next time frame down as the proposed destination. In his words, if the monthly context is bullish he focuses on a monthly discount array and if it is bearish he looks for a monthly premium array; from that monthly array he looks for an opposing weekly array (9:29). He gives the bearish case concretely — a monthly premium array with an opposing weekly discount array as the range being traded — and stresses that the distance between the two is what he frames risk against rather than a target to be sliced into small pieces (8:21). He also acknowledges that the monthly array may already have been traded away from by the time you look, in which case the lower weekly, daily or four-hour premium arrays become the places a setup can still form.
When he lists the areas he scans, he groups them as PD arrays: bullish order blocks, bullish breakers, bullish mitigation blocks, liquidity voids below current price, fair value gaps below current price, rejection blocks, candle bodies with long wicks, and simply a run on an old low or a return to an old high (21:19). The same logic runs in reverse for the bullish version of the model, where discount arrays are expected to be tested and broken on the way up to a weekly premium objective (18:45).
The bearish and bullish sequences
He presents a ladder for the shorting side: the monthly chart supplies a premium array as the point of origin, and the weekly, daily and four-hour charts are each scanned for their own premium arrays to sell from, with the one-hour chart used to time the entry (12:43). Critically, he says the discount arrays on those same lower time frames are the levels he wants to see break one after another on the way down to the weekly discount objective. The buying side mirrors it: a monthly discount array as the origin, discount arrays on the lower time frames offering support, and a weekly premium array as the intermediate-term destination (18:45). He notes that a setup framed from a four-hour level produces far fewer opportunities than one framed from a weekly or monthly level.
The weekly-to-daily version of the same model is the one he calls the one shot one kill setup: start from a weekly premium array, scout opposing arrays on the daily and four-hour charts, execute on the one-hour chart, and aim for the daily discount array (22:35). He says this is the model that gives him consistent setups every week, while repeating that the work is in waiting for price to come to the level (23:12). He also revisits the fractal argument behind it — each impulse leg can be broken into smaller impulse, retracement and expansion swings, and he counts eight potential short-term long setups in one six-month illustration (25:50), then sixteen buying opportunities when the same range is broken one fractal scale further down (26:26). Those counts describe a diagram in the lesson, not a measured market result.
Before the framework slides, the lesson also sets the time-frame roles explicitly. The one-hour chart is described as the executable time frame for one shot one kill and for short-term trading, with the weekly, daily and four-hour levels used to find where to execute from (16:37).
The day-of-week filter: Monday through Wednesday
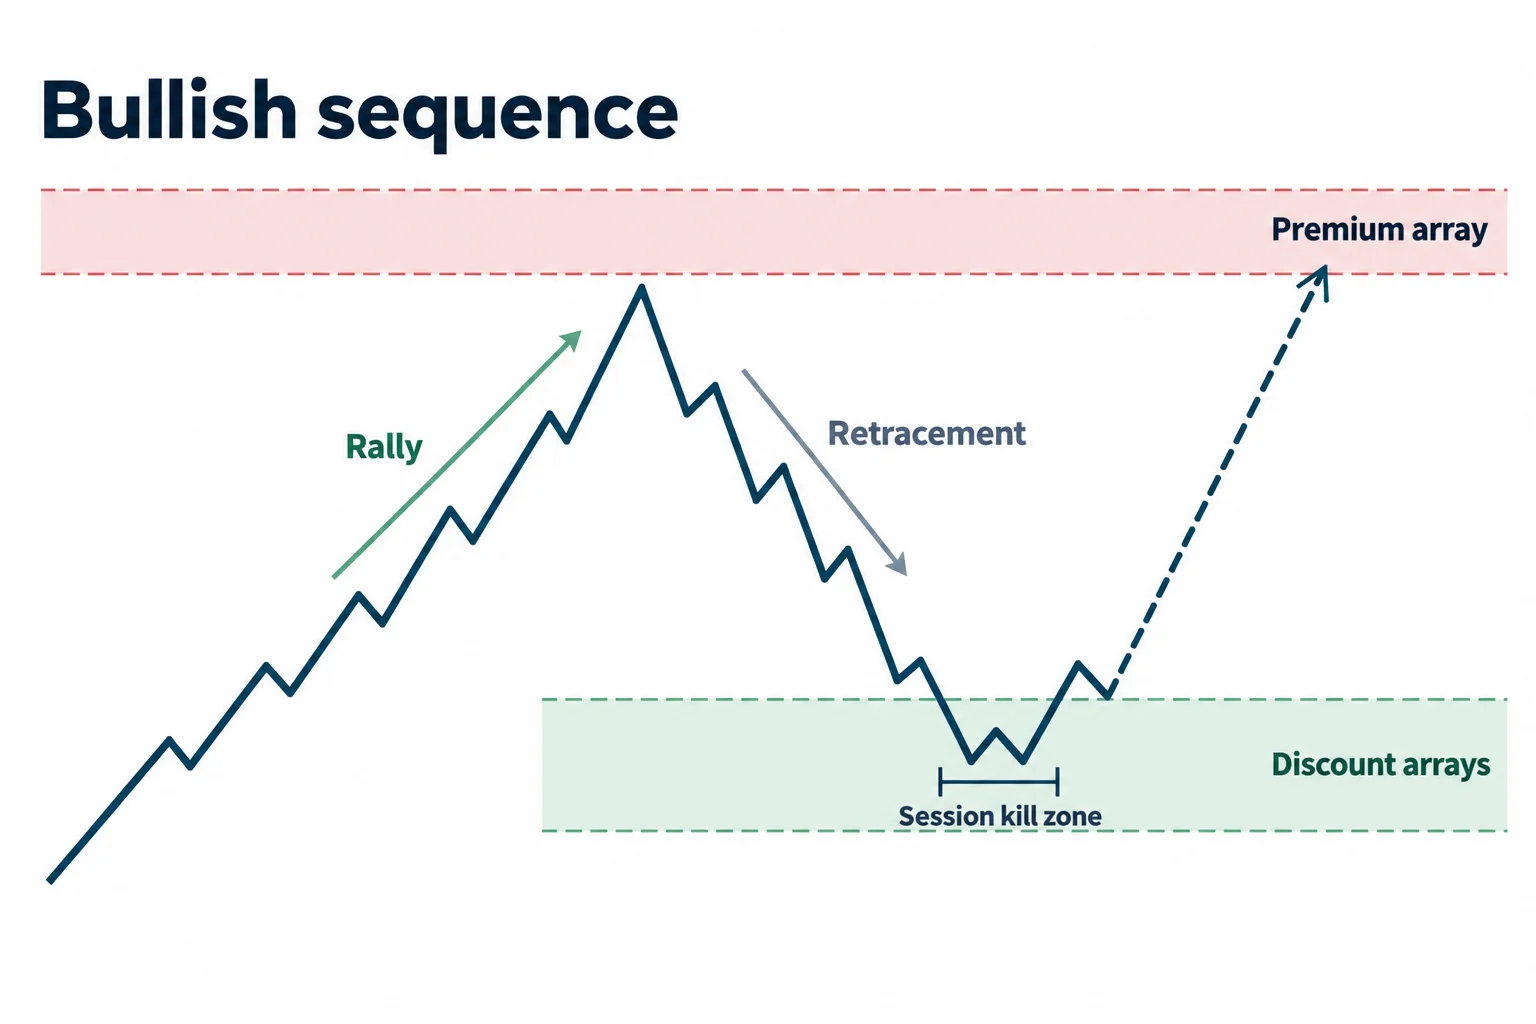
On top of the time-frame work he adds a weekly rhythm. For the bullish version he wants a market that rallies, retraces during Monday through Wednesday, and then expands into the premium array he has already identified; the impulse swing inside that window is what he calls the telltale sign that he is in a buy program (28:09). The retracement is framed from the point of origin against the monthly, weekly, daily, four-hour and one-hour discount arrays, and he says it has to reach into a session kill zone (29:12). The bearish version simply reverses the sequence: a decline, a retracement back up to a premium level, then expansion down toward the discount objective (32:17).
He names the kill zones he uses for this. London open and New York open are his usual sessions, and for pairs such as the Australian and New Zealand dollars or the Japanese yen he includes the Asian session, which he puts at 6:00 p.m. to 9:00 p.m. New York time, noting it can extend toward 10:00 p.m. (30:15). When he walks through the worked example he shades the Monday-through-Wednesday range on the four-hour chart and highlights the order blocks and rejection blocks inside it, then points out that the lows of the week generally form inside that window in that context (42:32).
The confirmation rule is the part of the lesson he emphasises most. In a bullish market, if the high formed between Monday and Wednesday is broken on an intra-week basis — on the Thursday or Friday of that week — he reads that as an aggressive confirmation that price is moving to the premium array he had already identified; in a bearish market the mirror is a break of the Monday-through-Wednesday low (43:40). He describes it as a high-probability condition that may not deliver in the same week, in which case the following week is watched for the same bullish or bearish expansion (44:31).
The monthly and weekly range routine
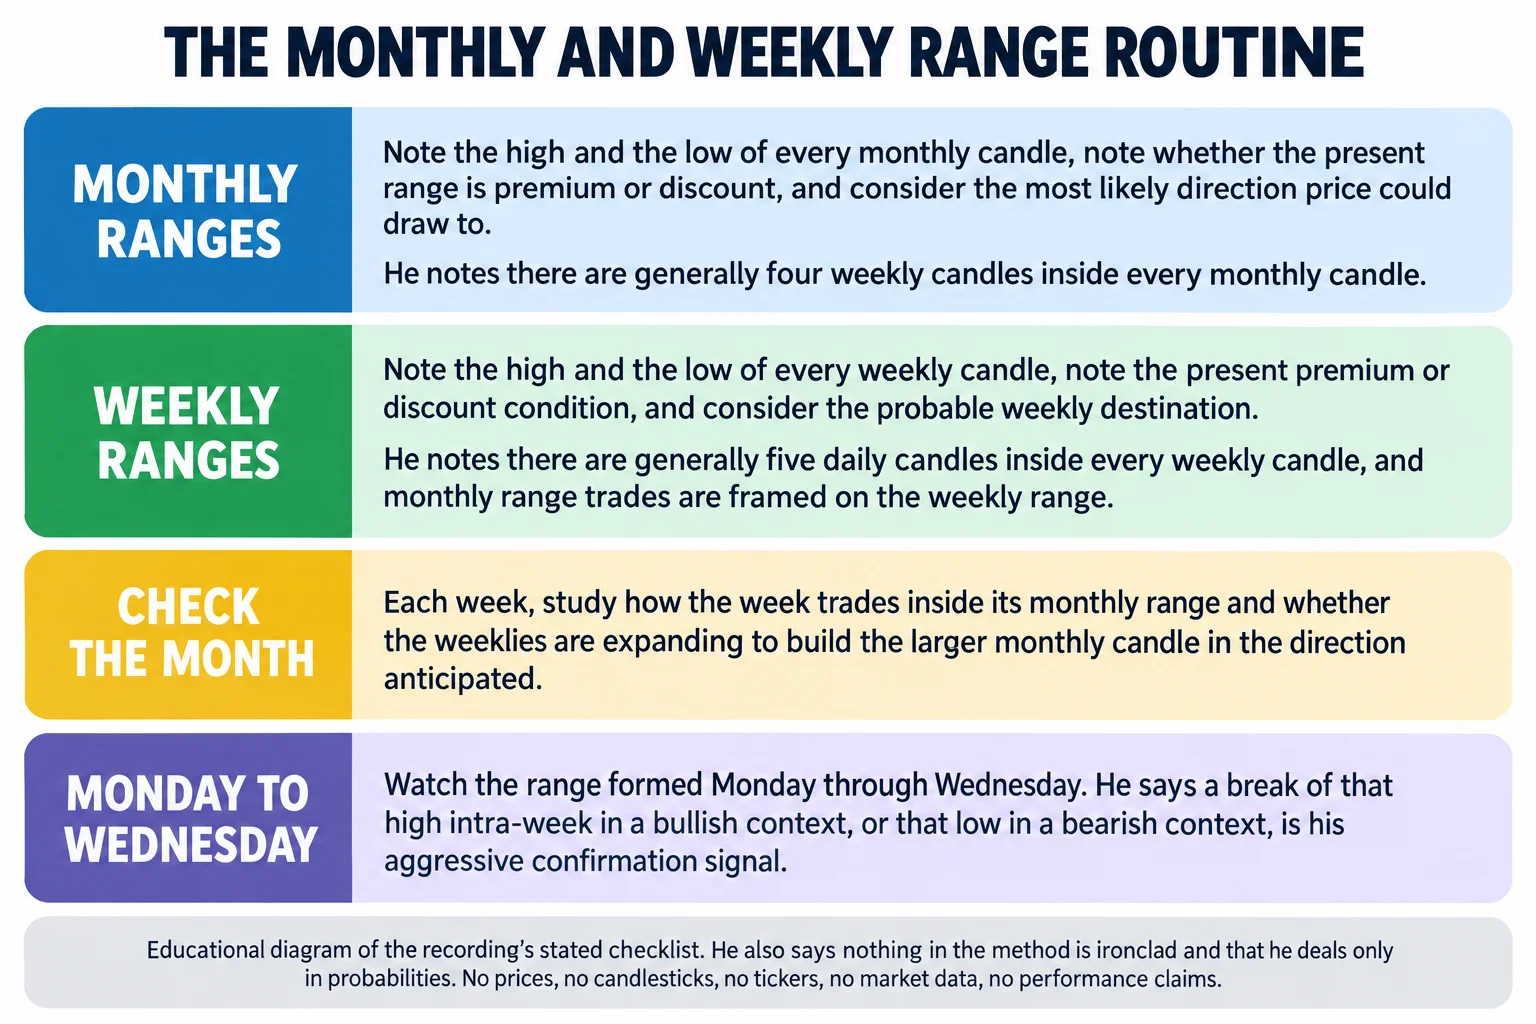
The practical checklist in the middle of the recording is short. For the monthly chart he records the high and the low of every monthly candle, notes whether the present range is premium or discount, and considers where price could draw to next (33:59). He points out there are generally four weekly candles inside a monthly candle and says each week is studied for where the monthly is likely to trade next (34:29). Then he adds his own qualifier: none of it is ironclad and he is dealing only in probabilities, which is why he wants the most probable direction rather than a certainty — if he is wrong on the higher time frame, the lower time frames he executes on may still pay (34:49).
The weekly version repeats the same steps one level down: record each weekly high and low, note the premium or discount condition, and consider the probable weekly destination; there are generally five daily candles inside a weekly candle, and it is the weekly range that frames the daily trades (35:13). His stated purpose for the weekly study is to see whether the weeklies keep expanding in the anticipated direction and thereby build the larger monthly candle (35:52).
The optional supporting inputs he names
Before the worked example he returns to what he calls the general concept and lists conditions that back up a directional bias. On the bullish side: seasonal tendencies toward higher prices, though he says these are not required; a bond market that is moving around while ten-year notes hold in consolidation; a Commitments of Traders picture where commercials are reducing shorts, adding longs, or already net long; and inter-market support in the form of divergence or a correlated pair (26:56). The bearish list is the reverse — a bearish seasonal tendency, moving rates, commercials reducing longs or building a net short, and inter-market divergence indicating weakness (32:17). He presents these as supporting inputs rather than entry rules, and he comes back to the same point that everything is framed from a higher-time-frame point of origin down.
The worked example on the dollar-yen monthly chart
The second half of the lesson applies the framework to one chart he identifies as the Japanese yen pair on a monthly view. He describes a move up into around 125.80 between spring and June 2015 from a low formed in 2013, followed by a decline from those 125 levels into around June 2016, with old support in the February-to-June 2014 area as the region price came back to (36:34). He is candid that he is showing this with hindsight and says he is not going to dissect the charts because the direction had been called through 2016 (37:31).
From there he sets the two anchors of the range: the monthly discount arrays that supplied the point of origin, and a monthly premium array that gave him a level to look up to. On the weekly chart he marks premium arrays and says he used rejection blocks for them, describing the move away from the 104.35 area up toward a level the caption track renders as “1860”, and listing lower weekly premium arrays, a rejection block near the 111 figure and another near the 106 figure — roughly four objectives in all (39:49). He then says the same levels are the ones price reached from 104.35 on the daily chart (40:53).
Dropping to the four-hour chart, he adds order-block and rejection-block theory plus the day-of-week filter, shading each Monday-through-Wednesday range and highlighting bullish order blocks, mitigation blocks and rejection blocks as discount arrays, with the weekly premium area above shown in red at a level the captions give as 118.70 (41:11). He then asks how many buying opportunities are visible in that stretch and answers six, one per week (41:33).
Two caveats belong with this example. First, the caption track renders several of these figures without separators and at least one as an implausible number for this pair; the levels are reproduced as the speaker states them and are not harmonised or corrected here. Second, the example is presented from the perspective of what had already happened — he says so directly when he declines to dissect the charts. No entry price, stop level, position size or account outcome is given anywhere in the recording, so nothing in this example can be treated as a verified trade result.
A study routine drawn from the lesson
- Mark the current monthly high and low and note whether price sits in the premium or discount half of the range (33:59).
- Identify the monthly array price appears to be moving away from, and locate an opposing weekly array as the proposed destination (8:21).
- Catalog the premium and discount arrays on the weekly, daily and four-hour charts between those two points rather than stopping at the monthly and weekly view (21:19).
- Repeat the exercise on the weekly chart, recording each weekly high and low and checking whether the weeklies are expanding toward the monthly conclusion (35:13).
- Track the Monday-through-Wednesday range each week and record whether the high or low of that window is broken later in the week, and what followed (42:50).
- Log the occasions when the proposed destination was never reached, and treat the whole exercise as probability work rather than a rule set, as he repeatedly insists (34:49).
This checklist is an educational interpretation of the lesson. The recording does not specify entries, stop placement, position sizing, transaction costs, instrument selection or loss limits, and it reports no results; none of those gaps should be filled in from elsewhere.
A note on the captions
This article was written from the automatic YouTube caption track, which is machine generated and mishears several terms in this recording. The Commitments of Traders reference appears as “dust commitment Traders” (28:09). The word fractal is rendered once as “lesseractile” (26:26). The sell and buy programs are rendered as “cell program” and “by program” (12:43). SMT divergence appears as “smt” (27:41). In the summary passage near the end, “discount array” is rendered as “discount or rate” (44:21). Because the captions are unreliable on numbers, the price levels quoted above are given as the track renders them, with the ambiguity flagged rather than resolved. Nothing in this article comes from anywhere other than the spoken content of this recording: no chart annotation, price reading or trade outcome has been supplied from outside it, and this review did not view the recording’s charts.
Watch the original recording
ICT Mentorship Core Content – Month 07 – Short Term Trading Using Monthly & Weekly Ranges
The Inner Circle Trader · published 26 September 2022 · about 44 minutes 59 seconds. This recording is the primary source for every timestamp link above.
The recording is not embedded here because the video owner has disabled playback on other websites. That was tested directly on 15 September 2026 from a BestProps page origin at both desktop and mobile widths: the embedded player loads and then reports “Playback on other websites has been disabled by the video owner”, with no duration and no playback progress, while the video itself plays normally on YouTube. No half-working player is left on this page.
The watch page was read on 15 September 2026 and is publicly listed as ICT Mentorship Core Content – Month 07 – Short Term Trading Using Monthly & Weekly Ranges by The Inner Circle Trader, upload date 26 September 2022, not private and not unlisted. The caption track used here runs to 2,699.8 seconds, about 44 minutes 59 seconds, matching the duration shown on the video’s own page. Its description states that the audio and visuals are as distributed in March 2017, which is consistent with the speaker opening the recording as the March 2017 mentorship material.
Resources
These are the sources checked while preparing this article. The regulator and investor-education pages are general material about how trading systems offered to the public should be assessed and about the risk of very short holding periods; neither evaluates this speaker, verifies any array, range, kill zone or confirmation rule described above, nor endorses anything said in the recording. Any ICT, smart-money or third-party indicator, script, note set, chart annotation, transcript pack or re-upload circulating outside the publishing channel’s own page is unofficial and has not been tested here.
- [1] ICT Mentorship Core Content – Month 07 – Short Term Trading Using Monthly & Weekly Ranges — The Inner Circle Trader (primary source; watch page read 15 September 2026, listed duration 2,699 seconds).
- [2] The Inner Circle Trader — official YouTube channel (read 15 September 2026) — the publishing channel for the 2017 mentorship series used here.
- [3] CFTC — Fraud Advisory: Commodity Trading Systems Sold on the Internet (read 15 September 2026) — the regulator’s guidance on assessing trading systems and advisory services offered to the public, including its warning that hypothetical trading results are typically simulations calculated over historical price data with the benefit of hindsight.
- [4] Investor.gov (SEC) — Day Trading (read 15 September 2026) — investor education describing day trading as extremely risky and capable of producing substantial finan