
Key takeaways
This is the third lesson in the short-term-trading strand of ICT’s mentorship content, and it stacks a “manipulation” layer on top of the weekly profiles from lesson two: the profile tells you the shape of the week, the template tells you how he thinks the week is engineered before it gets there (0:12, 0:20, 0:55).
Read the full summary
This is the third lesson in the short-term-trading strand of ICT’s mentorship content, and it stacks a “manipulation” layer on top of the weekly profiles from lesson two: the profile tells you the shape of the week, the template tells you how he thinks the week is engineered before it gets there (0:12, 0:20, 0:55). He works through bullish Tuesday-low and Wednesday-low weeks, their bearish Tuesday-high and Wednesday-high mirrors, midweek consolidation weeks that reverse on Thursday, midweek rally and decline weeks, Wednesday weekly reversals around news, and two late-week profiles he labels low probability and says he does not trade (1:54, 13:26, 7:25, 18:59, 22:57, 26:14, 36:01, 31:47, 34:28). Every template is built from the same three inputs — which day forms the week’s extreme, which premium or discount array price reaches, and whether a 1.27 or 1.68 extension or a 100 percent measured move overlaps that array — and every objective is framed on a lower time frame than the entry (2:51, 7:54). All of the diagrams are read from a 60-minute chart perspective (1:35). This is his playbook for the weekly range, offered as interpretation; the recording contains no chart values, no executions, no outcome data and no frequency test, and he states his own weekly objective as 50 to 75 pips (39:42).
How we researched this article
BestProps used document-based research from primary firm sources, checked September 24, 2026. The complete source list, scope, limitations, and commercial-state record appear near the end of this article.
What the templates are for
He opens by tying this lesson directly to the weekly profiles from the previous one: if you work through the templates, he says, they will classify the price action you have already seen and tell you how the manipulation took place alongside the profile for that week (0:20, 0:30, 0:43, 0:55). The stated aim is to blend the two ideas so that you can anticipate what he calls the market makers’ behaviour in advance from the conditions currently in front of you (1:02, 1:11).
He is also explicit about the presentation: every example and diagram in the lesson is depicted as a 60-minute chart, so the exercise is to open any pair on an hourly basis, Monday through Friday, and see the market trade in one of these themes (1:23, 1:35, 1:45).
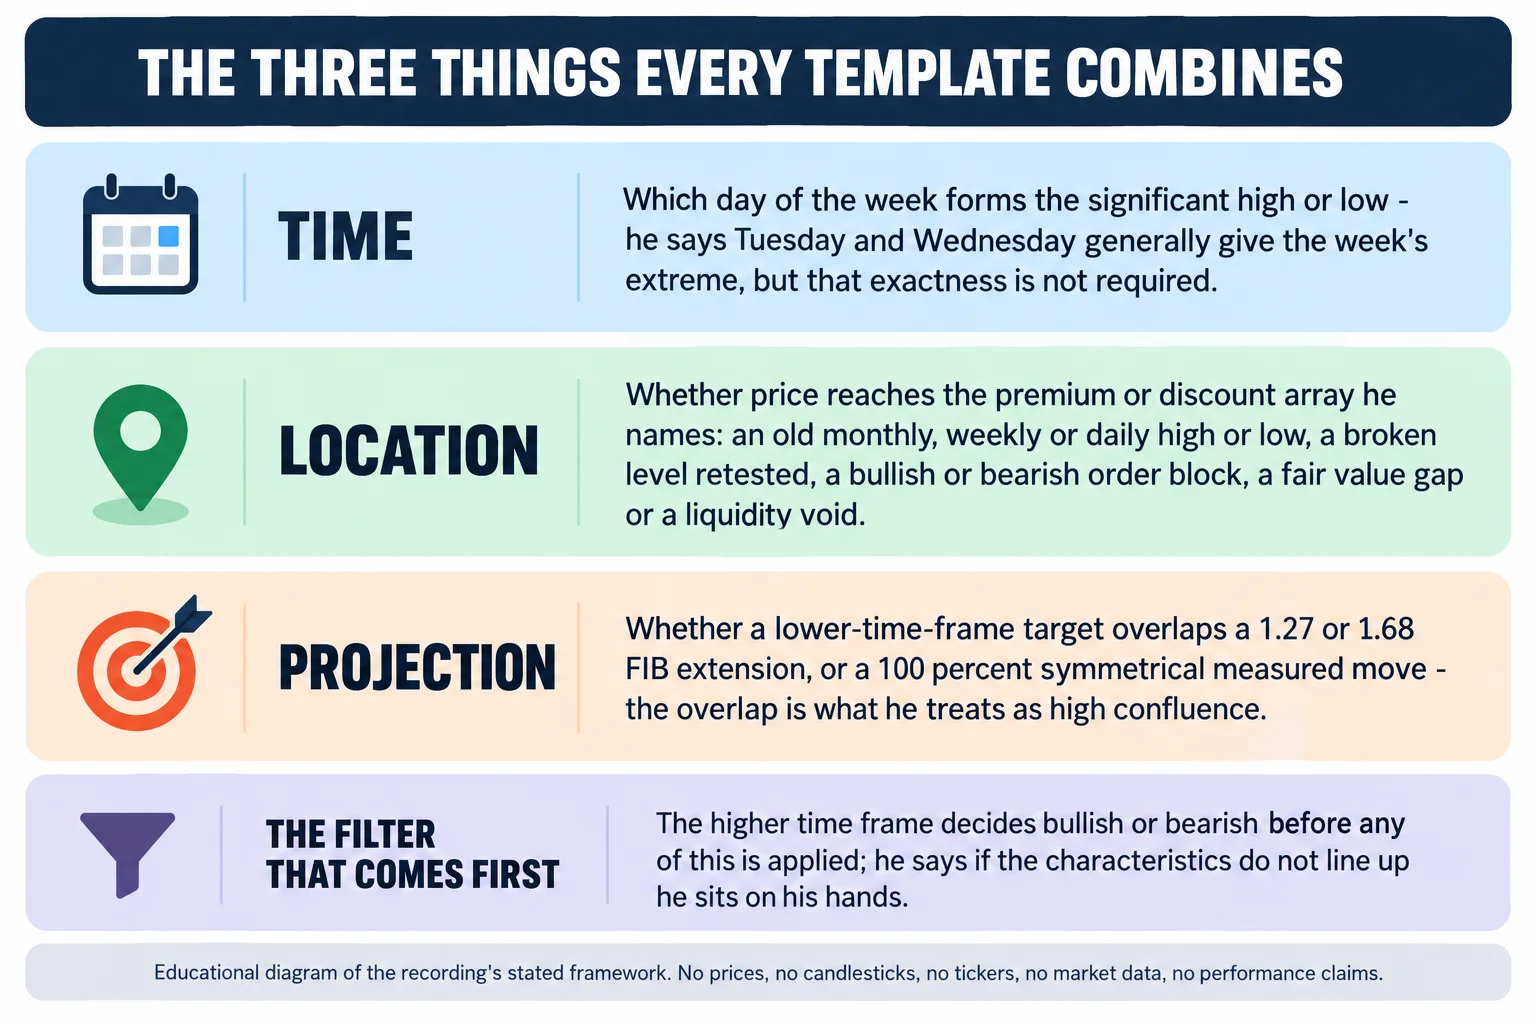
Three recurring inputs run through every template. The first is which day forms the high or low of the week; he says Tuesday and Wednesday generally deliver the weekly extreme, and that while he teaches it that way, hitting the exact tick is not the point (39:03). The second is location — whether price reaches a premium or discount array of the kinds he names: an old monthly, weekly or daily high or low, a broken level retested as support or resistance, a bullish or bearish order block, a fair value gap or a liquidity void (2:45, 3:03, 4:48). The third is projection — whether a lower-time-frame target overlaps a 1.27 or 1.68 extension or a perfect symmetrical price swing, which he treats as the strongest form of confluence (3:38, 29:20).
The framing rule that governs all of it: you take the objective on a time frame below the one you used to enter. If you buy a monthly liquidity pool, you look for a weekly or daily premium array to sell into; if the entry is a weekly reference, the objective is daily or four-hour (2:51, 3:03, 4:10). He gives his reason plainly at one point — it gives him a large degree of confidence that the move will happen, and a nearer target avoids holding for a move that may take more than a week to unfold off a monthly or weekly reference (8:31, 8:40).
Bullish weeks: Tuesday low of the week
This is the first template and he says it has several scenarios (1:54). The market condition is a primarily bullish one, and price trades down on Tuesday into a discount (2:08, 2:16). Within that, he gives three variants of where the discount reference sits.
- An old monthly, weekly or daily low run as a liquidity pool — in his words, running out sell stops (2:18, 2:27). From there he looks for the high of the week to form by Thursday’s New York session, or to carry into Friday, and to trade up into a premium PD array on a time frame below the one used for the buy (2:31, 2:45, 2:56).
- A retested broken high acting as support — price has already broken above an old monthly, weekly or daily high and comes back to retest it, and he looks for the move up into a premium array and/or a 1.27 or 1.68 extension, preferably a 100 percent symmetrical price swing (3:14, 3:24, 3:38). If the weekly high is the level traded as support, the objective is a daily or four-hour array plus the extension (4:10).
- A bullish order block — monthly, weekly, daily, any overlap of them, or a four-hour block, with the note that he left the four-hour case off the diagram only for space (4:50, 4:56, 5:00). In a multi-week advance, he says the entry can appear at the first swing grade, at the equilibrium of the overall move, or at the third swing grade — which he defines as the halfway point between equilibrium and the final objective, an area where he generally does not expect a stop run right before the move he wants (5:09, 5:19, 5:31, 5:34).
He adds that a fair value gap or liquidity void can be the vehicle for this trade as well, and repeats the lesser-time-frame objective rule (6:07, 6:27, 6:34).
Bearish weeks: Tuesday high of the week
The mirror image: price trades up on Tuesday into a premium, which can be an old monthly, weekly or daily high run for buy stops above it, and he frames the trade on a time frame below the one used for that premium reference, targeting a discount array (7:25, 7:36, 7:46). His worked framing: short a daily high as buy stops are run, and target a four-hour discount array; or short a weekly high and target a daily or four-hour discount array (7:59, 8:18).
A second variant trades up to an old monthly, weekly or daily low — a level the market has already broken down through — and retests it as resistance, with a discount array and/or a 1.27 or 1.68 extension as the objective again on a lesser time frame (9:03, 9:17). In a bearish context, he walks the sequence as: the market opens Monday, trades up into Tuesday to create the week’s high while retesting that old low, and he uses that low to frame the short (9:33, 9:40).
A third variant has price filling a fair value gap or liquidity void on the way up into a premium bearish order block on a monthly, weekly or daily basis, or entering at the first swing grade, equilibrium, or the third swing grade (11:10, 11:17, 11:26, 11:35). His example: a Sunday gap lower, advance all through Monday, and a high created into Tuesday’s London or New York open while a fair value gap or liquidity void fills below (12:00, 12:11, 12:22). He stresses that this one only works if the projection from the upswing — measured from that low to Tuesday’s high — actually overlaps the four-hour discount array in the example; when both land together, that is the week’s target (12:56, 13:06, 13:12).
Bullish weeks: Wednesday low of the week
Here the shape is a short-term low on Monday, a move up into Tuesday, then Tuesday trading lower into a discount on Wednesday (13:26, 13:33, 13:38). The first variant runs an old monthly, weekly or daily low as a liquidity pool and looks for the rally into a premium array on a lesser time frame (13:45, 13:49). He notes that this is the framework familiar from what he calls his reflection pattern — a 1.27 or 1.68 extension where price runs an old low — and that he intends to go through these patterns in a later month’s material (13:58, 14:07). In this version, if the sell stops below the lows are taken, he looks for the move up into Thursday, preferably Friday, into a premium array, with a weekly entry exiting into a daily or four-hour premium array (14:26, 14:35).
The second variant uses a discount old monthly, weekly or daily high: price has broken out above it and is now coming back down to it, with Monday trading up slightly and Tuesday trading lower into the old high on Wednesday, framing a rally into Friday toward a premium array and/or extension on a lesser time frame (15:14, 15:21, 15:27, 15:37, 15:49). He adds the constraint that matters most: it is not the 1.27 or 1.68 on its own that he wants, but that extension coupled with a lesser-time-frame array (16:09, 16:16).
The third variant trades into a bullish order block on a monthly, weekly or daily basis, or at the first swing grade, the equilibrium, or the third swing grade of a larger move (16:30, 16:44, 16:50, 17:02). He uses this to restate his four swing stages — first stage, second stage to equilibrium, third swing grade, and fourth “terminus” where the trade ends and profits are taken — and says he sees these entries at the first, equilibrium and third stages (17:24, 17:30, 17:43). Wherever the entry array sits, the objective is a premium array with an overlapping 1.27, 1.68 or symmetrical swing on a lesser time frame (18:12, 18:20).
Bearish weeks: Wednesday high of the week
Now the bearish environment, with a short-term high: price trades up into a premium, into an old monthly, weekly or daily high liquidity pool where old highs are run out, and he frames a move down into a discount array on a lesser time frame (18:59, 19:06, 19:15, 19:25). He notes it can also occur at an equilibrium area of a larger move, from a swing or position trader’s perspective, and calls the raid of a weekly high a classic stop run that he generally expects on a Wednesday (19:34, 19:49, 19:58).
The second variant puts a fair value gap or liquidity void in the path and takes the stops through it, in an overall bearish context, with a retest back into a premium array in front of an old monthly, weekly or daily low, then a discount array and/or extension on a lesser time frame — his example being a short at a retested monthly low targeting a weekly, daily or four-hour discount array (20:10, 20:22, 20:32, 21:03). He specifies the measurement: the swing from Tuesday’s low up to Wednesday’s high is what the fib is anchored on, and the extensions below Tuesday’s low are the 1.27, 1.68 or a symmetrical 100 percent of that range subtracted from the low (21:40, 21:51, 22:02).
The third variant returns price into a fair value gap or liquidity void and up into a premium bearish order block on a monthly, weekly or daily basis, or into the first retracement of a larger swing at the first grade, equilibrium, or the third grade, with a discount array or extension — preferably both — on a lesser time frame than the entry block (22:15, 22:24, 22:30, 22:40).
Midweek consolidation: the Thursday reversal
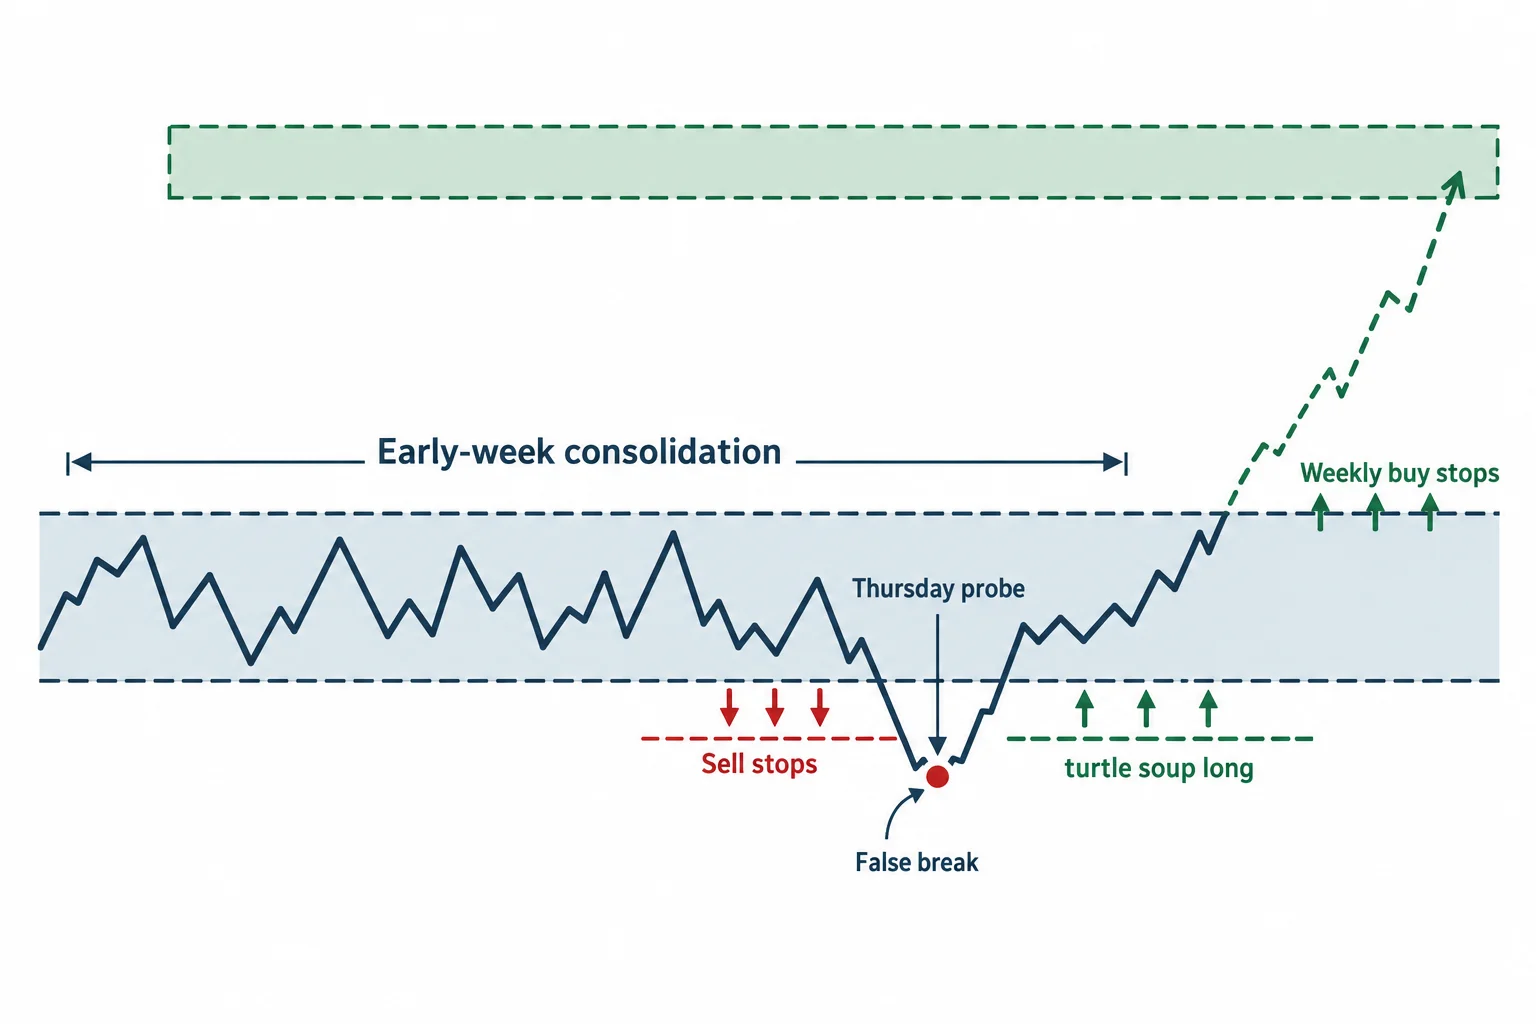
This profile is bullish: the market opens Sunday, trades sideways through Monday, Tuesday and into Wednesday, and then trades down on Thursday into a discount (22:57, 23:05, 23:15). He says many traders read the opposite — expecting a bullish market-structure shift because buy stops were taken — while he is looking for sell stops to be run out in a bullish market (23:25, 23:34, 23:37). His named catalysts are a scheduled release: the FOMC around the 2:00 p.m. hour New York time, or New York session employment data, which he places at around 8:30 in the morning (23:37, 24:25).
The mechanics he describes are a false break below an early-week low on Monday or Tuesday, which he calls a turtle soup long, followed by a run up to where the weekly buy stops sit as the weekly objective (23:51, 23:56, 24:01). His own framing of the trade is explicit about risk: if you take it into an FOMC release, use a very small position because it can “really crush” you if it whips, wait for the initial knee-jerk reaction, and place a limit order below the low rather than trading into the event (24:44, 24:50, 24:52). He also says this is a one-day payoff that you waited all week for, framed Thursday into Friday (25:12, 25:13).
The same structure in reverse is the bearish version, which the caption renders as “consolidation service a reversal”: the market trades up into a premium earlier in the week, looks as though it has taken sell stops or shifted structure to the downside, and then Wednesday into Thursday takes the intraweek buy stops — again usually on FOMC at 2:00 p.m. or an 8:30 a.m. employment release — which he calls a turtle soup short, targeting the sell stops below the intraweek low (25:25, 25:30, 25:44, 25:48, 25:55, 26:02).
Midweek rally and midweek decline
The bullish version starts the week moving from Monday, retraces on Tuesday down into Wednesday, and reaches a discount fair value gap, liquidity void or bullish order block, any of which he says can be the catalyst; he expects a high or medium impact news event on Wednesday in either the London or New York session (26:14, 26:24, 26:31, 26:40). The swing projection or fulcrum point is the intraweek high formed on Tuesday, with the caveat that it can also be a Monday high, and he notes that is exactly the reverse of the decline template (26:49, 26:54, 26:56, 27:08).
This is where he explains the projection mechanics properly. The fulcrum is the highest high the market starts to retrace from, and the fib is anchored from there down into the order block or other discount array used for the entry; the 1.27 and/or 1.68 extension of that range is what reaches up into the premium area (27:25, 27:32, 27:40). Two conditions have to be satisfied at once: the premium array has to be on a lesser time frame than the entry, and it has to overlap the extension. When both line up, he describes a high-confluence level where time and price agree and the algorithm may respond (27:51, 28:00, 28:26, 29:10).
The bearish version, the midweek decline, fills a premium fair value gap or liquidity void or trades up into a bearish order block on Wednesday, ideally with high or medium impact news at the London or New York open, and targets a discount array with converging 1.27 or 1.68 extensions or a perfect symmetrical measured move (29:20, 29:26, 29:35, 29:44). He then works the arithmetic out loud for the sell side. Take the week’s lowest low up to Wednesday’s high, convert that range to pips, multiply by 1.27 and subtract the result from Wednesday’s high to get one projected low; do the same with 1.68 for the other. He says you do not need a Fibonacci overlay tool for that (29:58, 30:12, 30:23, 30:33, 30:55).
The late-week profiles he says not to trade
Two templates are marked as neutral or low probability, and in both he is direct that the purpose is observation rather than participation. The first, at 31:47, is what the captions render as “you can destroy bullish Friday”: he says it is a low probability or neutral condition and that the environment is one where you want to be on the sidelines or demonstrating for experience (31:47, 31:58). The market builds a small consolidation through the week into Thursday with a pool of sell stops formed inside the week, and a high or medium impact release on Thursday that he says is usually FOMC or an employment decision; the anticipation is a sell-stop raid below the week’s lows, then a run above all the intraweek highs to a daily or weekly premium array — a new weekly range high that he says moves very speedily, and which he expects to produce a potential reversal once reached (32:07, 32:13, 32:33, 32:43, 33:04, 33:09). He notes the environment can occur in either direction — bullish or bearish — if a higher-time-frame level breaks and then refuses to follow through (33:18, 33:21).
His warning about this profile is worth quoting closely rather than paraphrasing away: he says this is one of the hardest ones to trade, that if you see the market consolidating back and forth taking buy stops and sell stops throughout the week it is probably better to sit on your hands and not trade it, that the chances of getting it right are not 50/50, and that if you are wrong it can blow through whatever your stop loss is, especially into an FOMC event (33:32, 33:38, 33:44, 33:50).
The second, at 34:28, is the bearish mirror, again labelled neutral and low probability and again described as something he watches for the outcome of rather than trades: a consolidation Monday through Wednesday builds a pool of intraweek buy stops, Thursday takes them out on a high or medium impact release, the intraweek sell stops then get run, and the target is a daily or weekly discount array — at which point he looks for a potential reversal (34:30, 34:36, 34:42, 34:50, 34:57, 35:10, 35:17).
Wednesday weekly reversal
He flags this one as different from the Wednesday-low templates covered earlier in the lesson (36:01, 36:04). The bullish case: an old low or retail support, driven through by a high or medium impact news event, generally at a higher-time-frame level such as a weekly or monthly support; once price is below it, the market discounts the news and reverses (36:11, 36:20, 36:31). From the old low, the fib projection of 1.27 or 1.68 — occasionally a symmetrical swing, though he says it is generally the extensions — is measured from that low up to Tuesday’s high and projected down, while the market works its way into a monthly, weekly or daily discount array, and he uses the swing projection fulcrum to project to an extension overlapping a weekly or daily premium array (36:41, 36:52, 37:05).
The bearish case reverses it: an old high or retail resistance run above by a high or medium impact news event, the market rejecting or discounting that event, and a 1.27 or 1.68 extension aligning with a monthly, weekly or daily premium array above, after which he looks for the move below the swing projection fulcrum into a weekly or daily discount array overlapping an extension (37:05, 37:13, 37:24, 37:45).
How he says to use the set
In the closing stretch he calls this “basically the playbook” he uses when hunting what he calls one shot one kill setups, and says the weekly range will generally turn out to be one of these templates (38:00, 38:11). The bias is not supposed to come from the template at all: he says you will already know whether you are bullish or bearish from the higher-time-frame material taught earlier, and that you then go to the profiles for that direction and look for the characteristics, blended with the manipulation factor that takes place inside those profiles (38:25, 38:35, 38:51).
One point he makes twice, because it limits what the templates can be asked to do: once you have identified the week’s range, you may not get the actual highest high to short from or the lowest low to buy from, and he says that is not