
Key takeaways
Lesson six of the short-term trading series is about low-resistance liquidity runs in trending conditions, and the speaker frames it on the four hour chart (0:04).
Read the full summary
Lesson six of the short-term trading series is about low-resistance liquidity runs in trending conditions, and the speaker frames it on the four hour chart (0:04). He references IPDA ranges going back 20, 40 and 60 trading days but says that for one-shot-one-kill and short-term work he works primarily from the most salient institutional references of the last three months, looking to trade from one PD array to the next, ideally discount to premium (0:19, 0:39). His method for the range is to take the highest high and lowest low in the form of the bodies rather than the wicks, call that the master blueprint, and grade it into premium, discount, quadrants and then halves again (10:09, 9:26). The worked case study is the pound in March, bought from discount into premium, with the weekly low sought on Monday, Tuesday or Wednesday (1:08, 20:41). He states weekly pip objectives and a habit of expecting a third to a half of the weekly range to be done by Wednesday’s London close (7:13, 23:35). Both of those are his stated rules. The recording supplies no dataset, no fills, no costs and no performance results, and he says outright that his weekly projections will often be wrong or not close (16:53).
How we researched this article
BestProps used document-based research from primary firm sources, checked September 24, 2026. The complete source list, scope, limitations, and commercial-state record appear near the end of this article.
In ICT Mentorship Core Content – Month 07 – Short Term Trading Low Resistance Liquidity Runs Part 2, he opens by tying the lesson to the preceding one on low-resistance liquidity runs in consolidations and saying the same reasoning carries into a trending environment (0:04, 0:25). The YouTube page for the re-release is dated 29 September 2022; the teaching is a mentorship lesson recorded well before that, and he refers back to material in lesson five for the range work he assumes the viewer has already done (9:42, 10:19, 19:24).
What he means by trading from one array to the next
His stated objective is directional movement between reference points rather than a single entry signal: trade from one PD array to the next, ideally from a discount range to a premium range that can be easily defined (0:52). For that he uses premium and discount PD arrays, and he lists the forms they take in his vocabulary: a bullish order block, an old low, a fair value gap, a breaker, a mitigation block, an old high that has been broken and now turns support (0:49, 13:22). Those classifications are specific to his methodology, not standard indicators, and he assumes the viewer already understands them.
He describes what he reads into the case study, and it is worth marking clearly as interpretation. He says the March price action originated from a deep discount, that a discount market generally wants to reach a premium, and that if price shows an aggressive nature to trade higher then institutions are building long positions and reaching for a reference point where they can unload them (1:11, 1:32). Later in the lesson he describes this as trading probabilities and looking at a statistical edge (17:06), while also stating elsewhere that his own weekly projections will not always be right and many times will not even be close (16:53). The recording presents no measurement of that edge.
Why the four hour chart
He says the four hour chart is, in his opinion, the easiest time frame on which to frame a one-shot-one-kill or short-term setup, calling it his go-to model (3:48). In his MT4 workflow, Control+Y produces date dividers, and on a four hour chart those dividers are weekly rather than daily, so each vertical dotted line marks the start and end of a trading week (4:45). He keeps the monthly, weekly and daily PD arrays on that chart and says he leaves the four hour arrays off to keep it readable (8:59).
The chart grading runs from the whole range down. He describes discount and premium divided, then the upper portion divided, then those divisions split in half again, producing progressive levels of premium and discount rather than one boundary (5:12). His claim is that when a discount array forms near a divider or what he calls a quadrant level, the response away from that level and toward an opposing level is the higher-probability move (5:44).
The master blueprint and how the range is graded
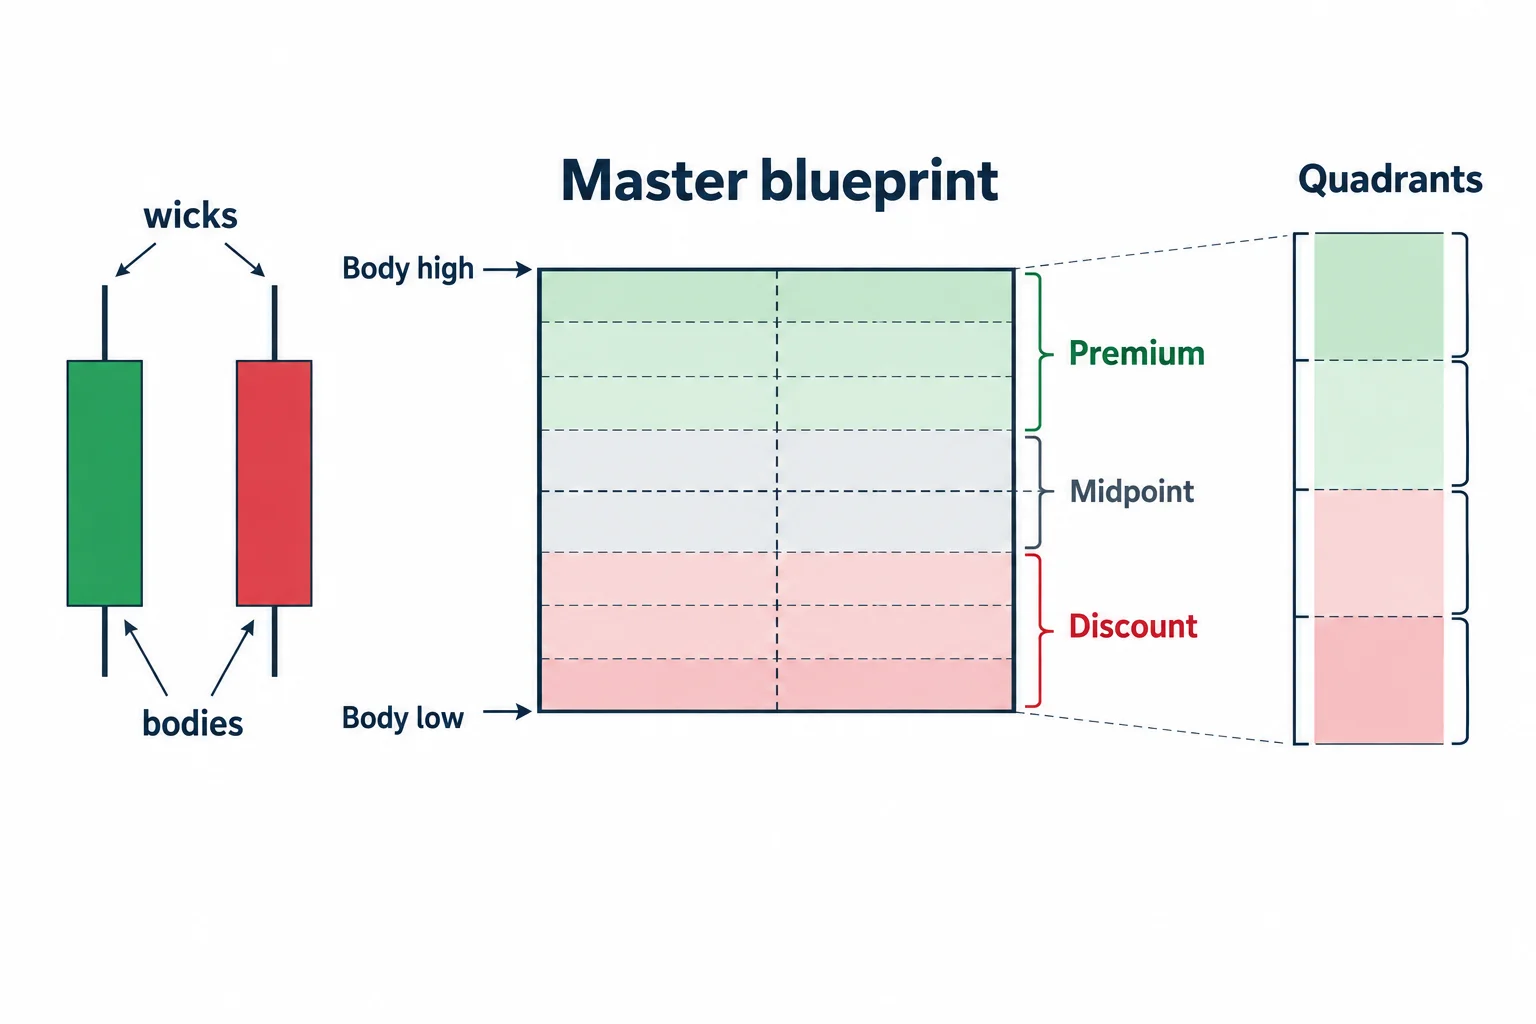
The procedural core of the lesson is one instruction: always look at the trading range the market is in, take its highest high and lowest low in the form of the bodies and not the wicks, define that, and treat it as what he calls the master blueprint before breaking it down (10:09). He grades it into premium and discount, then quadrants, then halves of those, and says the algorithm works back to reference points inside that range based on time and price (10:21).
He contrasts this with what he calls conventional support and resistance, where an old level is drawn out in time and an expectation is built on the fact that it once mattered, a practice he says has no consistency in the viewer’s own trading (12:05). His alternative is to grade the swing from a premium or discount measure and then look for a PD array that supports or opposes price at that grade. The distinction between the two practices is his argument; the recording does not test either against the other.
One behavioural claim sits under the grading. He says that when price breaks through one of these levels it will most likely reach for the next level up, and that he very rarely sees a midway point between the grades he has defined (14:08). That is a statement about how his own marked levels behave in his own examples. It is presented in the lesson as a described regularity and it is not measured.
The weekly exercise he prescribes
Before each week begins he wants the four hour chart loaded with PD arrays and notations made about where price may logically reach in a discount market or fall to in a premium market, so that a completed weekly range can be anticipated (16:09). He says doing this every week is a good exercise and that it develops anticipatory reading of price (16:44).
The honesty in that prescription is worth preserving verbatim in substance: he says you are not going to get this all the time, it is not going to be perfect, and many times you are not going to be close to it at all (16:53). A disciplined version of the exercise would record each forecast before the week opens and compare it afterwards with the completed chart, including the weeks it failed. He also notes the time constraint that runs through the whole method: between the two weekly dividers there is only Sunday’s open through Friday, so the exercise is deliberately short-horizon (17:43).
He then refines the same map on a 60-minute chart, where he says more definition appears and where breakers and mitigation blocks show up that did not exist on the four hour (19:46). His stated limit is that anything under a one hour chart reduces the effectiveness of one-shot-one-kill work, because what he is looking for is the impulse price swing that helps complete the weekly range; below that he says you are day trading or scalping (20:04).
The two weeks he walks through
Both examples are read from marked-up pound charts. He narrates them as follows, and each detail below is his description of what his own charts showed rather than an independently verified record (1:08):
- First week: with the low sought on Monday, Tuesday or Wednesday, he says the low formed on Tuesday off a daily fair value gap in a discount fashion; price then traded up to a high slightly above Monday’s on Wednesday, broke it and made the weekly high on Wednesday; Thursday traded back down into that fair value gap and into a mitigation block from Wednesday’s intraday trading before printing another impulse higher and consolidating; Friday produced what he calls a small Judas swing down into equilibrium and then expanded into the close (21:31, 21:53, 22:14).
- Second week: the low formed on Monday after price reached the equilibrium point of the overall macro consolidation he defined in lesson five; Tuesday traded back down into the same old low, which he calls another retouch of that equilibrium, and then accelerated higher; Wednesday gave another long opportunity off a bullish breaker formed from Monday’s high, with Wednesday’s low forming against it; Thursday was slightly bullish and Friday closed relatively flat (22:27, 22:48, 23:08).
He also refers to two other weeks in passing to show the same pattern repeating: in one, price traded down into a fair value gap from a deep discount and then up into a bearish order block; in the following week it traded into the equilibrium of the total macro range and back into an old bullish order block from the previous week before closing inside a fair value gap (19:06, 19:27). The instrument is identified only as the pound, and the individual chart dates are not all stated in the narration.
The weekly pip objectives he states
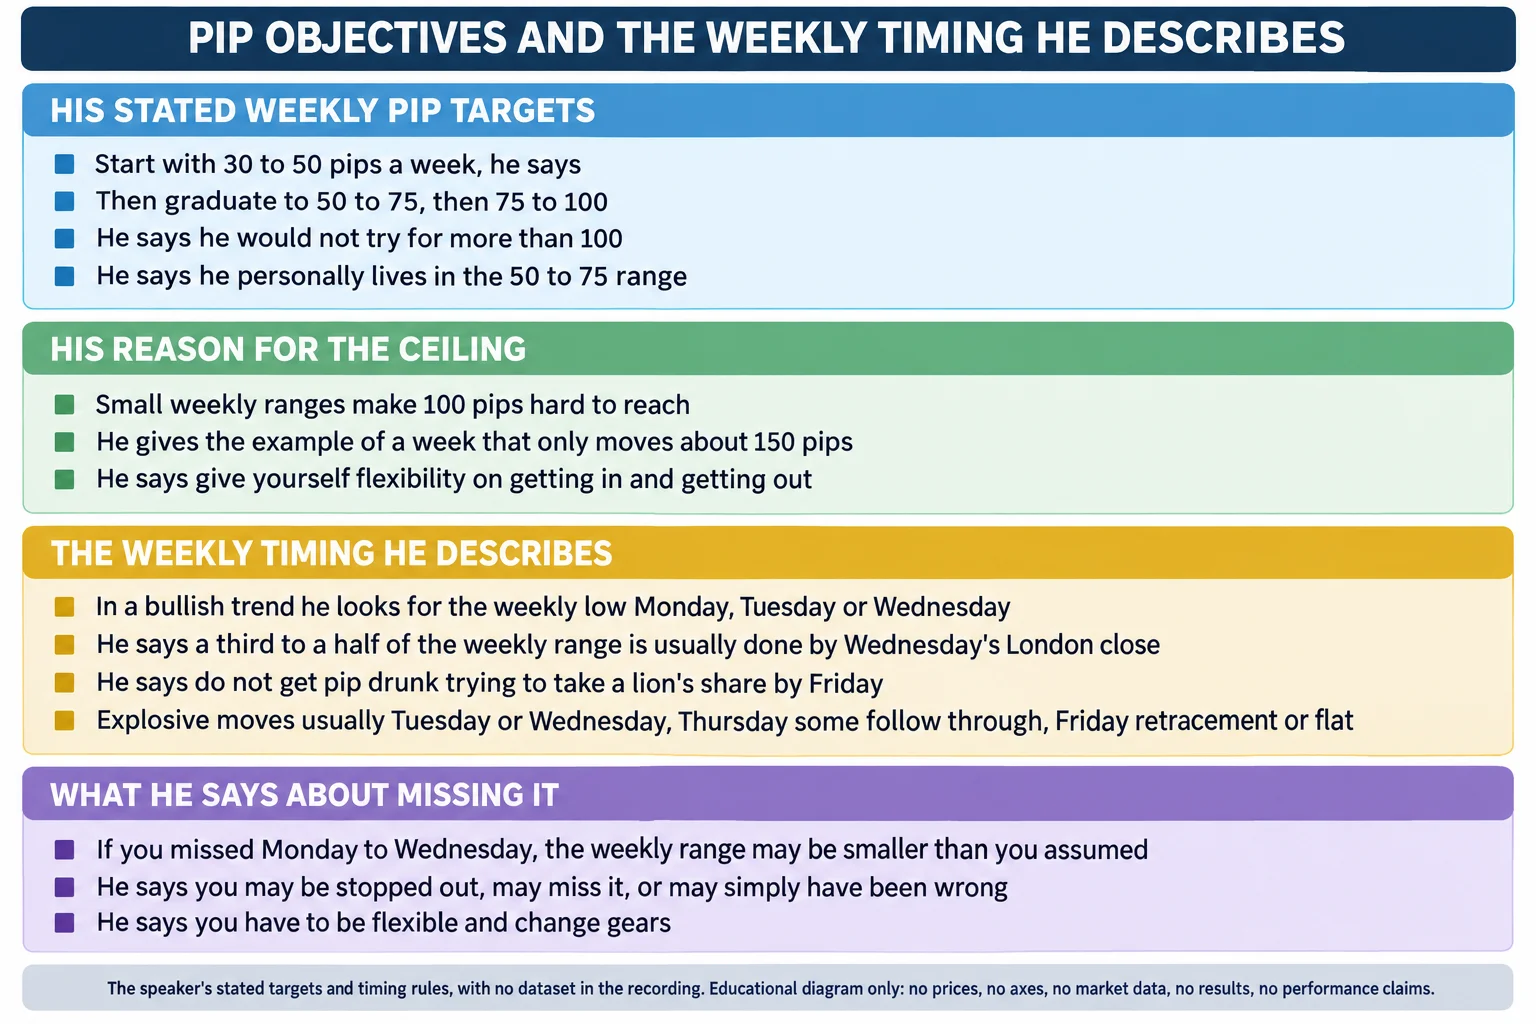
He says the absolute weekly low is not required for a one-shot-one-kill trade; what is required is one setup that makes logical sense and offers a realistic pip objective (7:03). He then states his own targets in stages: start by looking for 30 to 50 pips a week, graduate into 50 to 75, then 75 to 100, and he says he would not try to go beyond 100 (7:13). He adds that he personally lives in the 50 to 75 range but that it is for the trader to suit themselves (7:24).
His reason for the ceiling is worth stating because it explains the logic: you will not always get big weekly ranges, sometimes they are small, and if the week only moves about 150 pips then a 100-pip objective is hard to reach (7:33). He says that means defining a workable entry and exit rather than demanding the full move, and describes taking a portion of the weekly range as sufficient (7:39, 7:51). Those pip figures are his personal preferences as he states them, not demonstrated results, and nothing in the recording shows them being executed.
Where he expects the week to form, and the timing claim
In a trending bullish environment he says he expects price to move from discount to premium, and that means looking for the weekly low to form on Monday, Tuesday or Wednesday, which he calls the highest probability trading days in that environment (20:41). He states the reverse applies when the expectation is lower prices from a premium down to a discount. The criterion is directional and conditional, so the day-of-week filter only applies once the trend premise is set.
The timing claim is the one to handle carefully. He says that typically 30 to 50 percent of the weekly range is completed between Monday and Wednesday, in other words by London close on Wednesday, and repeats it later as a third or half of the weekly range being done by that point (23:35, 25:02). He gives no dataset, sample or method for that figure, so it is his stated heuristic rather than a measured statistic. The practical consequence he draws from it is the useful part: if you missed the Monday-to-Wednesday window and the range has already developed, do not chase a full move into Friday’s close, because the remaining range may be smaller and less volatile than expected (24:48).
He also describes how the week usually distributes itself when it does work: an explosive move typically on Tuesday or Wednesday, some follow through on Thursday, and then Friday either retraces or closes roughly flat, as in his second example (25:18). He adds that he would not expect a massive move higher or lower in the last two days of the week (25:09). These are his descriptions of the two weeks he shows and of his general experience; they are not tested frequencies.
What this lesson does not establish
- No performance evidence. No sample, no win rate, no equity curve, no fill report, no transaction costs and no forward test. The weekly pip targets are stated objectives (7:13).
- The 30 to 50 percent timing figure is unsupported in the recording. It is given as a general description of weekly ranges with no dataset attached (23:38).
- The chart detail is his narration. The instrument is identified only as the pound, individual chart dates are not all stated, and no prices are given in the recording for the levels he describes (1:11).
- No first-hand chart verification. The comments above rest on the spoken captions. Nothing here is a claim about what the on-screen candlesticks showed beyond what he says about them.
- PD arrays are assumed, not defined. He assumes the viewer already knows what a PD array is and that the range work was covered in lesson five, so this lesson does not define order blocks, fair value gaps, breakers or mitigation blocks (10:00, 9:42, 19:24).
- The trend-reversal half of the topic is deferred. He says how to know when an intra-week reversal is coming will be built on in the next lesson (25:39).
A note on the transcript: this is an auto-generated caption track and it mishears several terms. It renders “IPDA” as “if the data” (0:32), “PD arrays” as “PDA arrays” (19:57), “trending” as “training” (0:27, 1:50), “bullish” as “bullish” and “selling” as “cell” in places, “intra-week” as “inch or week” (25:44), “pivot points” as “private points” (11:51), “pip” as “pit” (7:21), “read trade” where the audio is unclear (22:41) and “com this process” as a false start (23:29). It also inserts repeated non-speech artifacts rendered as “foreign” where the audio is unclear. The labels used above are the ones the surrounding context supports.
Watch the original recording
ICT Mentorship Core Content – Month 07 – Short Term Trading Low Resistance Liquidity Runs Part 2
The Inner Circle Trader · YouTube page dated 29 September 2022 · about 25 minutes 51 seconds. This recording is the primary source for every timestamp link above.
The recording is not embedded here because the video owner has disabled playback on other websites. That was tested directly in a real player on 15 September 2026 from a BestProps page origin at both desktop and mobile widths: the iframe loads and then reports “Playback on other websites has been disabled by the video owner” with no duration and no playback progress. The video itself plays normally on YouTube, so no empty or half-working player is left on this page.
The watch page was read on 15 September 2026 and rendered as a public video: ICT Mentorship Core Content – Month 07 – Short Term Trading Low Resistance Liquidity Runs Part 2 by The Inner Circle Trader, upload date 29 September 2022, listed duration 1,551 seconds and neither private nor unlisted. The caption track used for this article covers about 1,551 seconds, matching the listed duration.
Resources
These are the sources checked for this article. The regulator and investor-education pages are general material about day trading and about trading systems sold to the public; neither assesses the speaker, verifies any range, level, pip target or timing figure above, nor endorses anything said in the recording. Any ICT, smart-money or third-party indicator, script, note set, transcript pack, chart annotation or re-upload circulating outside the publishing channel’s own page is unofficial and untested here.
- [1] ICT Mentorship Core Content – Month 07 – Short Term Trading Low Resistance Liquidity Runs Part 2 — The Inner Circle Trader (primary source; watch page read 15 September 2026, 1,551 seconds).
- [2] The Inner Circle Trader — official YouTube channel (read 15 September 2026).
- [3] Investor.gov (SEC) — Day Trading (read 15 September 2026) — the regulator’s definition, which states that day trading is extremely risky and can result in substantial financial losses in a very short period of time. Relevant to a lesson that sets weekly pip objectives.
- [4] CFTC — Fraud Advisory: Commodity Trading Systems Sold on the Internet (read 15 September 2026) — the regulator’s guidance on evaluating trading systems sold to the public, including its warnings about hypothetical results calculated from prices that occurred in the past.
Source: ICT, ICT Mentorship Core Content – Month 07 – Short Term Trading Low Resistance Liquidity Runs Part 2, The Inner Circle Trader, YouTube page dated 29 September 2022. Automatic YouTube captions were the transcript used for this article; that track mishears several terms as listed above, and the labels used are the ones the surrounding context supports. The range-grading method, the weekly exercise, the pip objectives and the Monday-to-Wednesday timing are the speaker’s stated rules and interpretations, reported with no fills, no sizes, no costs and no account results, and the chart levels he narrates were not independently verified. This commentary is educational and is