
Key takeaways
ICT lesson five teaches low-resistance liquidity runs in consolidations by combining 20, 40 and 60 trading-day lookbacks with premium and discount price-delivery arrays.
Read the full summary
ICT lesson five teaches low-resistance liquidity runs in consolidations by combining 20, 40 and 60 trading-day lookbacks with premium and discount price-delivery arrays. On a daily GBP/USD chart, first classify the market as consolidating, define the roughly three-month range from the highest and lowest candle bodies rather than wicks, mark the 50% midpoint, halve both sides into quadrants and optionally halve them again so every subdivision has its own premium and discount. Favor longs, buys and short covering in discount when paired with bullish order blocks, breakers, fair value gaps or sell-stop runs, and favor shorts, sells and long profit-taking in premium when paired with bearish order blocks, fair value gaps, rejection blocks, breakers, mitigation blocks or old highs. A local discount can support a long even inside the overall premium half if higher premium arrays remain reachable. On a daily setup, use four-hour or one-hour premium arrays as first long objectives, reverse the logic for shorts, prefer untouched arrays, and avoid the midpoint when directional bias and liquidity targets are unclear. One-shot-one-kill trades may last from one day to one week rather than strictly Monday through Friday. ICT cites a 100-pip move, but the captions provide no fills, sample size, hit rate, independent testing or verified results, and changing the lookback, using wicks or classifying the regime differently changes every derived level.
How we researched this article
BestProps used document-based research from primary firm sources, checked September 24, 2026. The complete source list, scope, limitations, and commercial-state record appear near the end of this article.
ICT Short Term Trading With Time and Price
The lesson opens by naming itself as lesson five of the short-term-trading module and the topic as low-resistance liquidity runs and consolidations (0:15, 0:18, 0:20). Before any chart he restates the two ingredients, saying every setup he stalks is based on time and price: the time element comes from the data ranges over the last 60, 40 and 20 days, and the price element is premium and discount price-delivery arrays (0:29, 0:40, 0:45, 0:53).
He then sets the lookback: for short-term trading he says the work happens inside the range of the last three months, and he treats the 60-day data range as the lookback period that contains everything needed to frame a short-term trade or a one-shot-one-kill setup (0:57, 1:01, 1:06, 1:08). The model of price he describes is movement from a premium array to a discount array or the reverse, with a time element in between drawn from those same data ranges (1:22, 1:25, 1:30, 1:40).
ICT Trading Range on the Cable Chart
The case study is a daily British pound / US dollar chart, which he says is a market that has been consolidating rather than trending, and his instruction is to make that trend-or-consolidation call first. On a daily chart he treats the working frame as about three months, or 60 trading days (2:03, 2:06, 2:12, 2:17, 2:28, 2:46).
The boundary definition is the specific part. He defines the range using the highest and lowest candlestick bodies over the 60 days, and says he is not concerned with the wicks: either the open or the close counts, whichever is the highest, and the same for the lowest. That produces the consolidation range, and he marks it on the chart (3:02, 3:10, 3:16, 3:22, 3:31). He then uses a Fibonacci tool from the highest body to the lowest body, notes the 50% level, and draws a horizontal line there as the midpoint of the whole consolidation (3:43, 3:52, 4:04, 4:13, 4:25, 4:35).
Halving the ICT Trading Range
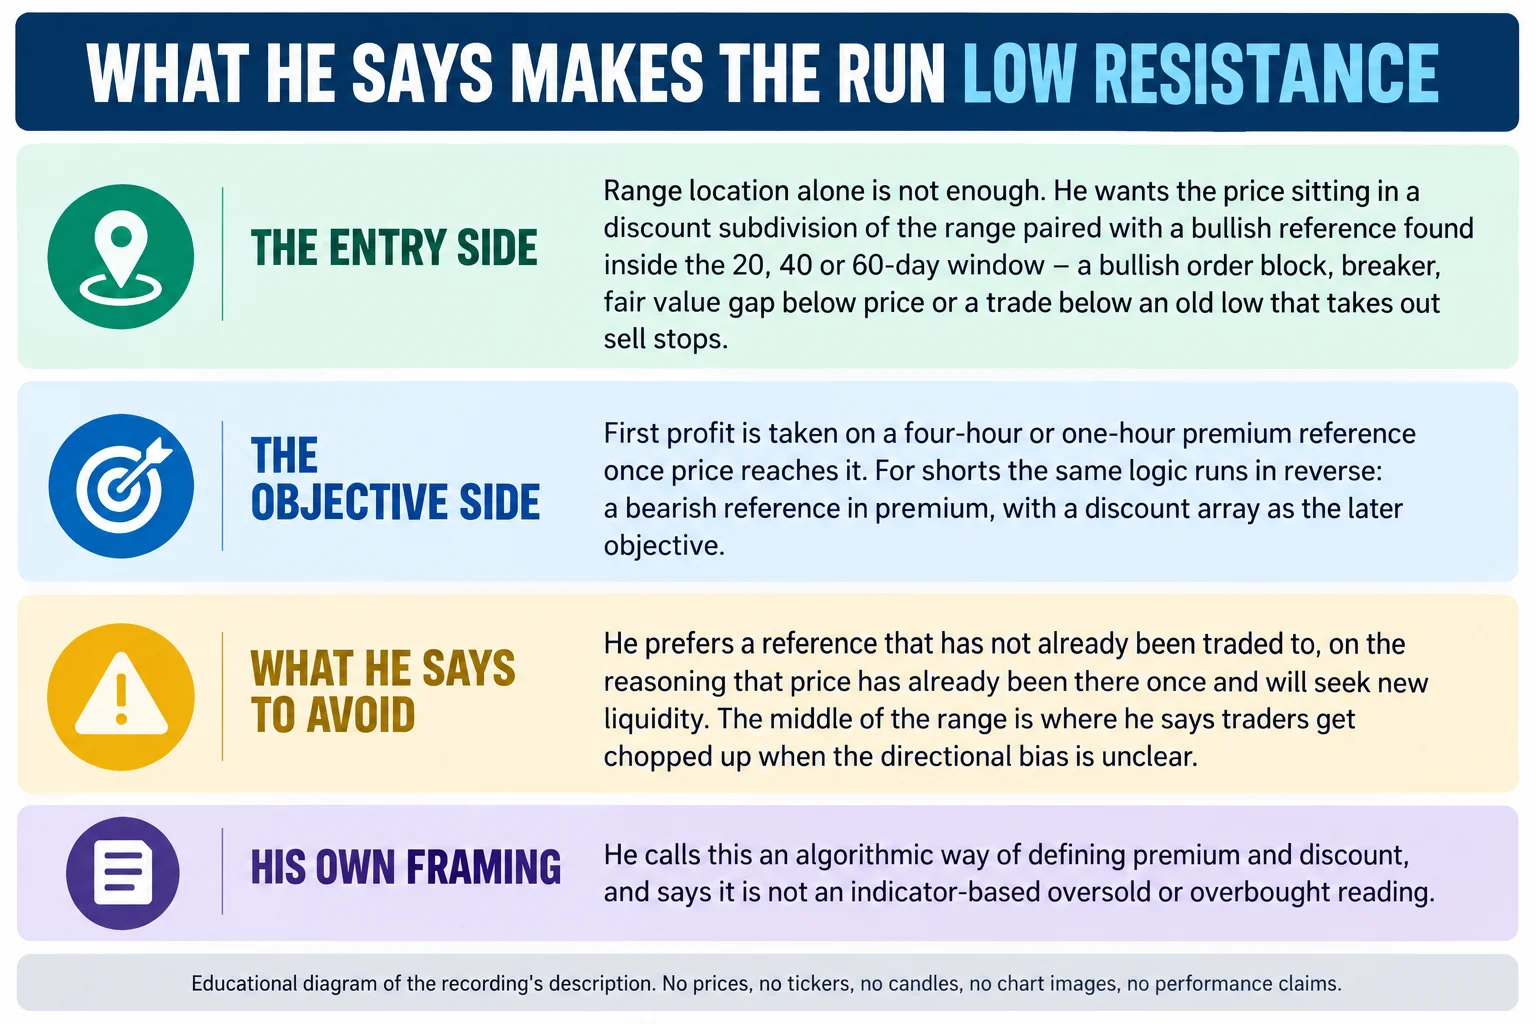
The next step is what makes the method distinctive. He measures the 50% level of the upper portion between the highest body and the midpoint, and the 50% level of the lower portion between the midpoint and the lowest body, drawing a horizontal line at each. That gives him quadrants, and anything above the midpoint he calls premium while anything below is discount (4:49, 4:55, 5:04, 5:15, 5:33, 5:53, 6:28).
He then identifies the price-delivery arrays inside each of those new ranges, and says he saves time by applying everything from the monthly, weekly and daily timeframes rather than walking each one (6:46, 6:49, 6:54). The rule he states for shorts is that the highest-probability ones look for any array in the premium range of the consolidation (anything above the midpoint) and that it must be coupled with an array to qualify, with the move then expected to correlate to a later discount array. His example of that pairing is a fair value gap and bearish order block in premium around February 2017, paired with a weekly bullish order block threshold in discount in March 2017 (7:23, 7:35, 7:37, 7:48, 7:55, 8:26, 8:37, 8:49).
The quadrants then get halved again, and he says each new subdivision can be read on its own premium and discount terms. Inside the lower quadrant that produces discount arrays in a discount range, which he calls high-probability short-covering objectives or new long positions, with a first profit best taken once price enters the premium range of that same matrix. He repeats the construction on the new quadrants, this time describing ideal longs entered at the discount level with the first long exit in the premium range (8:59, 9:22, 9:36, 9:52, 10:13, 10:20, 10:27, 10:41).
He states the timeframe handoff explicitly: because the chart he is working on is daily, the four-hour and one-hour charts are where he expects to find premium arrays to pair with first objectives, and he describes the daily view as giving the elements rather than the targets (10:43, 10:47, 10:57).
ICT Long Trades in the Premium Range
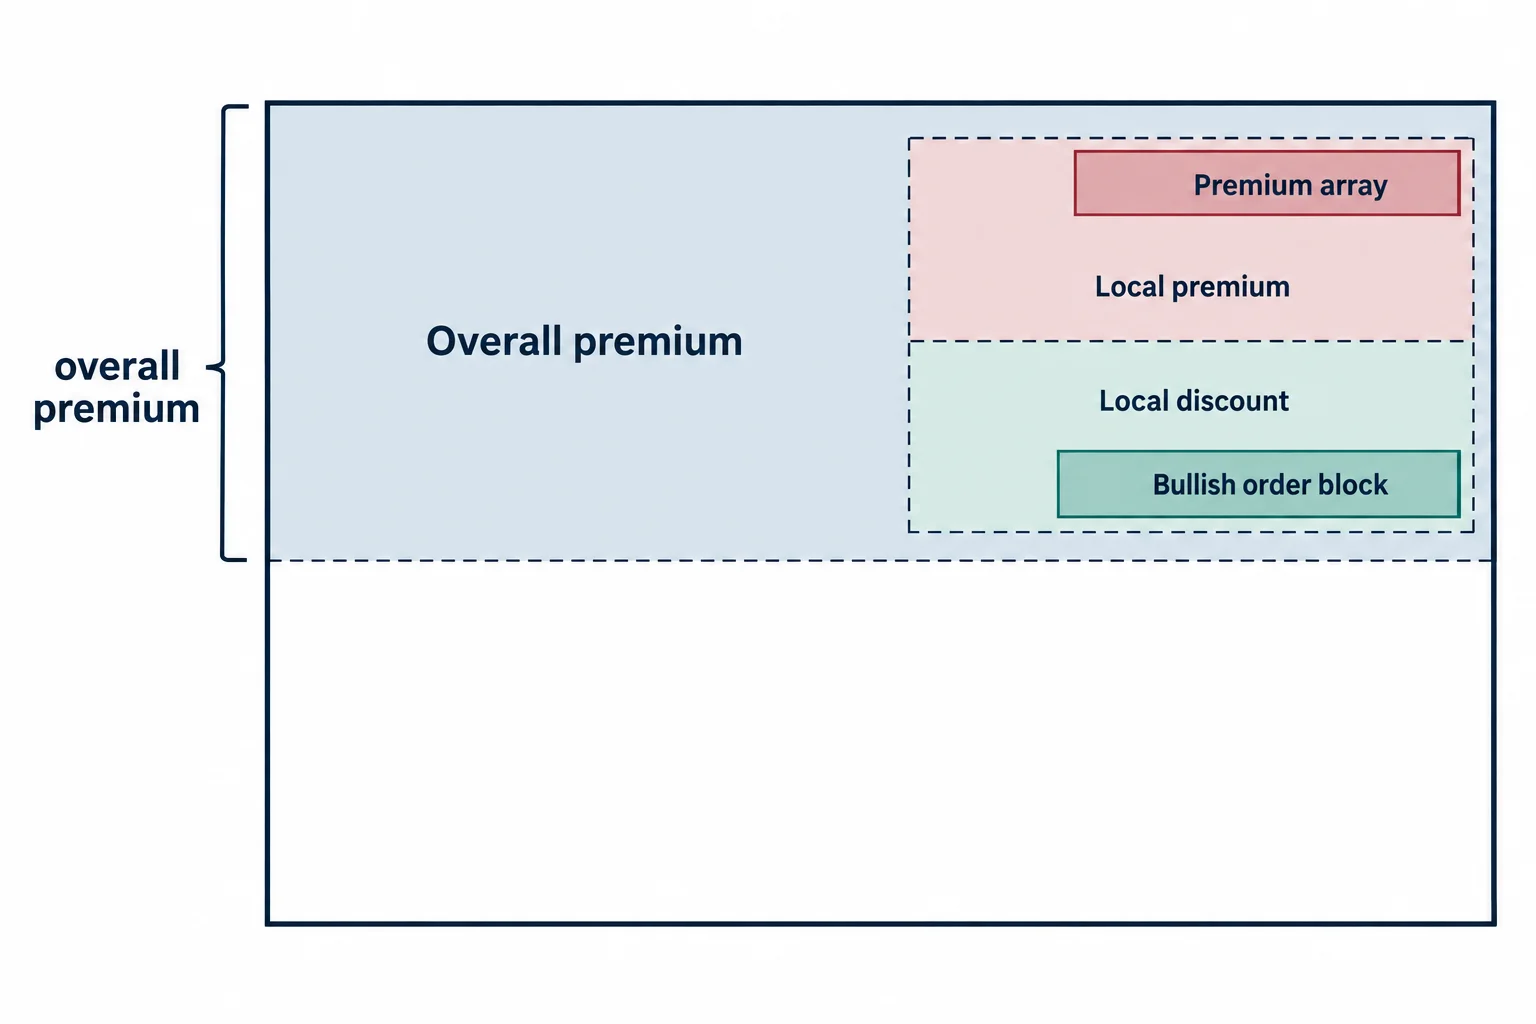
This is the part of the lesson that would otherwise look contradictory, and he addresses it directly. Even when price is above the midpoint of the total consolidation and therefore in an overall premium market, he says longs can still be taken if they are defined in the smaller scope: the halves divided into quadrants and the quadrants divided again, all read incrementally as price works higher through the consolidation (11:53, 12:00, 12:08, 12:15, 12:19).
His stated justification is room: buying a bullish order block mean threshold in a discount location even while the overall frame is premium, because price still has higher premium arrays within reach above it (12:24, 12:32, 12:36, 12:44, 12:51, 12:56). He contrasts that with indicator readings, saying that what would otherwise be judged overbought is not viewed that way here, and that this is why he does not rely on indicators for the classification. The range defines which entries he treats as undervalued for longs or overvalued for shorts (13:03, 13:08, 13:15, 13:20, 13:29).
He also names the arrays he is looking for at those discount locations: within the 20, 40 and 60-day data range, fair value gaps, bearish order blocks and weekly rejection blocks on the premium side, and on the entry side bullish order blocks, breakers, fair value gaps below price, and price trading below an old low to take out sell stops. The stated intent is to blend time and price rather than read a mathematically derived oscillator line (14:09, 14:17, 14:24, 14:37, 14:46, 14:52, 15:17, 15:24, 16:01, 16:55, 17:00).
He adds an oscillation argument for why the overall premium label is not decisive: price can move back and forth inside the range, sometimes making a slightly higher high and returning inside, sometimes dipping outside the low and coming back to the middle. He describes his approach as anticipating that isolation effect while noting that smaller consolidations exist within the larger one, and he states the summary version of it, a discount market inside an overall premium market that still has room to go up (15:26, 15:33, 15:40, 15:46, 15:57, 16:36, 16:42).
ICT Range High and Liquidity Run
At the top of the larger consolidation he says an opportunity still exists, but that the opportunities fall off precipitously in probability terms, and he lists the arrays he says are more influential there: bearish order blocks, old highs, bearish breakers and bearish mitigation blocks (17:19, 17:26, 17:29, 17:36, 17:40, 17:43).
From there he narrates a sequence on the chart: a weekly rejection block price traded from in March 2017, a move away from a fair value gap and bearish order block, and a significant sell-off from the last midpoint that traded back down into a daily bullish order block mean threshold. He then says there was a 100-pip move called for in his day-to-day meetings and charts, and describes the response trading back up to a daily bearish order block that also overlapped the premium 50% level (17:58, 18:03, 18:12, 18:28, 18:36, 18:48, 19:03, 19:08, 19:13, 19:21, 19:26). That pip figure is his own account of a call made in his meetings. The captions do not establish when it was given, whether it was actionable at the time, or what any participant did with it, and this article asserts none of those things.
Low Resistance Liquidity Runs Explained
He closes by tying the name of the lesson to the construction: what he is looking for is low-resistance liquidity runs from one price-delivery array to another, from discount to premium, with the three-month lookback as the coupling element, and he says one-shot-one-kill setups work inside the last three months of trading (20:01, 20:05, 20:10, 20:12, 20:17). He describes the practical use of the 20, 40 and 60-day lookback as answering two questions: where the premium matrix is leading him for sells and where the discount matrix offers levels to cover shorts (20:20, 20:26, 20:34, 20:44, 20:49).
He also widens the definition of the model in passing. He says one-shot-one-kill is not defined by entering on a Monday and exiting on a Friday: it is a few days of trading, short-term trading that can be as little as one day and as long as a week (22:29, 22:32, 22:36, 22:40, 22:42, 22:44).
The best-case summary he gives is positional: the best buys are in the lower portion of the overall consolidation and the lower quadrant, the discount matrix, while the highest-probability sells and long exits are in the premium range, in the last quadrant at the top. The further up the consolidation price reaches in a premium market, the easier he says it is to reach a profitable discount array from a short, and the lower price sits, the easier it is to reach a profitable premium array from a long (21:08, 21:15, 21:25, 21:36, 21:44, 24:14, 24:21, 24:31, 24:38).
ICT Liquidity Arrays and the Range Midpoint
The final section holds the qualifications, and they are the most useful part to keep separate from the technique. He notes that if a range is incorrectly defined, or if the premium and discount arrays being examined have already been traded to, the likelihood of an array behaving as expected falls off because it has already been used. His stated preference is a new array in a discount or premium market that has not been traded to, on the reasoning that price has been there once already and will seek new liquidity instead (22:53, 23:05, 23:17, 23:22, 23:31, 23:35).
On the middle of the range he is blunt: that is where traders get chopped up the most, and the condition he attaches is directional bias. If you are not strong on where the market is likely to reach next, including where the open float and the buy and sell stops sit, the middle is where it hurts (23:45, 23:47, 23:49, 23:56, 24:01, 24:06). He also says this is the part that requires the viewer’s own work: breaking down charts and studying them, because he will not be there to point the opportunities out (19:34, 19:42, 19:47, 19:54).
Low Resistance Trading Checklist
This is a general educational ordering of what he describes, not a tested system and not his own wording:
- Classify the daily market as trending or consolidating before doing anything else.
- Define the consolidation range from the highest and lowest candle bodies across the last 60 trading days, not the wicks.
- Mark the 50% midpoint, then halve each side, then halve again if the subdivisions are still useful.
- Map the price-delivery arrays across the 20, 40 and 60-day windows into those subdivisions.
- Pair a discount location with a bullish array for a long, or a premium location with a bearish array for a short, and take the first profit against a four-hour or one-hour array on the other side.
- Prefer arrays that have not already been traded to, and treat the middle of the range as the low-clarity zone he describes.
Two practical caveats follow from the construction itself. Changing the lookback, using wicks instead of bodies, or disagreeing about whether the market is consolidating will each move the boundaries and therefore every zone derived from them. And the transcript is a description of a discretionary method: it contains no sample, no measured hit rate and no independent test of how often these runs complete, so none of the probabilities he attaches to particular locations can be checked from the recording.
ICT Trading Caption Accuracy
The transcript used for this article is the automatic YouTube caption track for the recording, not a human-checked transcript, and it mishears several terms. Where the track is plainly wrong and context makes the intended word unambiguous, the term has been normalised: “the upto data ranges”, “the if the data range” and “the ipta data range” are the data ranges, “the Wix” is the wick, “cell scenarios” is sell scenarios, “the pdra Matrix” and “PDA rate” are the PD array matrix, “Bears order blocks” and “bare shorter blocks” are bearish order blocks, “bull shoulder block” is bullish order block, and “lungs” where he is describing exits is longs. Where a term could not be resolved confidently it has been described rather than quoted. The recording leans heavily on chart narration, and this article reports only what he says about the charts he is showing.
Watch the ICT Liquidity Runs Lesson
ICT Mentorship Core Content – Month 07 – Short Term Trading Low Resistance Liquidity Runs Part 1
The Inner Circle Trader · published 28 September 2022 · about 25 minutes. This recording is the primary source for every timestamp link above.
The recording is not embedded here because the video owner has disabled playback on other websites. That was tested directly on 15 September 2026 from a BestProps page origin at both desktop and mobile widths: the embedded player loads, then reports “Playback on other websites has been disabled by the video owner” with no duration and no playback progress, while the video itself plays normally on YouTube. No empty or half-working player is left on this page.
The watch page was read on 15 September 2026 and is publicly listed as ICT Mentorship Core Content – Month 07 – Short Term Trading Low Resistance Liquidity Runs Part 1 by The Inner Circle Trader, upload date 28 September 2022, listed duration 1,503 seconds (about 25 minutes, 3 seconds). The caption track used for this article runs to 1,502.84 seconds, so the transcript and the listed duration agree. The upload date is separate from the period under discussion: the lesson identifies itself as lesson five of the short-term-trading module and uses a cable example set in 2017.
ICT Short Term Trading Resources
These are the sources checked for this article. The regulator and investor-education pages are general material about short-term trading and about how trading systems and advisory services sold to the public should be assessed; neither one evaluates this speaker, verifies any range, subdivision, array or probability described above, nor endorses anything said in the recording. Any ICT, smart-money or third-party indicator, script, note set, chart annotation, transcript pack or re-upload circulating outside the publishing channel’s own page is unofficial and has not been tested here.
- [1] ICT Mentorship Core Content – Month 07 – Short Term Trading Low Resistance Liquidity Runs Part 1 The Inner Circle Trader (primary source; watch page read 15 September 2026, listed duration 1,503 seconds).
- [2] The Inner Circle Trader (official YouTube channel) (read 15 September 2026), the publishing channel for the recording used here.
- [3] Investor.gov (SEC), Day Trading (read 15 September 2026), investor education describing day traders as buying, selling and short-selling through the day in the hope of locking in quick profits, and stating that day trading is extremely risky and can result in substantial financial losses in a very short period of time.
- [4] CFTC, Fraud Advisory: Commodity Trading Systems Sold on the Internet (read 15 September 2026), the regulator’s guidance on assessing trading systems and advisory services sold to the public, including its warning that hypothetical trading results typically are based on simulations using historical price data and may overestimate or underestimate a system’s performance.
Source: ICT,