
Key takeaways
Lesson seven of the ICT short-term trading module says an unusually fast Monday or Tuesday move well beyond the average daily range of the previous five days should trigger consideration of an intraweek reversal rather than extrapolation, because price may be rushing toward a higher-timeframe valuation or institutional order-flow reference point.
Read the full summary
Lesson seven of the ICT short-term trading module says an unusually fast Monday or Tuesday move well beyond the average daily range of the previous five days should trigger consideration of an intraweek reversal rather than extrapolation, because price may be rushing toward a higher-timeframe valuation or institutional order-flow reference point. The cable example begins in the premium portion of the lesson-five range, falls more than 200 points in roughly 24 hours, reaches the mean threshold of a daily bullish order block on Wednesday, breaks a short-term high, rallies toward a four-hour bearish order block and fair value gap, then returns toward the prior balance range. ICT maps this sequence to a market maker buy profile comprising balance, an aggressive Tuesday sell-off, a Tuesday-to-Wednesday reversal, a Thursday low-risk buy and Friday reaccumulation, while noting that price may stop at the old balance range or exceed it to seek liquidity above a prior high. Overlapping models occur when lower-timeframe continuation signals conflict with monthly, weekly, daily or four-hour reversal context, and his rule is that the higher timeframe wins, with four hours the lowest higher-timeframe boundary and lower charts treated as day-trading material. The framework is interpretive rather than predictive, ICT concedes setups can be wrong and that he does not know the central-bank changes behind repricing, and the chart lesson provides no reconstructible entry, fill or result.
How we researched this article
BestProps used document-based research from primary firm sources, checked September 24, 2026. The complete source list, scope, limitations, and commercial-state record appear near the end of this article.
How ICT Frames Intraweek Market Reversals
In ICT Mentorship Core Content – Month 07 – Intraweek Market Reversals & Overlapping Models, he opens by naming the lesson as the seventh of the short-term trading module and the subject as intraweek reversals and overlapping models (0:08). The framing he returns to throughout is time and price (0:26), and he places the topic inside the earlier intraweek and intraday market reversal profiles he says he taught when publishing for free (0:46).
His description of the experience that motivated the lesson is personal rather than statistical. He says he would have a trade that was working and profitable, and then something would happen midweek and it would reverse completely until it either stopped him out or pressured him enough to leave (1:22). He then says the reversal profile is one of the hardest things for him to teach because it cannot be understood through a single discipline (it needs a working grasp of swing, short-term, day and position trading at once (1:56)) and that his own ability to read price comes from blending every timeframe rather than working in one (7:15). He adds that a trader with a single-discipline, myopic view of price action ends up weaker even inside that one discipline (7:58). Those are his claims about his own method, not findings this article verified.
ICT Intraweek Reversal Signs in Speed and Distance
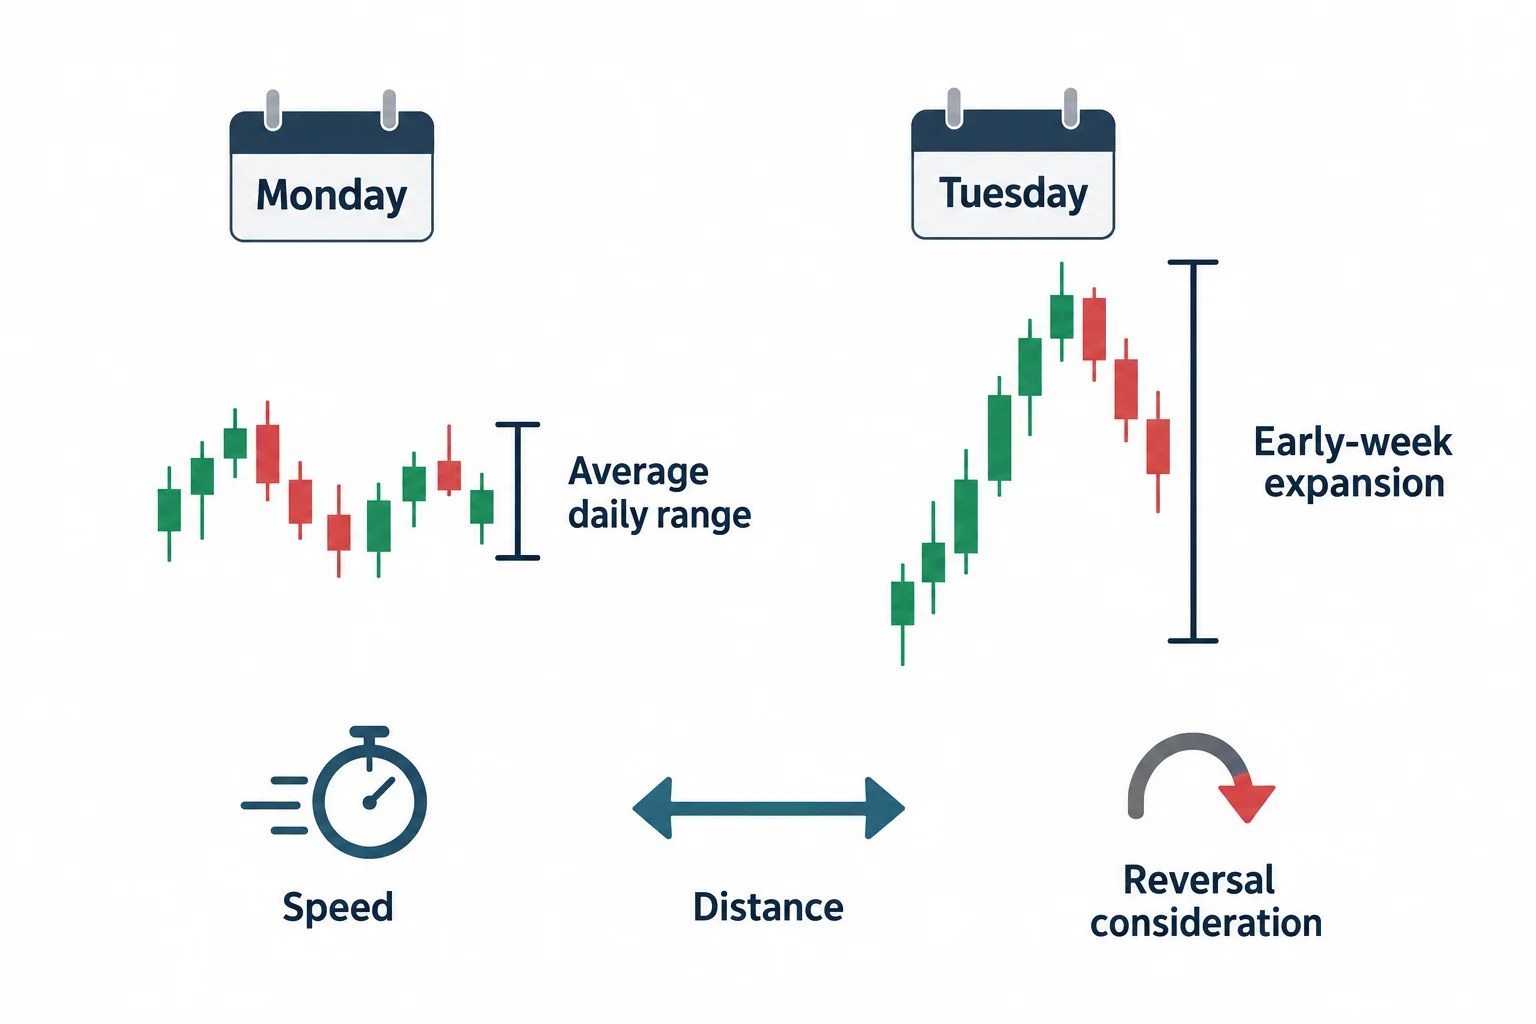
The core idea is stated most compactly at the end and then repeated through the middle of the lesson. The number one characteristic to watch, in his words, is the speed at which price moves on Monday and Tuesday together with the magnitude of that move (27:56). The measurement he gives is against the average daily range of the last five days: if a move gets well above that average, he says the chances are you are going to see a market reversal profile, while stressing that this only means it should be considered, not that it will happen (20:56).
He frames the same thought as an early-week hurry: when the market quickly starts trading on Monday or Tuesday, aggressively and speedily, that is usually the telltale sign that it is in a hurry either to make its weekly range or to reach an institutional order flow reference point that could cause it to turn and go the other way (12:53). His reading of a fast move is therefore the opposite of extrapolation: speed in price, he says, is indicative of the market getting to a valuation point rather than a reason to project an equal move later in the week (14:31), and he explicitly warns against the thought that a quick move means more money in double time with an equal leg lower to come (14:11).
He also distinguishes a repricing from a move driven by buying and selling. Using interest rate announcements as the example, he says there is very little time between price before the release and price after the rate change, that this is not attributable to buying and selling but to a repricing at the central bank level (14:57), and that the repricing is a response to central bank intervention or an interest rate announcement (15:11). Where there is no central bank involvement and price is simply moving fast, he attributes it instead to evaluation through speculation (buyers and sellers repricing the market down from a premium into a discount array (15:23)). That attribution is his model of who moves price and why; the recording contains no evidence of central bank activity, and he does not claim to have any.
Market Reversal Context in the Premium Range
Before any of the reversal evidence, he establishes where price sat. His example is the British pound against the dollar, and he points out a low that formed during the week of the recording itself, which is why he says he waited for that week to close before using it (3:30). The starting condition is a market classified in the premium range of the PD array matrix, as defined by the large trading range he set out in lesson five (4:20), having traded up into a weekly rejection block or an older bearish order block on the daily chart (4:32).
From there he says the expectation was a decline into a lower-level PD array in the discount, not gradually across the week, but inside a matter of about 24 hours (4:50). The figure he gives is a move over 200 points in that period (5:00), and his point is that the market reached a level with speed and for a reason (5:06). On the daily chart he identifies a bullish order block mean threshold, and says price reached right into it on the Wednesday (5:18).
What he does with that speed is the interpretive step. He says that when the market moves fast you have to assume it is reaching for an institutional order flow level that is critical for efficiency at the interbank level (5:38), and he offers two possible forms for it: global commerce or a repricing at the central bank level (5:47). He also notes that although the whole range from Tuesday into Wednesday’s low took time to drift down, the anticipation was formed at the beginning of the week and he says it is prudent to stick to that plan, because over a career a reversal like this will catch you occasionally (6:14).
ICT Market Reversal Steps in the Cable Example
The teaching runs the same week through progressively smaller timeframes, and he is explicit that this is deliberate. He says the first thing to notice is that price is unwilling to leave the premium, sitting in the upper portion of the larger trading range defined in lesson five (8:54), and that without an understanding of the PD array matrix and its discount arrays a trader would easily have expected the market to keep trading lower, perhaps to a fair value gap or to an old low made in January (9:15). His comment on that view is that it is myopic, and that it is the view that breaks accounts and careers (9:30).
On the daily chart he isolates the first two days of the week running into Wednesday’s low and calls the range extraordinary, pointing at the length of the Tuesday down candle and saying it is many times larger than the general average of the candles around it (10:04). The point he draws out is the speed of a single trading day’s travel to a specific institutional order flow reference point (10:35).
On the four-hour chart the same week is marked out as one range, and he describes price returning to a discount PD array and reversing intraweek, while conceding that the read is perfect in hindsight (11:06). The low forms on Wednesday’s market low at the daily bullish order block mean threshold (11:29); after the bounce there, he says price is drawn up into a four-hour bearish order block as a premium PD array (11:49), reaching it efficiently and with very little movement below the daily level (12:09).
On the hourly chart he repeats the large decline from the start of the week, and then names it directly as the classic telltale sign of a potential market reversal profile (12:40). The day-by-day read he gives is Monday starting as a potential high-of-the-week profile, rallying from Sunday’s opening, declining a little, rallying again into the London session on Tuesday and then trading aggressively lower into the changeover from Tuesday into Wednesday to create the low of the week, followed by an aggressive move off that low (13:15). The instruction attached to that pattern is to immediately start looking for higher-timeframe PD arrays that could be the catalyst for an intraweek reversal (13:58).
He then explains why he still wanted premium arrays despite the market being in a premium range overall. His argument is that the market showed a willingness not to leave that premium market (it did not continue lower from Wednesday into Thursday into the discount), so if it was not going to go lower and wanted to go higher, the focus belongs on premium PD arrays (17:09). To make the point he leans on the earlier lesson's idea of grading smaller modular ranges into premium and discount arrays inside the larger range (16:09), and compares the situation to bearish divergence on a momentum indicator, where momentum diverging does not oblige price to turn (16:42).
The forward evidence he cites is a break of a short-term high on the Wednesday and what he calls evidence of institutional sponsorship at every bullish order block (each down candle or series of down candles extended in time, being capitalised with new long positions, and confirmed by price surging quickly away from the level (17:24)). That rally carried into a fair value gap as another premium PD array (17:59). The sponsorship language is his description of price behaviour; nothing in the recording identifies the parties he is referring to, and he states elsewhere in the lesson that he cannot know what they are doing.
Market Reversal Balance and the ICT Buy Model
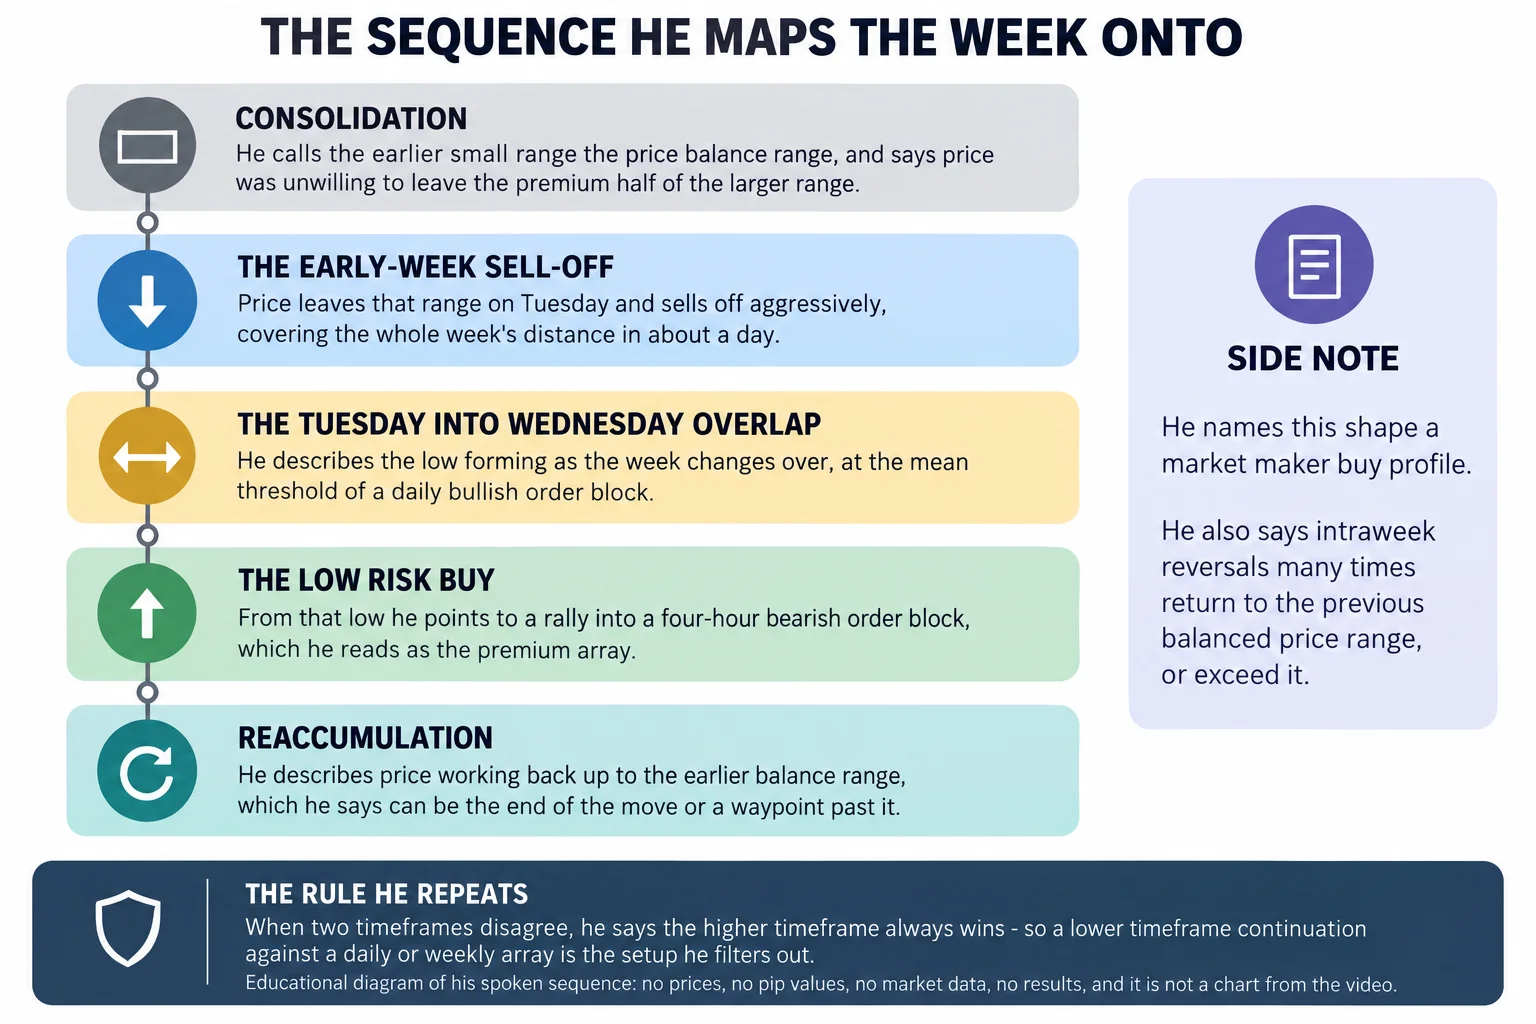
He then states the general behaviour: intraweek reversals will many times look to return to the previous balanced price range, or exceed it (18:06). He maps the recorded week onto what he calls a market maker buy profile and, in the abstract, a market maker sell or buy model (18:17): a consolidation he names the price balance range, a departure on Tuesday with an aggressive sell-off (18:34), what he describes as a smart money reversal into the Tuesday-into-Wednesday overlap, a low-risk buy on the Thursday, and a continuation for reaccumulation on Friday (18:44). Price, he notes, traded up into that balance range all over again (19:00).
Two qualifications follow, and both matter. The first is that reaching the balance range can be the end of the move, it may have been all that was necessary (19:10). The second is that price may exceed it, which he says is what a market maker buy profile really aims to do by taking out the liquidity above a prior high, noting that the week produced a lower high on Tuesday than Monday so it may not need to (19:15). He then gives a personal opinion, clearly labelled as one: between you and him, he thinks it will (19:37). The transcript never returns to say what price actually did afterwards, so that expectation is contemporaneous commentary and not a confirmed outcome.
How ICT Resolves Overlapping Models
The closing section is the part the lesson is titled for. Working from the one-hour chart and reviewing the same week day by day, he says intraweek reversals occur in overlapping models (25:59): every market reversal that happens intraweek, in his description, is an overlapping of two types of trading discipline that are at odds with one another (26:09). The rule he attaches is unconditional in his telling (the higher timeframe discipline will always win (26:21)), which is why he keeps the focus on monthly, weekly and daily PD arrays, and treats the four-hour chart as the lowest boundary worth using, with anything below it as day-trading material (26:27).
The practical expression of that rule is a filter: if the day-trading signals are not aligned with a higher timeframe such as the daily, weekly or monthly, then in his words you are not trading high-probability setups (26:38). The overlap he wants students to recognise is a lower-timeframe model pointing toward continued movement in one direction while a higher-timeframe model points toward a reversal in the other. His example is a swing trader’s buy arguing against a one-shot-one-kill sell-off, where the weekly range phenomenon being traded will face enough opposition to cause a reversal (27:24).
He also gives the swing-model version of the same chart, outlining the area as a premium and discount PD array matrix with the discount side graded into four quadrants and the premium side divided the same way (24:40), and pointing at the daily bullish order block being traded into as a swing trade entry, while warning that a trader who does not think in swing terms will not see it, and that these setups will evade such a trader and become a pitfall (25:11).
Limits of the ICT Intraweek Reversal Model
This is a chart lesson, so the transcript records what he says while pointing at price rather than the prices themselves. It contains no entries, no fills, no stop or target levels, no transaction costs and no outcome for any of the scenarios described, which means the cable week cannot be reconstructed or checked from the text alone. The 200-point, 24-hour figure and the descriptions of the daily and four-hour arrays are his characterisation of what the chart showed; the transcript gives no prices, dates or candle values to verify them against.
He is direct about the limits of the idea in two places. He says a plan can simply fail, using the illustration of a trader who read the start of the week as a potential high of the week and expected Friday’s close below Wednesday’s low, and then says plainly that sometimes you are going to get it wrong, just as he does (20:25). He also says the warning sign only prompts consideration rather than certainty (21:05).
Two further claims should be read as assertions rather than findings. He says Wednesday or Thursday reversals generally form every month on any pair (22:51), and that knowing the higher-timeframe PD arrays will help a trader recognise failures (the trade that is profitable but not behaving, where he says it is probably better to exit and look for another entry point (22:28)). Neither is accompanied by any measurement in the recording, and nothing in this article tests them.
ICT Market Reversal Caption Notes
This article was written from the video’s own auto-generated caption track, which is the primary source for every timestamp link above. That track mis-recognises some of the speaker’s vocabulary, and the affected terms were resolved only where the surrounding context makes the intended word clear: the PD array matrix appears variously as “pdra Matrix” and “RPD arrays” (4:32), interbank appears as “ipta” (15:35), and the price balance range appears as “price balanced range” in one place (19:00). No price, level, entry or result is reported from this lesson, because the recording does not state any in a form the captions preserve.
Watch the ICT Intraweek Reversal Lesson
ICT Mentorship Core Content – Month 07 – Intraweek Market Reversals & Overlapping Models
The Inner Circle Trader · published to YouTube on 30 September 2022 · listed as 1,713 seconds, about 28 minutes 33 seconds. The recording identifies itself as lesson seven of the short-term trading module. This video is the primary source for every timestamp link above.
The recording is not embedded here because the video owner has disabled playback on other websites. That was tested directly on 15 September 2026 from a BestProps page origin at both desktop and mobile widths: the embedded player loads and then reports “Playback on other websites has been disabled by the video owner”, with no playable stream in either case. The link above opens the recording on YouTube itself.
ICT Intraweek Reversal Resources
These are the sources checked for this article. The central-bank and regulator pages are general reference material; none of them assesses the speaker, verifies the PD array framework, the 200-point figure or the higher-timeframe rule above, or endorses anything said in the recording. Any ICT, smart-money or third-party indicator, script, note set, transcript pack, chart annotation or re-upload circulating outside the publishing channel’s own page is unofficial and untested here.
- [1] ICT Mentorship Core Content – Month 07 – Intraweek Market Reversals & Overlapping Models The Inner Circle Trader (primary source; watch page read 15 September 2026, listed at 1,713 seconds, page displayed