
Key takeaways
ICT lesson six from the February 2017 mentorship teaches swing-trade risk control by setting maximum risk before a trade exists, framing direction and objectives with monthly and weekly premium and discount PD arrays, then refining execution on the four-hour chart to reduce stop distance.
Read the full summary
ICT lesson six from the February 2017 mentorship teaches swing-trade risk control by setting maximum risk before a trade exists, framing direction and objectives with monthly and weekly premium and discount PD arrays, then refining execution on the four-hour chart to reduce stop distance. Premium arrays include bearish order blocks, liquidity voids, optimal trade entries, fair value gaps, old highs and rejection blocks, while discount arrays include mitigation blocks, bullish breakers, voids, old lows and rejection blocks. The minimum target is 3 to 1 reward to risk, though ICT says 5R and 10R are common and 12R to 15R can occur, with monthly and weekly ranges of 200 to 500 pips supporting larger multiples. He recommends removing excessive leverage, contrasting retail forex availability of 50 to 1 in the United States and 100 to 1 or more elsewhere with his preferred 3 to 1 setting. His illustration uses 1.5% equity risk, about a 50-pip stop, a 10R target and six selected swing trades per year, which he claims can more than double equity, while qualifying setups may appear only once or twice every four to six weeks. A 10,000 dollar account at 3 to 1 leverage is described as three mini lots, and traders with jobs are told they need only the four-hour chart because setups can often be planned near the daily close. The EUR/USD example is historical chart instruction with no documented fill, account size or realized result, the return calculations are illustrative rather than a verified track record, and the review relies on YouTube captions that garble some ICT terminology.
How we researched this article
BestProps used document-based research from primary firm sources, checked September 24, 2026. The complete source list, scope, limitations, and commercial-state record appear near the end of this article.
ICT Swing Lesson Scope and Limits
He introduces the recording as lesson six of the February 2017 mentorship content and states the month’s topic up front: swing trading, taught through reducing risk and maximising potential reward (0:13, 0:22). That framing matters for how the rest of it should be read. It is a discussion of how he says he frames swing trades and what he says he is willing to risk, delivered as commentary over charts, not a report of executed trades. The transcript used here is the automatic YouTube caption track for the recording, and no figure, price, fill, chart coordinate or account result has been added from anywhere else.
A second limit is worth stating early: the caption track recognises most of his vocabulary but mangles some of it. Technical terms arrive as “bear shorter blocks” for bearish order blocks, “cell slots” for sell shorts and “pdra Matrix” for the PD array matrix, the levels in the worked example lose a decimal point, and one discount-side term lands as “low shoulder blocks”, which was not resolvable from the caption text or the surrounding spoken context. Those cases are flagged where they occur rather than silently corrected, and nothing that could not be established from the words spoken was reconstructed from the charts.
Reducing Swing Risk Starts With a Maximum
The lesson begins with risk rather than with entries. In his words, reducing risk “begins with knowing your maximum risk” for the setup or trade, and he says a trader should not allow a high risk percentage per trade, which he equates to gambling (0:34, 0:45). The contrast he draws is with how he characterises professional behaviour: framing setups that offer low risk against high reward (0:49, 0:51, 0:53).
He returns to the same point once he has described how wide monthly and weekly ranges can be. His observation is that traders who try to capture those large moves often maximise both their leverage and their risk at the same time, and that there is no reason to do so (3:34, 3:45). From there he states three prohibitions in a row: do not put too much risk on the trade, do not try to get rich in a handful of trades because “it doesn’t work”, and do not try to double the account every month (3:47, 3:57).
The audience he addresses is specifically the one he says wants to manage other people’s money. For that reader he argues risk should be kept “really really small” because a low demonstrated risk is part of what sells the business model to prospective clients, and he suggests the pair of low risk and consistent returns is what draws capital in (3:59, 4:16). Later in the same recording he repeats the theme from the client’s side, saying large investors respond to a smaller, steadier return rather than to aggressive exposure (13:57, 14:16).
Frame Swing Setups on Monthly and Weekly Levels
With swing trades, he says he focuses only on framing monthly and weekly levels, ideally (0:58, 1:07). The levels themselves are described through his PD array vocabulary. For a premium on the monthly or weekly chart he lists the areas he sells from: bearish order blocks, bearish liquidity voids that price trades up into, optimal trade entries, bearish fair value gaps, old highs that offer a false break above, and rejection blocks (which he defines here as candles with long wicks, where he looks to sell above the bodies) (1:09, 1:41). He then says the same logic runs in reverse for the discount side, naming mitigation blocks, breakers, a term the caption track renders as “low shoulder blocks”, voids below price, old lows and old highs, and the same long-wick rejection blocks where he looks below the candle bodies before it (1:44, 2:02). The “low shoulder” phrase was not resolvable from the caption text or the surrounding spoken context, so it is repeated here as the track heard it rather than translated into a cleaner label.
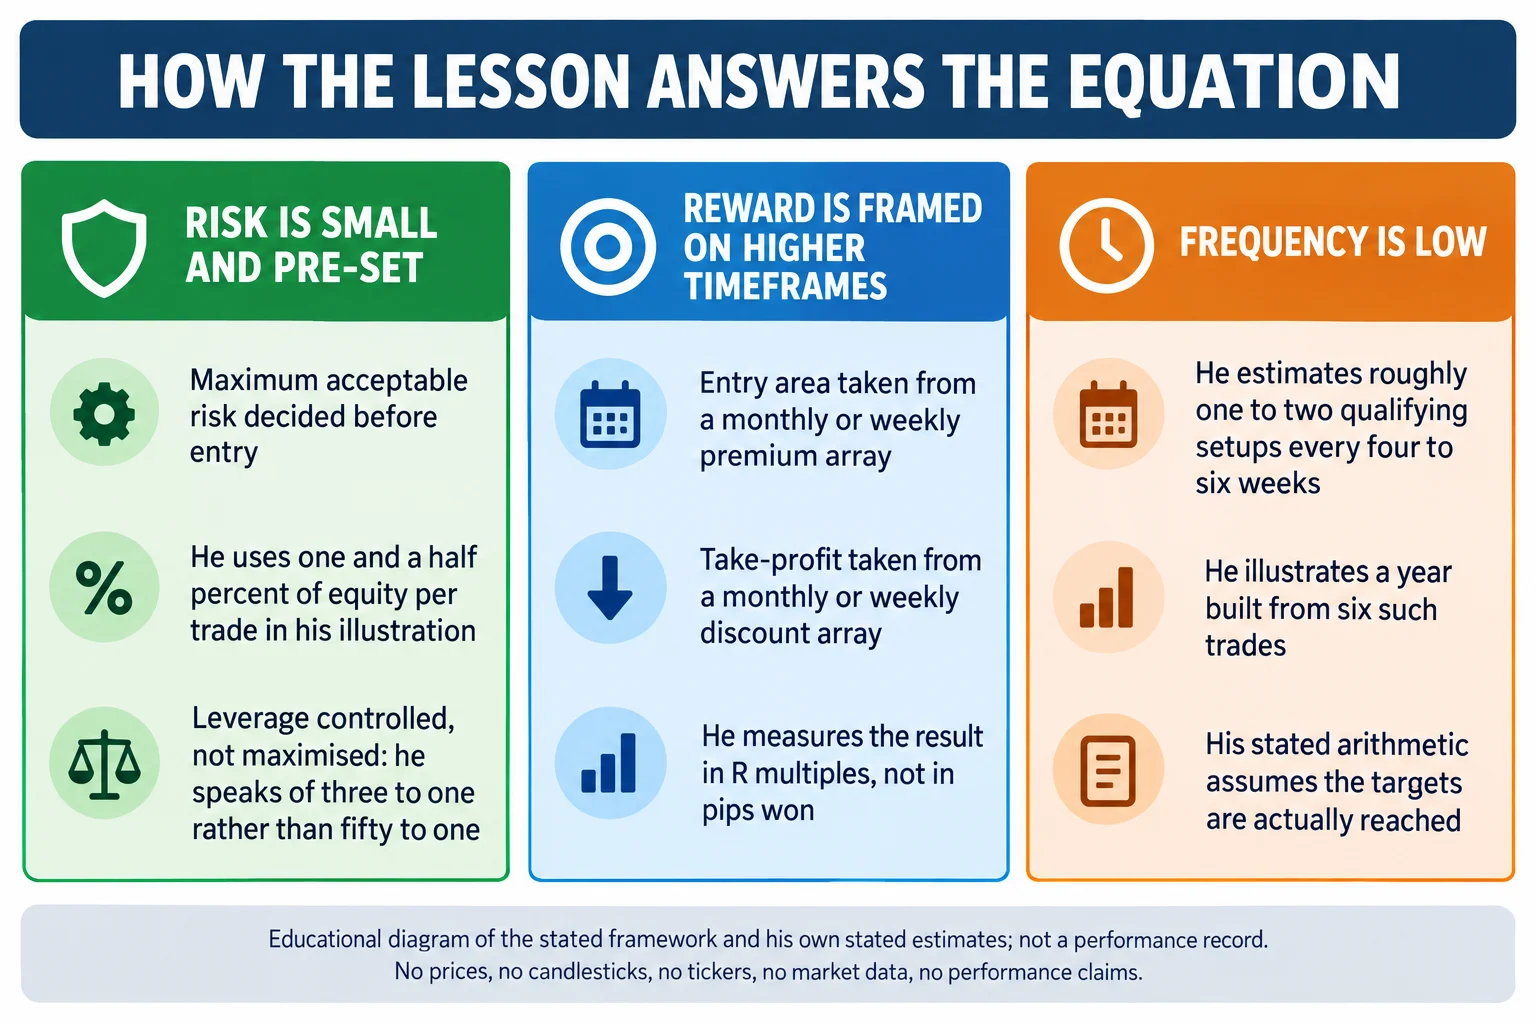
He is explicit that the list is not a checklist where every item must be present. He says he uses order blocks in his teachings for the sake of brevity, that there may be no liquidity void and no fair value gap in a given situation, and that the practical rule is the order of the list: for premium PD arrays he works from the bottom up, and for discount PD arrays from the top down, and that is the sequence in which he hunts the range he is trading (2:06, 2:42).
The purpose of working on those time frames is context. He says the monthly and weekly arrays tell him what the trade is being framed off, and he gives the bearish version concretely: if the monthly and weekly context is bearish he looks for a monthly discount array to reach into, taking the very first item in the discount list below price (whether that turns out to be a mitigation block, a bullish breaker or a liquidity void) as the monthly objective (2:46, 3:22). Because the entry area and the objective are both drawn from the monthly chart, he describes the result as “massive amounts of range” being framed (3:24, 3:31).
Refine Swing Setup Entries on the Four-Hour Chart
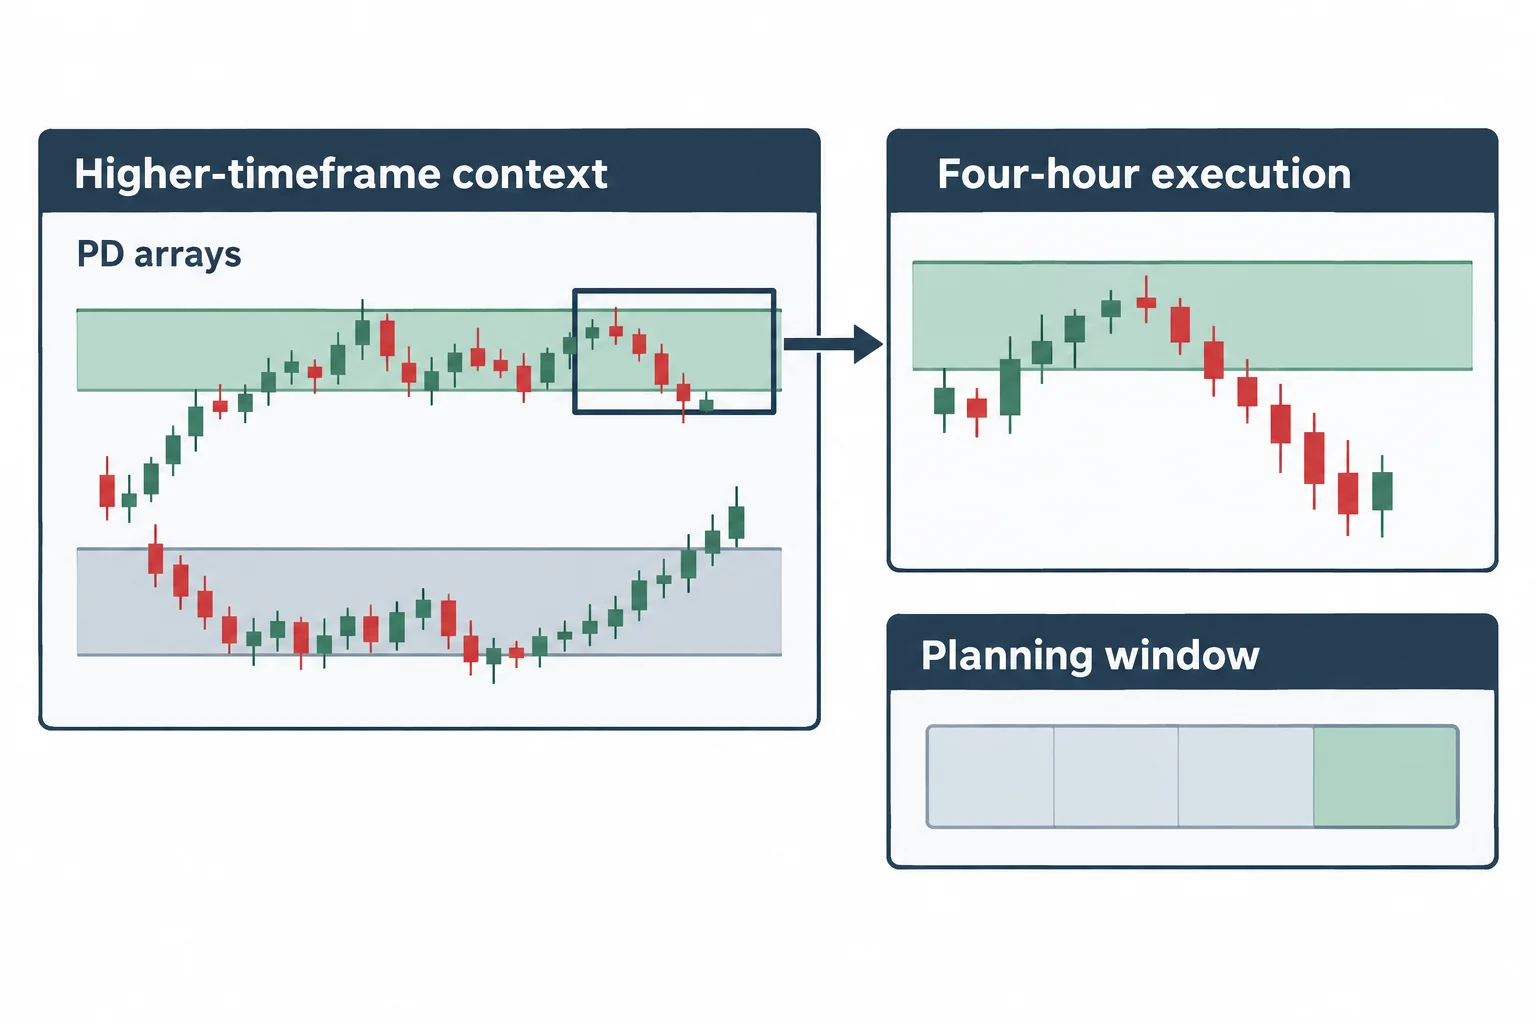
The mechanism that keeps the stop small is the split between context and execution. He says using higher-time-frame PD arrays for the entry permits tighter stops than framing the whole trade on a daily chart (4:27, 4:34), and he notes that later teachings in the mentorship reduce risk further still, so what he outlines here is a starting point rather than the limit (4:37, 4:43).
He frames the four-hour chart as the practical option for someone with a job or a business. In his words such a trader does not need anything lower than a four-hour chart, does not need to check a phone repeatedly, and only needs access to that timeframe (4:47, 5:06). He adds the observation that setups often appear around the close of the day, so trades can be framed the day or night before rather than watched minute by minute (5:08, 5:23).
On the entry technique itself he defers rather than restates. He says he will not rehash the entry techniques taught in the January position-trading material and refers the listener back to those lessons, describing them as limit orders, buying stops and selling stops, and telling the listener those same patterns apply to swing trading on a four-hour basis and are what help reduce the risk (5:53, 6:33). That is a real limitation of this recording as a standalone specification: the trigger definitions live in the earlier lessons, and this one gives the framing of the risk around them.
He also sizes the timeframes for the reader. Monthly ranges, he says, can be several hundred pips, weekly ranges a couple of hundred, and daily ranges on the order of 100 pips, and the four-hour chart reduces the range to a smaller, more conservative number to frame risk around (6:36, 6:59).
Set Minimum Swing Reward to Risk Ratios
The reward side of the equation starts with a floor. He says to use nothing less than three to one reward-to-risk ratios, and then says immediately that with this criteria a trader will have a difficult time finding trades at only three to one, because five to one and ten to one are common (7:03, 7:22). He promises a worked example in the teaching and homework to find more (7:22, 7:23, 7:25).
He then offers a probability illustration that is worth quoting precisely because of how it is usually repeated. He says that with a three-to-one reward-to-risk condition a trader only needs to be accurate 30% of the time to be profitable, and asks the listener to consider being wrong 70% of the time at three to one and still being net positive (7:28, 7:58). He extends it to five to one and ten to one, and asks how many times a trader could afford to be wrong under those conditions (7:58, 8:17).
Read as arithmetic rather than as a promise, that illustration is a statement about expectancy: a fixed 3:1 payoff does have a break-even hit rate of 25% before costs, so 30% is positive only if average wins and losses actually stay at the assumed sizes. The recording does not present a win-rate record, and no trade in it is shown being filled, so the number describes the payoff geometry he is aiming for, not a measured result.
His definition of the R multiple comes a little later, and it is the same idea expressed as a unit: an R multiple is the reward relative to the risk associated with the trade, so attempting 5R means trying to make five dollars for every dollar risked (11:17, 11:34). He repeats the floor and the typical range in that passage as well, saying a three-to-one trade is very hard to find on these setups and that five or higher is common, with ten, twelve and even fifteen to one appearing in some instances if the trader waits and looks hard enough (11:37, 11:56).
He connects R multiples to the size of the ranges the monthly and weekly levels offer, saying ranges of 200 to 500 pips can yield up to 10R wins, and illustrating it as one dollar risked returning ten (12:01, 12:25). From there he argues about how little trading a fund manager needs to do, referencing the industry-standard 20% to 30% annual return he attributes to the managed-fund world and contrasting it with the daily screen-watching of a retail day trader (12:27, 12:57).
Maximizing Swing Reward Without High Leverage
He calls controlled leverage the holy grail of swing trading, and the instruction is to control it rather than to maximise it just because a broker offers it (8:21, 8:30). He cites the leverage available to retail forex traders he says reaches 50 to 1 in the United States and 100 to 1 or more elsewhere, adds that he no longer follows which firm allows what, and says plainly that the trader does not need leverage on that scale (8:32, 8:49). He puts futures leverage in the region of ten to one and the United States forex benchmark at a maximum of 50 to 1, repeating that neither is required to build wealth, and adding a comparison with how long a retirement account would take (8:49, 9:16).
He then translates it into a position-size statement. Removing the high leverage, he says, means trading with what he calls just three to one leverage, and for a ten-thousand-dollar account that means trading three minis (15:17, 15:43). He anticipates the objection that this is not what the listener came to learn, and answers it by saying the point is to be profitable with risk managed, low risk and high reward (15:45, 15:54).
His reasoning about leverage is that it is what kills accounts as size grows. He describes the path as building positions up until a larger size is possible, and says that around the two-million-dollar mark a trader can and should consider prime brokerage, which he says will not let you leverage the deposit, meaning the maximum is what is on deposit, and in practice he says such accounts trade under-leveraged, with a million dollars on deposit traded more like half a million (15:57, 16:44). The conclusion he draws is that at that level very little return is needed to do well, and that the instinct to risk more should be replaced by keeping risk small while letting the reward run (16:47, 17:00).
ICT Swing Risk and Reward Math
The most specific numbers in the lesson come in one stretch where he builds an illustration out loud. He starts from a three-to-one leverage setting and setups that pay as high as 10R, says that combination can yield up to 15%, and then sets the pieces in place: risking 1.5% of equity per trade, getting a reward of ten for one dollar risked, producing upwards of 15% on that single transaction (17:03, 17:27). He asks how many such trades are needed per year, answers with an average of six choice swing trades, and pre-empts the listener who finds that too inactive (17:29, 17:52).
He then restates the same case for a fund manager: 1.5% risk, three to one leverage, an average of about a 50-pip stop, six swings per year, and a 10R payoff, and concludes that this more than doubles the equity (17:54, 18:27). He repeats it in a condensed form: six trades a year, 1.5% risked, three to one leverage and roughly a 50-pip stop, more than doubling equity every year (18:30, 19:06).
He is careful about what he is contrasting it with. The claim is not that money doubles every month, not that it returns 25% a week and not that day trades return 15%; the description he gives his own framework is very conservative, very low frequency, with a low opportunity for drawdown precisely because the frequency is low and the risk is predefined (19:08, 19:35). He then names the frequency and the level again: about one trade every four to six weeks, from ideal setups around a monthly or weekly level, hunting ten-to-one payoffs to double equity in the course of six trades a year (19:37, 20:02).
It is worth being precise about the status of those figures. They are his own arithmetic about a framework he says he uses: they assume every targeted multiple is actually reached, assume the stated stop distance holds, and carry no costs, no slippage and no losing sequence. No equity curve, statement or verified account accompanies them, and the 20% to 30% industry return he cites earlier is his description of the managed-fund world rather than a figure this recording establishes (12:31).
Why ICT Swing Setups Stay Low Frequency
The repeated claim about frequency is that there are typically one to two swing trades for every four to six weeks, which he glosses as about a month to a month and a half, with the second often setting up around that time (14:25, 14:42). He calls that a safe assumption (his wording, not a verified tendency) and says the daily chart will show it as roughly the average (14:44, 14:46, 14:48).
From there he argues that the waiting time is an advantage rather than a defect. He says it gives plenty of time to prepare, that the trader does not need to be over the charts every five minutes or present every single day, that missing a day for a business trip is fine, and that swing trading remains possible with a job or a business (14:50, 15:08). He closes that passage with the instruction he says is the key: you do not have to take every swing trade, and if a setup does not look right, wait (20:05, 20:12).
ICT Swing Setup Example Using EUR/USD
Roughly twenty-one minutes in he starts an example on the euro against the dollar, and this is where the transcript has to be handled with care. He refers to an old monthly high formed in April 2011 and describes price as deep in the premium relative to an older high from October 2009, from which he identifies a bearish order block (the last up candle of October) and its mean threshold, and says those levels were extended forward in time until price reached them in March and April 2011 (20:37, 21:26).
He then drops the same idea to a four-hour chart to make it executable, pointing at a down candle to the left of the intended entry and describing the whole setup as the range between that candle’s high and the mean threshold of the October 2009 order block (21:28, 22:31). The levels he speaks are rendered by the caption track as “.80” for the old monthly high and “14865” for the mean threshold; read in a EUR/USD context those are 1.4280 and 1.4865, and this article treats the missing decimal point as a caption artefact rather than as a price he stated.
The trade construction is the part of the example he spells out. He says the entry is on the four-hour chart at the mean threshold of the monthly candle (which he also identifies as the opening of the bullish candle that made the high) with the stop one pip above the highest high of that candle, giving a 70-pip stop, and the old monthly high at the level he named as the objective, giving a reward range of 585 pips (22:33, 24:33).
He calls the result an eight-to-one reward-to-risk setup and says the potential on that one trade framework is as high as a 12.5% return, describing the risk as minute compared with the reward and attributing the ratio to framing both the entry area and the take-profit on a monthly level (24:39, 25:27).
What that example is not: it is a historical chart walkthrough. He does not state that the trade was taken, and the transcript contains no entry fill, account size, position size, execution cost or realised outcome. The 12.5% figure follows from his own 1.5% risk assumption and the 8:1 ratio, which means it inherits every assumption in the arithmetic above. The chart itself was not available to this review, which read the spoken description and the transcript only, so the candle geometry and coordinates described here are his account of the chart rather than independently reconstructed data.
Practice Reducing Risk in Swing Setups
The example ends with an exercise. He marks a level he rounds to “141.55” (1.4155 on EUR/USD, again reading the caption track’s dropped decimal the same way) and asks the listener to take that level onto a four-hour euro-dollar chart, apply the January position-trading entry techniques, and decide where the take-profit would be (25:30, 26:26). The first objective he names is the mean threshold of the last down candle of the relevant 2010 candle (which he notes has already been traded to once) and the second is the low of the October down candle, which he points out has equal lows with the green candle to its right (26:29, 26:53).
He prices the objective loosely, saying the short entry would be at that level and probably not exactly, and that if the down