
Key takeaways
ICT presents the Million Dollar Swing Setup as an educational screening mindset, not an earnings claim, verified edge or trade record, using sequential pass-or-wait gates of seasonal tendency, major market analysis, intermarket analysis, top-down levels, setup and management.
Read the full summary
ICT presents the Million Dollar Swing Setup as an educational screening mindset, not an earnings claim, verified edge or trade record, using sequential pass-or-wait gates of seasonal tendency, major market analysis, intermarket analysis, top-down levels, setup and management. Swing conditions require seasonality plus a trending interest-rate or dollar-index market and a trending commodity or stock market, otherwise he shifts to short-term or intraday trading. Bullish currency and metal filters require commercial positioning rising within its own 12-month range, dollar weakness, commodities rallying or rejecting lows, and open interest falling at least 10 to 15 percent as presumed short covering, while bearish rules reverse those conditions and treat a 10 to 15 percent open-interest rise as short selling. Open-interest data comes from barchart.com. Top-down work reviews nine to 18 months, maps monthly, weekly, daily and four-hour PD arrays, and compares 20-day, 40-day and 60-day ranges for convergence. Bullish breakers, mitigation blocks, liquidity voids and fair value gaps use stop entries, while order blocks, rejection blocks and buys below old lows use limit entries, with mirrored sell rules. Management keeps the initial stop until one third of the intended move, removes 20 to 30 percent at one quarter of the objective, moves to break-even only after that profit, considers adding back at 50 percent after a short-term pullback, exits at the target or 75 to 80 percent of it, and trails below the latest four-hour low for longs or above the latest four-hour high for shorts. The gold walkthrough uses a December through mid-February or early-March seasonal rally, a 1,142 monthly order block, a 1,142 to 1,150 discount zone, equilibrium near 1,200 and a projected 1,255 to 1,260 objective, with supporting commercial buying, declining open interest, dollar divergence and strength across soybeans, copper, crude oil and live cattle.
How we researched this article
BestProps used document-based research from primary firm sources, checked September 24, 2026. The complete source list, scope, limitations, and commercial-state record appear near the end of this article.
What Million Dollar Means in the ICT Setup
He opens by defusing the title. The lesson is not stating that a trader makes a million dollars from it; the phrase is his label for the condition he says he has found most deserving of study and focus among his technical tools (0:30). That framing matters for how the rest should be read: what follows is one trader’s screening procedure, described as his own, not a tested edge and not a performance record.
The order he sets out at the start is the spine of the lesson: he looks for a seasonal tendency first, then does what he calls major market analysis, then intermarket analysis, then a top-down analysis that pulls out the levels that matter for a swing, and only then looks for the trade setup and moves into trade management (0:54). He describes the whole thing as a mindset teaching that gives the process he goes through rather than a signal (2:42).
Seasonal Tendencies for the ICT Swing Setup
The first question is whether there is a seasonal tendency to buy presently, or whether one is approaching (2:55). A yes moves him on to major market analysis (3:02); a no sends him to another asset or market that does have one (3:07), and if nothing in the marketplace is offering a seasonal tendency then he waits for a new one (3:18). He states the rule bluntly at 3:30: he does not take a swing trade without one, even though swings occur in every calendar month. He adds that a trader who wants to set this part aside and work the rest of the template without seasonality is free to do so, but for him it is what makes the setup what it is, because it rests on something that has repeated rather than happened once (3:44, 3:30).
Once a seasonal tendency is either forming or in effect, he moves to the major market stage (4:09).
Major Market Analysis for the ICT Swing Setup
Here he splits the market into what he calls the four major asset classes and asks two questions: whether interest-rate markets and/or the currency market, specifically the dollar index, are trending (4:21), and whether the commodity and/or stock markets are trending (5:12). The requirement is agreement – one market from each group (5:31). If the interest-rate or currency question comes back no, he says to consider short-term or day trades and wait for swing conditions (5:01), and he makes the same point for the commodity and stock side: a missing condition does not end trading, it drops the timeframe (5:12). The reasoning he gives is that he will not force a swing opinion without the framework behind it (5:31).
Intermarket Filters for the ICT Swing Setup
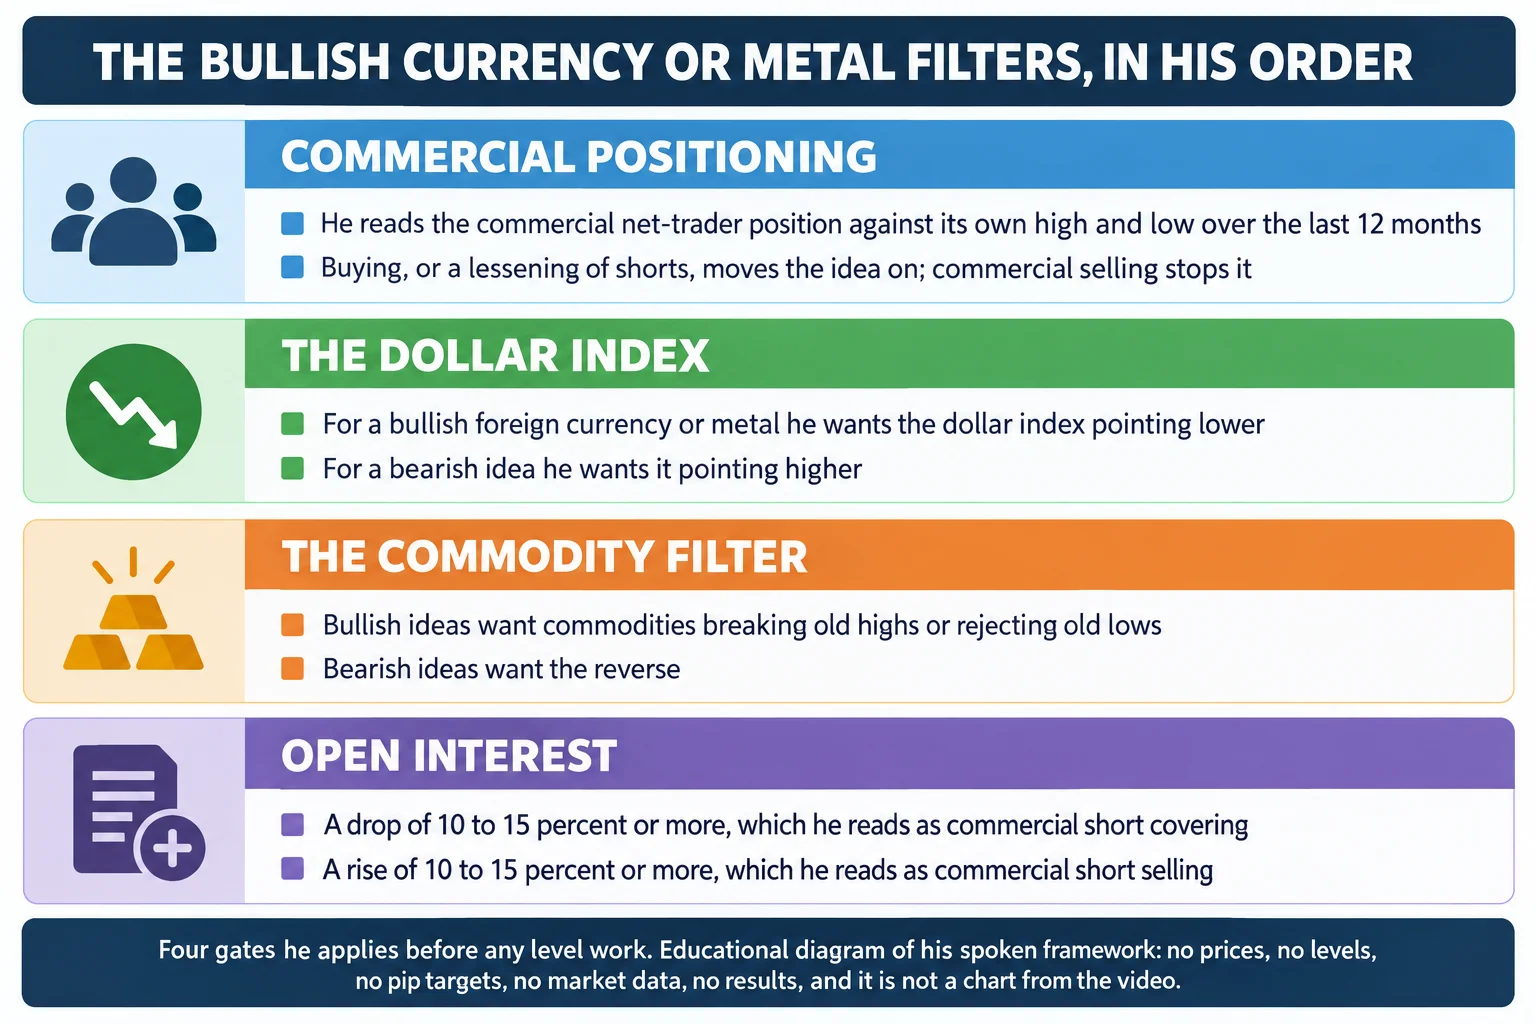
He labels this phase as applying to foreign-currency or metal swing setups specifically (5:58). The first input is the commercial side of the positioning data – the transcript’s captions render it as the “coot hedging program”, which context makes clear is the Commitment of Traders series – and the question is whether commercials are buying or selling now (6:06, 6:09). His method is not a raw net-long or net-short read. He takes the highest and lowest net-trader position over the last 12 months, divides that range, and asks where commercials sit inside it, so that even a net-short position can count as buying if they have moved up out of the bottom of their own range and lessened their shorts (6:48). If buying, or a lessening of shorts, is what the range shows, he proceeds to the correlation stage (6:27); if not, the instruction is again to consider short-term or day trades and wait (6:09).
The correlation stage is a dollar-index question, and its direction depends on the premise: for a bullish foreign currency or metal he wants the dollar index pointing lower, in what he describes as a divergence against the currency or metal (8:16). The commodity filter follows: are commodities rallying, breaking old highs or rejecting old lows (9:07)? He calls commodities rising while the dollar index falls a normal relationship (9:07). The last filter is open interest. A drop of 10 to 15 percent or more is what he reads as commercial short covering (9:49), and he names barchart.com as where he pulls open interest, adding that the site addresses are in the accompanying notes (9:55).
Bearish Conditions in the ICT Swing Setup
He then walks the same sequence in reverse for foreign-currency and metal bearish swing setups (10:24). The positioning question flips: he wants commercial selling or a net-short position, and commercial buying or net-long positioning stops the idea (10:24). The dollar-index question becomes whether it supports bullish dollar price action (10:24). The commodity filter becomes falling commodities that break old lows and reject old highs, and open interest rising 10 to 15 percent or more is read as commercial short selling (11:59). Each stage carries the same alternative: short-term or day trades for now, and wait for swing conditions.
Top-Down Levels for the ICT Swing Setup
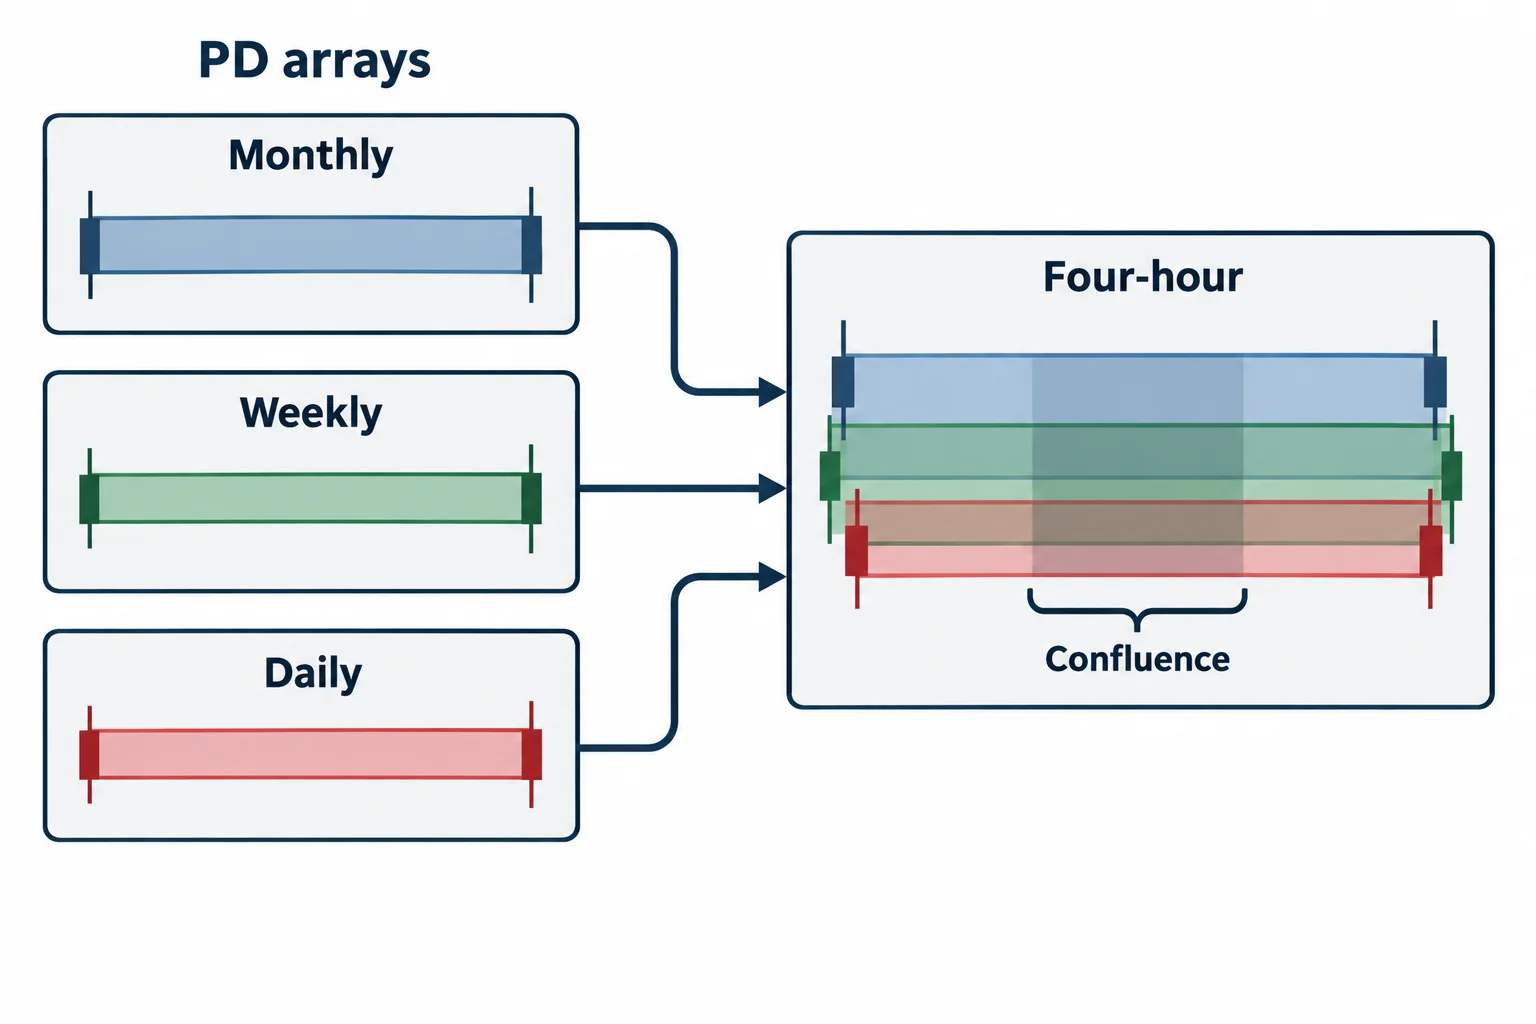
The chart stage starts with history: note nine to 18 months of price action (12:21), identify all PD arrays on the monthly, weekly, daily and four-hour time frames, and transpose them onto the four-hour chart (12:31). Then come two lookback constructs the captions render as “EPA data ranges” and “IED data ranges” at 20, 40 and 60 days back from today, with the instruction to work outward from the 20-day window to the 40-day and then the 60-day when the nearer window’s arrays are exhausted or have already been traded to (12:40), and to look for the second set of ranges and PD arrays to converge with one another to establish what he calls high-probability institutional levels (13:02). Those two caption forms are discussed in the caption note below; this article does not substitute a term of its own for them.
Which arrays get used depends on the premise: bullish work focuses on the monthly, weekly and daily discount arrays to frame a long entry, and bearish work on the premium arrays (13:21). He describes the best odds as coming when a monthly or weekly discount array is confirmed by a monthly, weekly and daily discount array entry, with the dollar index supporting dollar weakness for the divergence (13:43); the sell side is the same construction at premium arrays with dollar strength (15:03).
Entry Orders for the ICT Swing Setup
His entry choice is tied to the array rather than to preference (14:16). For a bullish trade, a breaker or mitigation block is entered on a stop, and so are a liquidity void and a fair value gap (14:16); an order block, a rejection block, or a buy below an old low is entered on a limit (14:36). He points to the January study notes, pages 128 and 129 and 141 and 142, for what he calls position-trading entry techniques with limit and stop orders (14:45). The bearish version mirrors it exactly, with selling on a stop for bearish breakers, mitigation blocks, liquidity voids and fair value gaps, and selling on a limit for bearish order blocks, rejection blocks or above an old high (15:03).
Managing the ICT Swing Setup
The buy-side management rules he dictates are specific, and they are stated as his own template rather than as universal risk parameters (16:17). The initial stop is left where it was placed until price has moved one third of the intended direction (16:32). Once the trade is a quarter of the way to the intended objective he takes something off – 20 to 30 percent is the scale he gives – and only after that first profit does the protective stop move to break-even, which he emphasises should never happen before (16:41). At 50 percent of the objective he looks for new buying to add back the quarter he took off after a short-term decline (17:00), takes the full position off at the intended premium array objective or at 75 to 80 percent of it, and trails the stop below the most recent four-hour short-term low (17:11). He warns that the market will likely make a run for sell stops at or just above 50 percent of the range, so the stop should not be rushed upward (17:23), and that a stopped-out trade should be reconsidered on its original reasons and re-entered at a new monthly, weekly or daily discount array if they still hold (17:39). The sell-side list is the mirror image: contrary discount arrays as targets, a short-side scale at 75 to 80 percent, a trail above the most recent four-hour short-term high, and a warning about a run for buy stops just below the midpoint (16:17).
ICT Swing Setup Walkthrough Using Gold
He applies the checklist to gold (19:18). The seasonal tendency he points at is the one he says the mentorship had recently used: gold rallying from December into January and continuing from January into February, so that the tendency he reads runs from December into mid-February or early March (20:06). He is careful about the calendar references on the chart, saying the bottom row of months is the one being used and that the yellow squares at the top are contract delivery months (20:06). On the major market question he reports the bond markets trending, the dollar index trending, the CRB index flat going into December and the stock market trending, which he reads as a favourable condition for swing trading (20:22).
The positioning read follows. He identifies the high of the commercials’ 12-month range in January 2016 and the low of it in July, and says that going into December 2016 the commercials had moved up inside the shaded 12-month range in what he calls a buying condition – hedged and bought aggressively while lessening shorts (20:55). Alongside that he reports Williams %R oversold, which he reads as extremely bearish sentiment (21:30), and he points to open interest declining on the chart (21:42), saying the commercial line rising while sentiment is oversold is the combination he wants (21:56).
For the dollar-index correlation he describes gold failing to make lower lows at a major support level through the midpoint of December going into January while the dollar index showed willingness to go higher, and calls that the divergence he is looking for (22:21). On the commodity filter he samples soybeans taking out short-term highs with lows rejected, copper holding up, crude oil making a higher low and taking out short-term highs, and live cattle failing to make lower lows – his summary being that commodities as a whole were bullish (22:52, 23:14, 23:27).
Then the levels. He calls the high noted on the monthly candle at the area he renders as 1,142 a bullish order block – the last down candle before the November 2015 up move – and describes price trading up to roughly 1,370 in 2016 (23:43). For the objective he points to the area around 1,250 taken off the weekly candle of 17 October 2016, and references an old low near the 1,200 area from the May 2016 candle (24:11). He measures the range from the monthly order block area up to the weekly level, which gives him a projection of roughly 1,255 to 1,260 with the halfway point near 1,200, and a discount zone in the 1,142 to 1,150 area (25:11). He notes from that chart that there was only one significant stop run, and that it came after the equilibrium price had been breached to the upside (26:02), which is why he says the stop should not be trailed up aggressively – the range he names as 1,255 to 1,260 has to be measured in advance (26:17, 26:24), and the anticipation of another stop run on the way through equilibrium is stated rather than observed (27:03).
He then maps each quadrant of the swing and halves the range again between the equilibrium area and the order-block area, saying that dividing it produces a new equilibrium price point and that the smaller swings appear inside the larger one because price is fractal (26:31, 26:48, 26:53). In the projection he notes that price retraced to an old sell-stop area he renders as 1,195 to 1,190 and then down into an order block around the area he renders as 1,175 to 1,180, which he reads as a daily PD array (27:32, 27:46, 27:54), and he measures that swing with Fibonacci extensions of 1.27 and 1.62 to arrive at 1,260 as a confluence of Fibonacci, weekly and monthly levels (28:08). He closes the example by saying the 1,220, 1,218, 1,217 area was called as a swing buy and that it moved from roughly 1,220 to 1,260, which he gives as $4,000 per contract (29:36).
Limits of the ICT Million Dollar Setup
Two things need separating here. First, the transcript is commentary over a chart that the reader cannot see. He says that area was called as a swing buy and describes the move it produced, but the recording carries no entry log, no fill, no position size, no transaction cost and no account result. The 1,220 to 1,260 move and the $4,000 per contract figure are his reported outcome for a past example, not something this article can verify, and no such trade should be read as a recommendation or as evidence of profitability. The arithmetic itself is internally consistent with the contract he was trading: a 40-point move on a 100-troy-ounce futures contract is $4,000 (29:56), and the caption word “silver” in that sentence is a mis-recognition rather than a change of market, which is covered in the caption note below.
Second, he describes the framework as a process rather than a technique, and his own remarks bound how much it can promise. He says the seasonality requirement reduces the number of setups so far that he calls over-trading impossible, and that swing trades only set up around four to six weeks apart while the majority of his own trades are short-term and day trades (33:30, 34:00). He also says plainly not to take his word for it and to run the framework back over roughly the last two years to see whether it lines up (35:47), and that none of it is difficult but it is a procedure that takes work and patience (35:36).
Caption Notes for the ICT Swing Setup
This article was written from the video’s own auto-generated caption track, which is the primary source for every timestamp link above, and the track mis-recognises several terms. Where context makes the intended word clear this article says so, and where it does not, the caption form is left as it is. The positioning series appears as the “coot hedging program” (6:06), which the surrounding instructions on commercial net-trader positions make clear is the Commitments of Traders data – but the two level-window constructs, rendered as “EPA data” (12:40) and “IED data” (13:02), are not resolvable from this recording alone, and no substitute term has been supplied. “Williams percent R” (21:30) is the caption’s rendering of the oscillator, and the level that the captions give as 142 and 11142 (23:43) is the same monthly order block the surrounding passage treats as the 1,142 area; readers should check both against the video and the accompanying notes. The sentence near the end of the walkthrough that reads “$4,000 per contract for silver” (29:56) sits inside a gold example, which makes that word unreliable; the figure and the market are both reported above as the captions give them, and this article does not assert either as verified.
Watch the ICT Million Dollar Setup Lesson
ICT Mentorship Core Content – Month 06 – The Million Dollar Swing Setup
The Inner Circle Trader · published to YouTube on 25 September 2022 · listed as 2,308 seconds, about 38 minutes 28 seconds. The recording identifies itself as lesson eight of the swing trading module. This video is the primary source for every timestamp link above.
The recording is not embedded here because the video owner has disabled playback on other websites. That was tested directly on 15 September 2026 from a BestProps page origin at both desktop and mobile widths: the embedded player loads and then reports “Playback on other websites has been disabled by the video owner”, with no playable stream in either case. The link above opens the recording on YouTube itself.
ICT Swing Setup Resources
These are the sources checked for this article. The regulator and exchange pages are general reference material: the CFTC page documents the positioning series he builds the intermarket filters on, and the contract specification is background for the per-contract arithmetic quoted above. None of them assesses the speaker, tests the framework, or endorses anything said in the recording. Any ICT, smart-money or third-party indicator, script, note set, transcript pack