
Key takeaways
This is lesson seven of the swing-trading model, and it is a market-selection lesson rather than a setup lesson: the eight things he says he looks for when hunting explosive, one-sided swing moves (0:15, 0:17, 0:28, 0:34).
Read the full summary
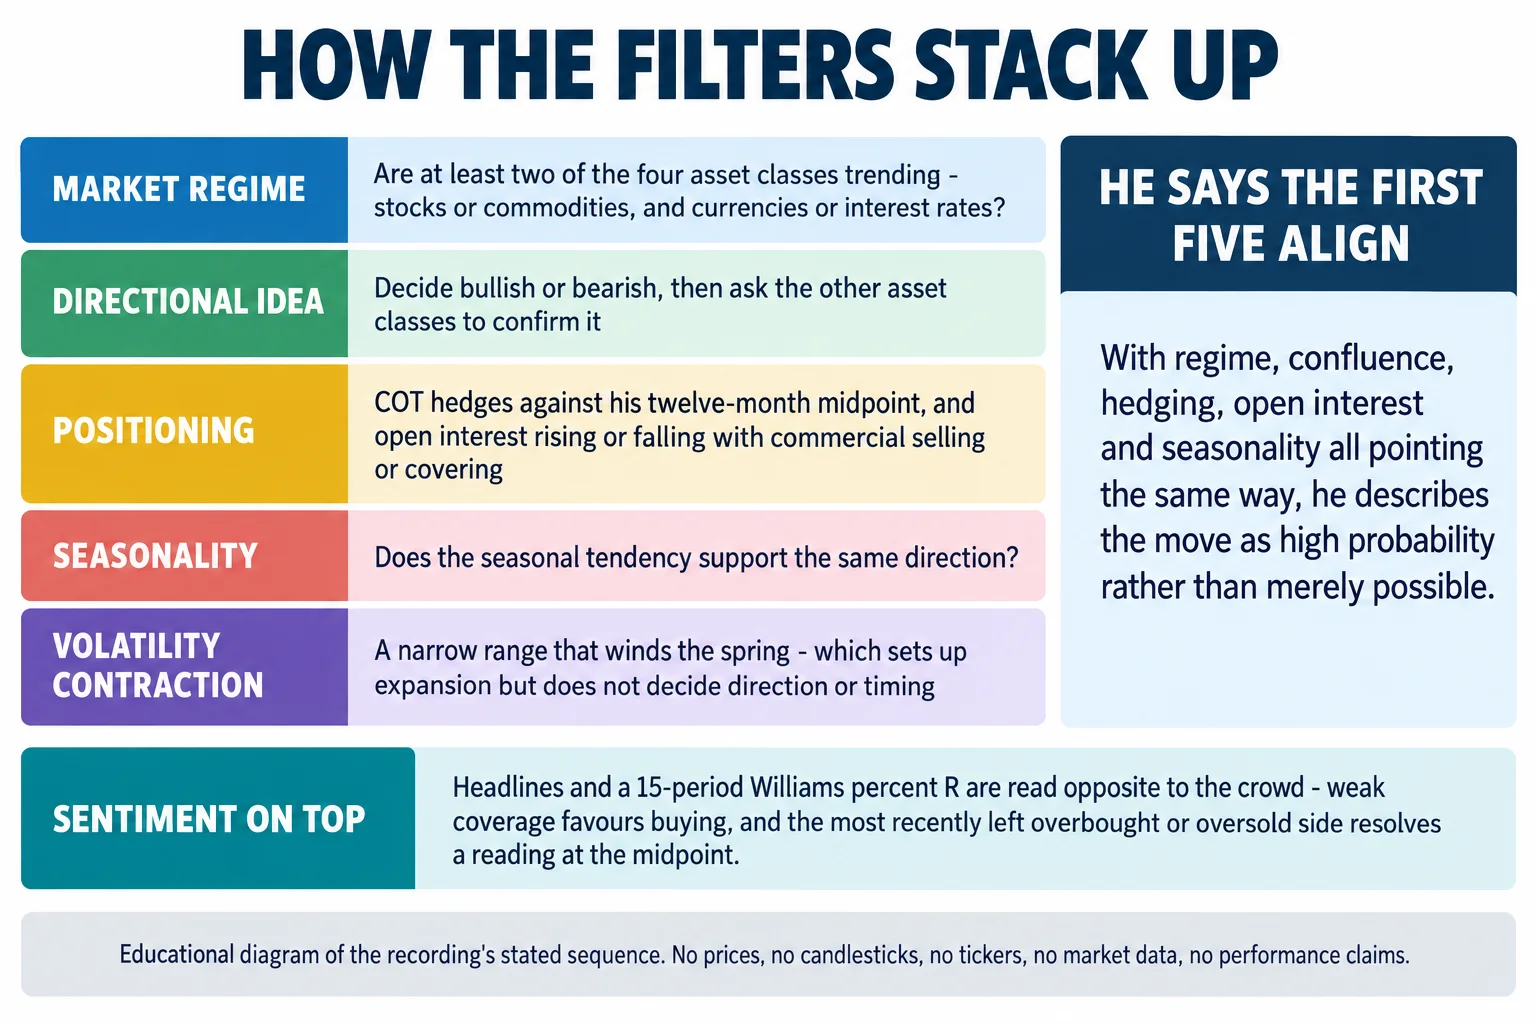
This is lesson seven of the swing-trading model, and it is a market-selection lesson rather than a setup lesson: the eight things he says he looks for when hunting explosive, one-sided swing moves (0:15, 0:17, 0:28, 0:34). The first is a regime check — at least two of the four asset classes (interest rates, stocks, commodities, currencies) trending rather than sitting in consolidation (0:54, 1:22) — and he later narrows it further: one of stocks or commodities, and one of currencies or interest rates, must be trending (9:16, 9:22). Then intermarket confluence confirming the idea (1:32), commercial hedging in the COT report measured against his own twelve-month midpoint rather than the chart’s zero line (3:33, 15:31), open interest read together with commercial buying or selling (4:41, 18:25), seasonal tendency (5:04), a volatility contraction filter (5:24, 21:27), contrarian news headlines (6:28, 23:28) and market sentiment read from a 15-period Williams %R on the daily (7:32, 25:35). He says that when five of these line up he expects an explosive move rather than a lethargic one (20:57, 21:13). What the recording does not contain is a mechanical trigger, a position size, a stop, an exit rule or any result data.
How we researched this article
BestProps used document-based research from primary firm sources, checked September 24, 2026. The complete source list, scope, limitations, and commercial-state record appear near the end of this article.
What counts as an explosive market
He frames the lesson around price that moves “dynamically one-sided” rather than drifting, and says a swing trader should be focused on the markets that offer that (0:37, 0:40, 0:46). The first item on the list is the condition that has to be in place before any of the rest is worth checking: the market profiles have to show the four asset classes wanting to trend, not held in consolidation and not at odds with one another (0:54, 1:03, 1:05).
He is deliberately loose about the requirement. Two of the four trending is enough for a favourable swing environment, and it does not matter whether all four are (1:21, 1:22, 1:35). Later in the lesson he converts that into a specific pairing: group commodities and stocks together and require one of those to be trending, then group currencies and interest rates and require one of those to be trending (9:02, 9:06, 9:16, 9:22, 9:27). When stocks are consolidating, commodities should be trending, and the reverse (8:52, 8:57). His stated reason is that these two groups frame the models the algorithms use to move price, with the exception he makes for commodities, which he says are driven by real supply and demand factors (9:27, 9:31, 9:45).
Two practical caveats belong here. First, the transcript never defines trending or consolidating in measurable terms, so the screen is as discretionary as the words imply. Second, he also says the two lagging asset classes will “eventually” trend, which is a directional expectation rather than an observed condition (8:11, 8:16).
Intermarket confluence
The second hallmark is using the other asset classes to confirm or reject a thesis already formed (1:32, 1:35, 1:39). His worked example is the dollar. If he expects a bullish dollar, the supporting picture he wants is commodities held at resistance across the major sectors, commodities failing to make higher highs or making false breakouts, and commodities breaking their lows or failing to rally (1:48, 1:57, 2:01, 2:05). He also wants the dollar pairs at resistance, breaking lows, and struggling to make higher highs — euro-dollar, Aussie-dollar, pound-dollar and New Zealand dollar (2:46, 2:48, 2:52).
The bearish dollar case reverses every one of those: commodities finding little resistance on the way up and strong support on dips, highs broken and lows held (2:16, 2:26, 2:31), with the dollar pairs at support, unwilling to make lower lows, and their highs trading through easily (2:52, 2:58, 3:07). He adds a detail for the weak-dollar case: when a commodity takes out an old low in that environment, he says you can often expect a false-break or turtle-soup scenario and higher prices after it (11:08, 11:21, 11:24, 11:26).
He also broadens the check beyond an index: it is not enough for a composite commodity index to behave, the grain markets should show the same behaviour — soybeans, wheat and corn failing to make higher highs or rejecting them quickly under a bullish dollar, and the reverse under a weak dollar (11:35, 11:41, 11:45, 11:51). These are his proposed relationships between markets, offered as confirmation logic; the recording supplies no measurement of how reliably they hold.
The COT hedging alignment, and why he redraws the zero line
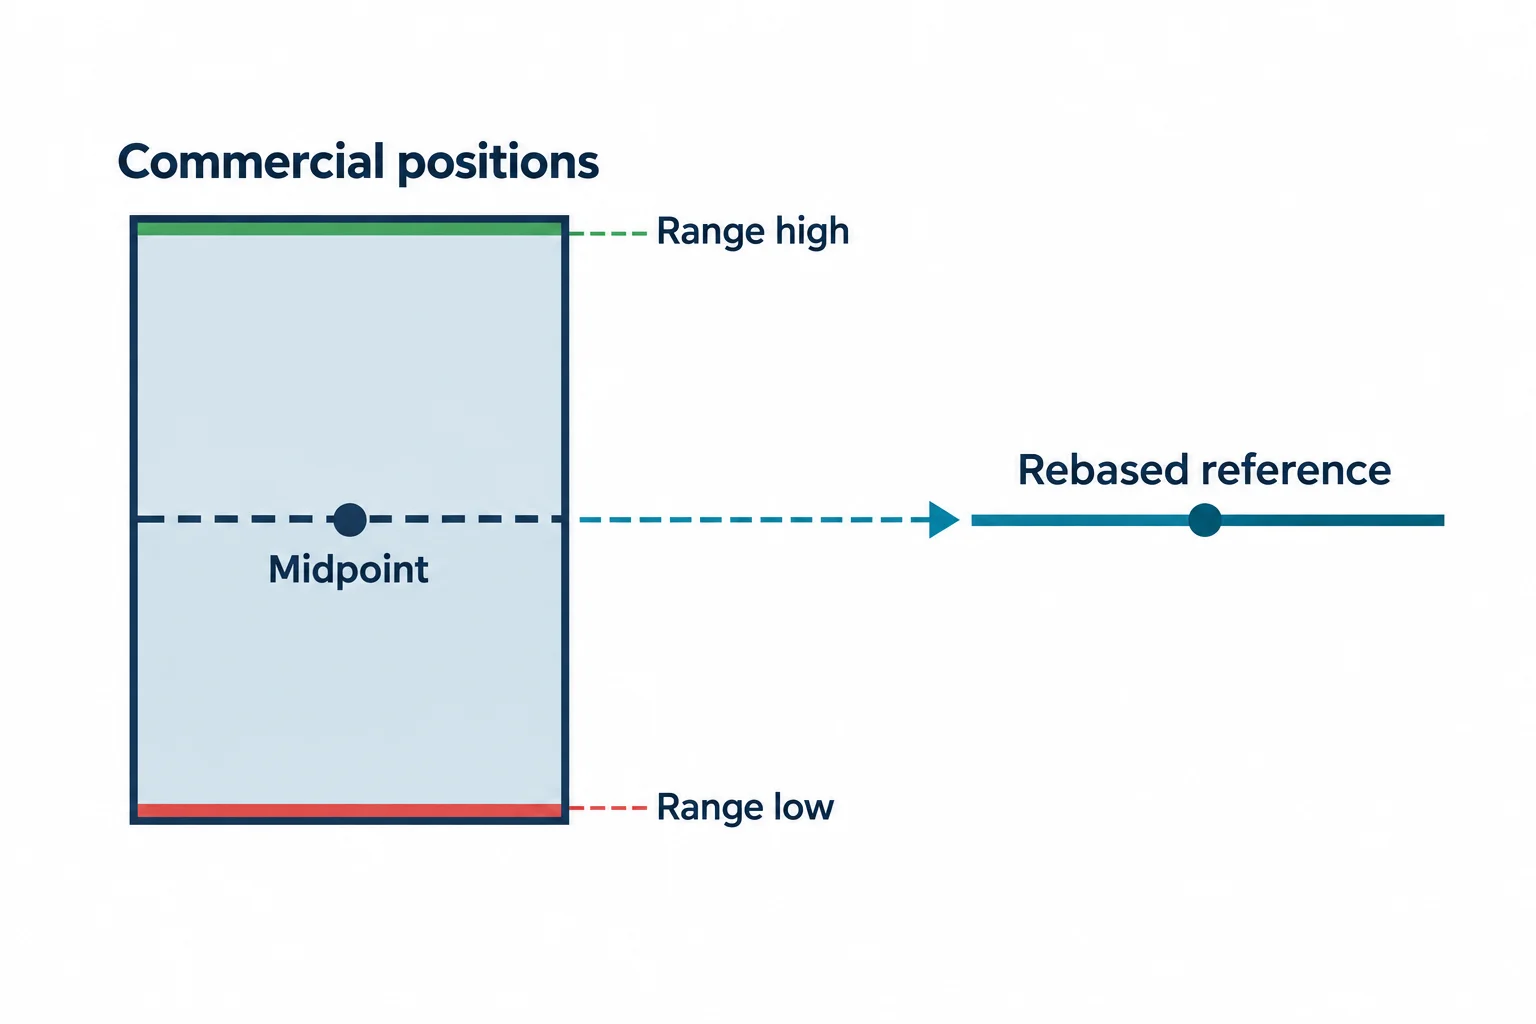
The third hallmark is the one he spends longest on, and the part that is most clearly his own construction. He looks at the commercial traders’ net positions in the Commitments of Traders report over the last twelve months and takes the highest and lowest reading of that window (3:33, 3:35, 3:41). He divides that range in half and treats the midpoint as a new zero line, which he then uses to call commercial activity bullish or bearish (3:53, 4:08).
He gives his reasoning for the twelve-month window: commercials hedge against a plan, and the last twelve months of prices are what they use to decide what is normal or reasonable for the next twelve months (13:13, 13:19, 13:24, 13:31). He also describes the commercials’ role in concrete terms — the largest producers or providers of a commodity, whether they grow or manufacture it or, in currencies, act as the bank that makes it available (13:15, 13:22, 13:26, 13:31).
He is explicit that this departs from the standard reading. He says that by the conventional definition — and he attributes the early work on making COT reports public to Larry Williams — a commercial net position below the chart’s zero line would be deemed bearish, and that this was a frustration for him (15:00, 15:02, 15:08). His fix is to ignore the zero line on the standard net-trader-position chart, which he notes is available on barchart.com, and to substitute his midpoint (15:31, 15:39).
His worked example is a market where the commercial red line sat below the conventional zero line from January 2016 through to the time of recording, which he says would conventionally read as bearish (14:53, 15:00, 15:14). Under his method the same data tells a different story: the highest point of their holdings was January 2016, just under the conventional zero line, the low came in July 2016, and the midpoint between those two becomes his makeshift zero. In December 2016 the line crossed above his midpoint, which he reads as commercials buying aggressively again, and he says they were still buying at the time of the recording (16:25, 16:39, 16:46, 16:53, 16:55).
He also states the failure condition: if the market is bearish, the line is above his zero and trending down, that is not supportive of a strong sell and would be at odds with the idea, so he would wait for the line to go back below his midpoint (17:29, 17:36, 17:38). The transformation is his own; nothing in the recording shows it being tested.
Open interest as a cross-check
Open interest is on the list because he trades the majors and their commodity-linked pairs, so futures positioning gives him information the spot market cannot (4:41, 4:43, 4:48, 4:52). He describes each change as having a reading when paired with the commercial line.
- Falling open interest of 10, 15 or more, with the commercial line moving up toward his midpoint — he reads that as commercial short covering, a willingness to stop offering liquidity because they expect higher prices, and confirmation of the bullish scenario (18:25, 18:28, 18:30, 18:37, 18:45).
- Rising open interest of 10 to 15 or more while commercial net selling increases — he calls that bearish (19:07, 19:08, 19:12, 19:15).
His example is a reduction in open interest from November into December of more than 500,000 contracts down to about 400,000, a little over 100,000 contracts taken off, which he reads as shorts being closed at the same time the commercial line moved higher (19:11, 19:15, 19:22, 19:26). Note that these are chart readings from a diagram in the lesson and there are no labels in the caption track that would let an outside reader verify the instrument or the exact values.
Seasonality, and what five in a row gives him
Seasonality is treated as another alignment layer: if the market analysis shows trending profiles in two of the major categories, open interest has declined, the hedging program shows commercials buying and the intermarket picture supports higher prices, then a seasonal tendency to rally adds to it (5:04, 20:15, 20:19, 20:25, 20:30). His example is a December-into-January tendency rolling into the next year and continuing into February (20:36, 20:39, 20:43).
This is where he counts his own stack: with regime, intermarket confluence, hedging, open interest and seasonality all in agreement he says there are five things in his favour, and the probability of an explosive move is strong (20:57, 21:01, 21:09). The description he attaches to that outcome is instructive about what he is claiming and what he is not: prices should move higher not in small ranges but explosively, and it should not be a lethargic move (21:06, 21:13, 21:16, 21:18). The recording gives no sample, no hit rate and no cost-adjusted outcome for that claim.
The volatility filter
He defines the volatility filter as range contraction: price moving from a large range into a small one (5:24, 5:27, 21:27). He says it applies on any time frame — monthly, weekly, daily (21:35). The pattern he draws out is an inside candle or inside bar: the following candle makes a lower high and a higher low, and he specifies that he is looking at the candle body and not the wicks, so an up close or a down close does not matter (21:38, 21:46, 21:48).
He calls the contraction a high-probability precursor of a large-range candle in the next one or the one after, and compares it to the wind-up of a spring (21:51, 21:54, 22:00, 23:21). He also gives the two simple alternatives he uses for the same idea: the smallest range of the last three days and the smallest range of the last seven days (22:57, 23:03, 23:05, 23:10).
What he is careful to state, and what the article should not drop, is the limit of the filter. The contraction tells him an expansion is likely, not which way it goes, and not when: it gives the stage rather than the timing (22:00, 22:06, 22:10, 22:25, 22:29). Direction is supposed to come from the earlier layers, and he frames the filter as something added once the trade idea is already in place (22:30, 22:35).
News headlines, used against the crowd
He describes the news filter as contrarian by design. If he is looking to buy, he wants to see headlines describing weakness or justifying why price fell, because that builds a bearish sentiment in retail-minded traders who then do not want to buy (23:28, 23:34, 23:45, 23:49, 23:58). His reason for discounting the commentary is direct: he argues that the people on the anchor desk are not trading live before the fact, which is where he says a trader would be (24:03, 24:05, 24:10, 24:12, 24:16).
The mirror is a market he wants to short: he looks for headlines about how well it has been moving, highs being made, or something that reads as underlying bullish, and he treats that as the catalyst setting up the swing (24:22, 24:29, 24:30, 24:36, 24:52). He names the places he scans: Futures magazine, which he says he subscribes to and which profiles a market or two each month, plus high-traffic outlets such as MarketWatch and CNBC (24:41, 24:43, 24:58, 25:01, 25:03). He summarises his preference as wanting to trade when sentiment is at its weakest (25:18, 25:20, 25:28).
Market sentiment with a 15-period Williams %R
The eighth hallmark is the only explicitly indicator-based one, and he acknowledges the irony of using an indicator after criticising them: he says he uses a 15-period Williams %R plotted on a daily basis, and calls it the most accurate he has found for overall overbought and oversold (7:32, 25:35, 25:40, 25:45, 25:47).
His scale is simple. He divides the indicator at the 50 level: at or below 50 is oversold and a buying area, above 50 is overbought and a selling area (25:50, 25:56, 26:02, 26:03). For a reading sitting right at the level he uses the most recent extreme as the tiebreak — if the indicator recently left an oversold condition he still factors a potential buy, and if it recently left an overbought condition and is hovering at 50 he favours that side (26:09, 26:12, 26:14, 26:17, 26:21, 26:23). In his words, at a point of equilibrium he goes with the side it most recently left (26:26, 26:29, 26:32).
One presentation point matters for anyone trying to reproduce this. He describes the threshold as “50” and the caption track also renders “overbought” as “over ball” (25:53). Williams %R is normally plotted on a negative scale from about −100 to 0, so the level he calls 50 is not the same number a standard plot shows at its midpoint; the recording does not resolve the notation, and the article does not try to. Match his setting to the scale actually drawn in the video rather than assuming a sign.
How the hallmarks fit together
Read end to end, the lesson is a stacking argument rather than a signal. The bias comes first, from the higher time frame and the regime check; then intermarket confluence asks whether the other asset classes agree; then the COT and open interest layers ask what the commercial side is doing; then seasonality; then the volatility filter sets the stage; and headlines and the sentiment indicator sit on top as the crowd-psychology layer (20:15, 20:25, 23:28, 25:35). His own summary is that this is what he looks for and that the list will come up again later in the mentorship when he discusses mega trades (26:38, 26:39, 26:42).
He closes by saying lesson eight will turn these hallmarks into the actual swing-trading model, step one through execution and trade management (26:48, 26:51, 26:54, 26:56, 26:58). That is a fair statement of the scope here: this recording names the selection criteria and the reasoning behind them, and does not contain entries, stops, targets, sizing or outcomes. Anyone testing the framework would have to supply objective definitions of trending, of the COT midpoint reading, and of the contraction condition themselves.
A note on the captions
This article was written from the automatic YouTube caption track, which is machine-generated and mishears several terms in this recording. The COT acronym appears once as “CRT” before being corrected by context in the same passage (4:06). “Market sentiment” is rendered once as “Marcus sentiment”, and “overbought” as “over ball” (25:35, 25:53). “Asset class” appears as “NASA class” in one line (10:24), and “trending environment” is repeatedly rendered as “training environment” (8:16, 9:28). The transcript also does not contain the word “expansion”; where the article describes the large-range candle that follows a contraction, that is a plain-language description of what he describes, not a term he uses here. No price, chart value, order, position size or result has been invented anywhere above.
Watch the original recording
ICT Mentorship Core Content – Month 06 – Keys To Selecting Markets That Will Move Explosively
The Inner Circle Trader · published 24 September 2022 · about 27 minutes 5 seconds. This recording is the primary source for every timestamp link above.
The recording is not embedded here because the video owner has disabled playback on other websites. That was tested directly on 15 September 2026 from a BestProps page origin at both desktop and mobile widths: the embedded player loads, then reports “Playback on other websites has been disabled by the video owner” with no duration and no playback progress, while the video itself plays normally on YouTube. No empty or half-working player is left on this page.
The watch page was read on 15 September 2026 and is publicly listed as ICT Mentorship Core Content – Month 06 – Keys To Selecting Markets That Will Move Explosively by The Inner Circle Trader: upload date 24 September 2022, not private and not unlisted, with the player reporting a duration of 1,625 seconds — about 27 minutes 5 seconds. The caption track used for this article runs to 1,626.7 seconds, so the transcript and the listed duration agree.
Resources
These are the sources checked for this article. The regulator and investor-education pages are general material about short-term and leveraged trading and about how trading systems and advisory services sold to the public should be assessed; neither one evaluates this speaker, verifies any regime reading, COT transformation, open-interest reading, seasonal pattern, contraction condition, headline reading or sentiment level described above, nor endorses anything said in the recording. Any ICT, smart-money or third-party indicator, script, note set, chart annotation, transcript pack or re-upload circulating outside the publishing channel’s own page is unofficial and has not been tested here.
- [1] ICT Mentorship Core Content – Month 06 – Keys To Selecting Markets That Will Move Explosively — The Inner Circle Trader (primary source; watch page read 15 September 2026, listed duration 1,625 seconds, about 129,000 views at the time of reading).
- [2] The Inner Circle Trader — official YouTube channel (read 15 September 2026) — the publishing channel for the 2017 mentorship series used here.
- [3] CFTC — Fraud Advisory: Commodity Trading Systems Sold on the Internet (read 15 September 2026) — the