
Key takeaways
ICT defines swing trading as positions held for two weeks or longer, targeting directional moves of roughly 200 to 500 pips, and teaches market selection rather than entries in this first February 2017 mentorship lesson.
Read the full summary
ICT defines swing trading as positions held for two weeks or longer, targeting directional moves of roughly 200 to 500 pips, and teaches market selection rather than entries in this first February 2017 mentorship lesson. Scan monthly and weekly charts for trending expansion and retracement, avoid consolidation, reversal profiles and markets with little movement for roughly three months, then identify setups on monthly, weekly and daily charts and execute on the four-hour chart. Follow the higher-time-frame direction instead of picking tops or bottoms, while treating two consecutive failed daily or four-hour signals as possible evidence that the prevailing trend is weakening or shifting. EUR/USD is rejected because its monthly and weekly charts remain range bound, NZD/USD is favored for successive higher highs and higher lows including movement toward the captioned 7,490 level, and USD/JPY illustrates a bullish swing candidate after abruptly leaving consolidation and advancing several hundred pips. The kiwi weekly-chart exercise divides time into monthly segments and observes retracements and potential buying opportunities roughly every three to four months, with homework to inspect daily retracement lows for discount, dealing-range context, sell stops and relevant arrays. ICT attributes higher-time-frame trends to institutional flows, but the lesson provides no flow data, entry model, trade sample, accuracy rate or equity curve, so the claimed edge is not demonstrated.
How we researched this article
BestProps used document-based research from primary firm sources, checked September 24, 2026. The complete source list, scope, limitations, and commercial-state record appear near the end of this article.
How ICT Defines Swing Trading
He opens by describing swing trading as the discipline of trading predictable price movements with a high degree of consistency, buying in bullish conditions and selling short in bearish ones (0:31). The definition that matters for the rest of the lesson is duration: he calls it a form of intermediate-term trading with trade durations of two weeks or longer (0:51). The stated goal is to capitalise on larger entities moving into a market and causing significant displacement in price (1:04), and he puts the potential reward for setups like these at objectives of 200 to 500 pips (1:21). Two things should be kept apart there. The displacement explanation is his interpretation of why markets move; the 200-to-500-pip figure is his illustration of the kind of reward such durations make possible, not a result he documents in this lesson.
Why Any Market Is Not Ideal for Swing Trades
The selection rule he gives first is negative: not every market is ideal for swing setups (1:36), and specifically he says to avoid favourite markets – there is no standard swing-trading market or pair (1:40, 1:44). His reason is rotation: larger moves come in and out of different marketplaces each year, and roughly every three months a new opportunity forms somewhere (1:50, 2:00). What was once the big mover may not be the next one, so he tells students to investigate and look deeper than the most recent behaviour rather than reusing last quarter’s market (2:09).
In practical terms this separates two decisions that are easy to blend: choosing the market, and choosing the setup within it. The lesson is entirely about the first, and he points out later that a valid higher-time-frame bias does not by itself mean a setup exists (10:29).
ICT Swing Market Profiles and Ideal Selection
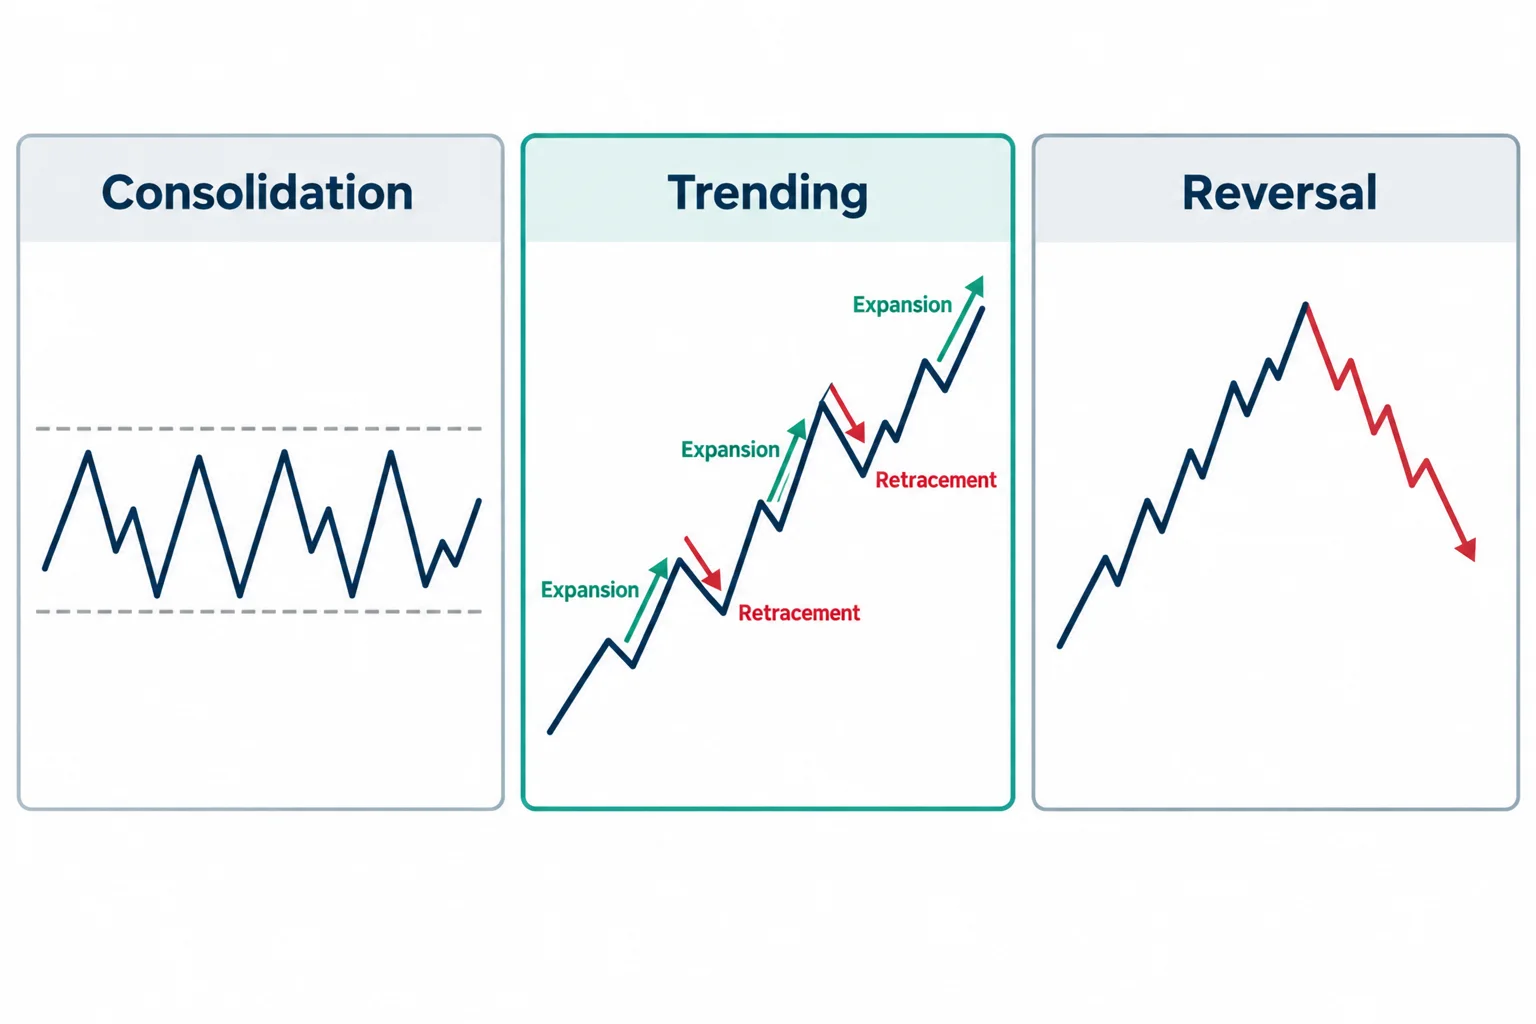
He introduces market profiles as something that matter, noting that markets move from one profile to the next across all time frames, and asks students to identify the current profile on monthly and weekly charts while avoiding markets that have been lacklustre or lethargic over roughly the previous three months (2:21, 2:37). The three he names are consolidation, where price is range bound; trending; and reversal (2:44). Trending he describes as expansion and retracement (3:10), and he states the preference plainly: because swing trading aims to position for moves that travel a large distance, the market to look for is one that is trending (3:10, 3:18). His reasoning about why is where the interpretation sits – he says trending markets equal large flows (3:10), that trend on a higher-time-frame chart is the telltale sign of participants acting on an institutional basis (4:11), and that building a watch list of markets trending on the monthly or weekly puts higher probability behind setups (3:32).
The observable half of that argument is simpler than the causal half, and he actually gives the visual test himself: on monthly and weekly charts he is looking for price action that is not confined to a small range, meaning it has already moved away from a consolidation area (3:49). Once it has left, his expectation is that it will most likely move to a larger level or array on the higher time frame (3:49). The claim that the move is driven by identifiable large participants is his reading of the chart, not something the transcript measures or verifies, and the lesson offers no participation data behind it.
Why ICT Avoids Range-Bound Swing Markets
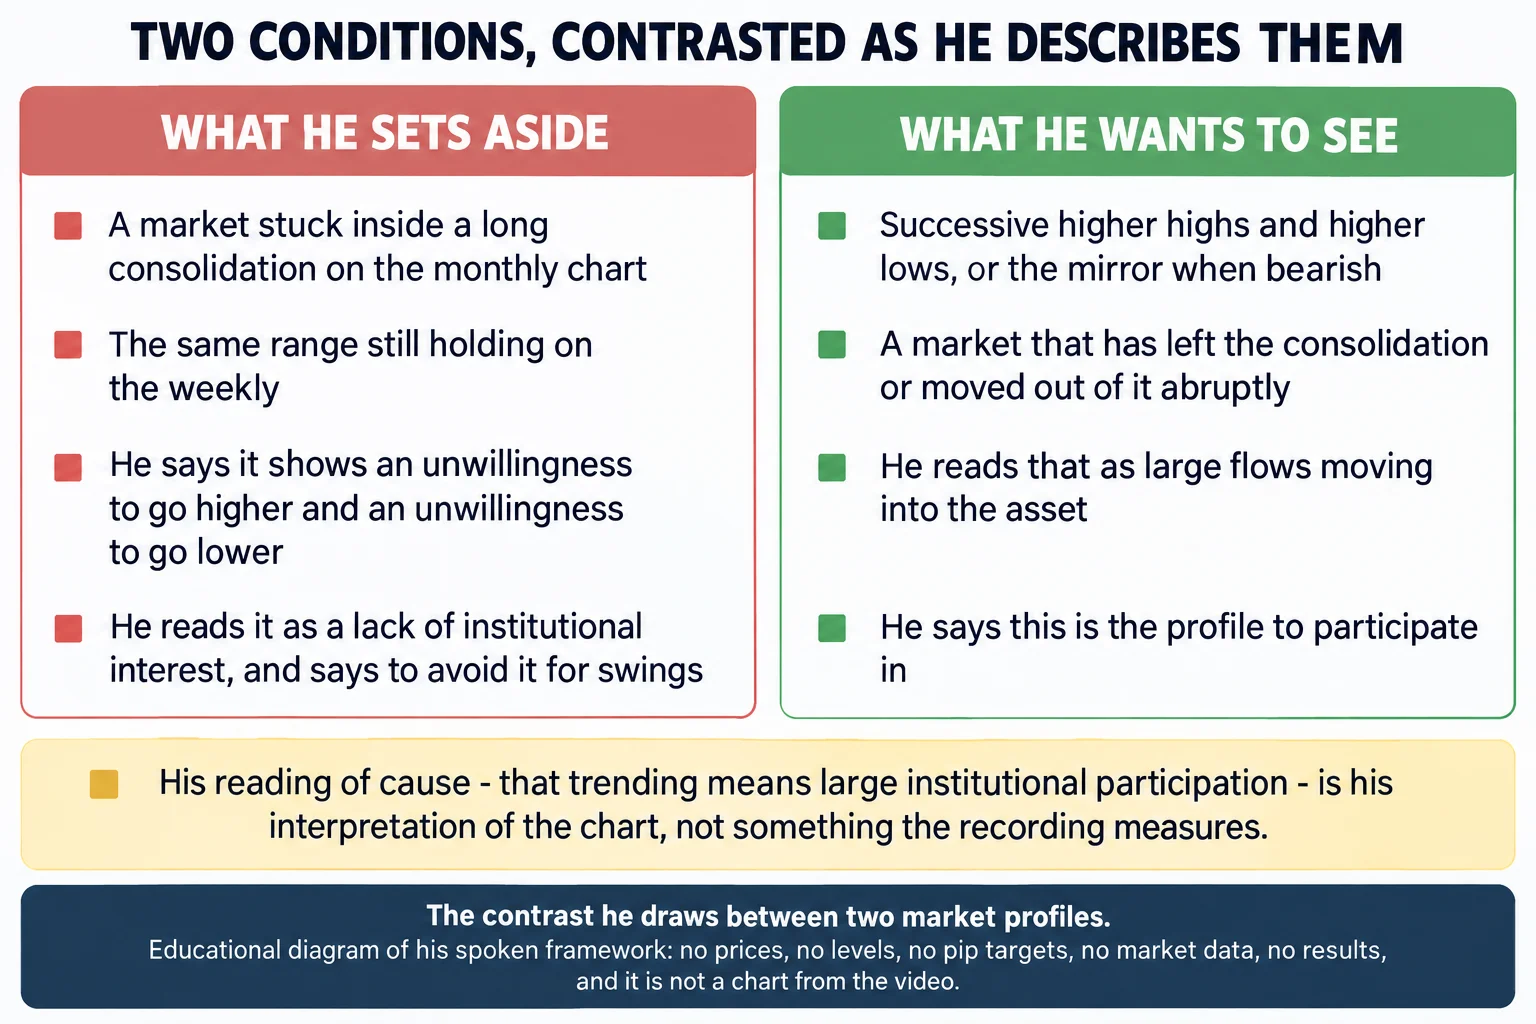
He extends the preference into one of the lesson’s clearer practical rules. When scanning currencies on monthly and weekly charts, he sorts them quickly into trending higher, trending lower, and trending in a consolidation or holding pattern (5:13). Markets inside large trading ranges are to be avoided, and his reason is that the range is there for a reason: a market that cannot leave a small consolidation to the upside is showing a lack of buying, and one that cannot break to the downside is showing a lack of selling, so it sits in neutrality (5:29, 5:39). He describes a market that has left consolidation, or one that has been pushed out of it, as indicative of larger players having moved it out of the holding pattern (6:13), and says that when such a market is on the monthly or weekly chart, stepping down to daily or four-hour charts helps find setups with energy behind them (6:13).
The distinction he is drawing is worth stating precisely because the two halves carry different weight. The observation – range bound versus directional, and for how long – is something a reader can check on any chart. The inference that a lack of movement equals a lack of institutional interest, and that movement equals institutional interest, is his framework’s explanation, and nothing in the recording tests it against positioning or flow data.
ICT Swing Trading Top-Down Workflow
The time-frame structure is explicit. Because monthly and weekly charts are long-term while trades are taken on a four-hour basis, he looks for setups on the monthly, weekly and daily charts and executes on the four-hour (4:50, 4:53, 4:57). His stated reason is probability – a move identified on a four-hour chart for entry into a market that is trending on the monthly or weekly has the higher-time-frame trend behind it (5:02). He summarises the whole approach as: start on the monthly and weekly, then work down top-down (10:22).
Follow the ICT Swing Market Direction
His direction rule follows from the profile preference: be willing to err on the direction, and avoid the temptation to pick tops and bottoms, because it is far more likely that an existing long-term trend influences price than that a long-term reversal does (6:51, 7:06). He says to focus on the long-term trend and let the tide carry the trade (7:11), and his argument for it is about durability – if monthly conditions point one way, that direction will probably continue for at least another month, which covers the two-week minimum he asks of a swing (7:21, 7:29, 7:39). He adds that taking the monthly and weekly bias as the starting point removes the need to decide which side of the market to be on (9:32).
The section on failed signals is the most useful part of that argument because it is falsifiable in principle. He describes the internal argument a trader will have when the monthly and weekly say higher but something on the lower chart suggests otherwise, and tells students to take the buy signal anyway, accepting that they may be wrong but wrong with the evidence of the higher time frame behind them (8:20, 8:26, 8:33). What would change his mind is repetition: if a buy signal on a daily or four-hour setup is stopped out and the next one fails too, he reads that as the market possibly being near a longer-term or intermediate-term shift, with the prevailing bullishness waning or the trend tiring (9:00, 9:07, 9:14). He adds that this is also a reminder not to fear taking losses, because they happen regardless (9:24).
There is a caveat to attach to the summary he gives of this idea. He says it is far more likely that a trader buying long-term uptrends or shorting long-term downtrends will be profitable and have the move work out (9:51, 10:01). That is his expectation, stated as likelihood rather than as a documented result, and the lesson contains no sample of trades, no accuracy figure and no equity curve. Nothing here should be read as an established edge.
ICT Swing Trade Examples
He then applies the screen to real charts. On the euro-dollar monthly chart he highlights the stretch from around the end of February 2015 or 1 March 2015 to the present and asks what profile it is, answering it himself as clearly consolidation – an unwillingness to go higher and an unwillingness to go lower, stuck in a range (10:39, 10:51, 11:08, 11:12). He asks whether that is a high-probability market to trade on the monthly and answers against it (11:22).
Switching to the weekly chart for the same period, he anticipates the objection that there are several hundred pips of probable direction inside the range, and answers it: the problem is that price is not moving easily outside the range and is staying tight (11:39, 11:43, 11:51). He concedes a trader can work that pattern back and forth inside the range (12:00), but says the best swing scenarios are markets without that hallmark – a market able to move on a monthly and weekly basis, which he again attributes to large flows entering the asset (12:06, 12:13, 12:19).
The contrasting example is the New Zealand dollar against the US dollar (12:27). On the monthly chart he points to higher lows and higher highs, price moving back up and closing a liquidity void up to the level the captions give as 7,490, and calls it a trending market rather than consolidation or reversal because it keeps making higher highs and higher lows (12:43, 12:50, 13:07). On the weekly he describes successive higher highs and higher lows, which he reads as buyers willing to buy the pair (13:19, 13:20, 13:25). He notes the same pair is referred to elsewhere in the lesson as kiwi and as New Zealand versus the dollar index (12:27, 14:30), and that figure – 7,490 – is a transcribed caption number, reported here as given.
His third example is dollar-yen on the monthly chart, where he shows a small section of price staying inside a consolidation and then leaving it abruptly (13:41, 13:44), and the same consolidation on the weekly where it moves several hundred pips higher (13:51, 13:54). He calls that willingness to leave the consolidation very strong for swing trades, and says that in this case a trader would look for swing trades on the long side (13:59, 14:03, 14:07).
ICT Swing Market Three-Month Exercise
Most of the second half of the lesson is a study exercise on the kiwi weekly chart. He explains the markup precisely: he draws vertical lines so that each line represents a new month (14:52, 14:55), and at the bottom of the chart the alternating white and orange squares mark the sequence of months – first white square for the first month, orange for the second, next white for the third (14:59, 15:12, 15:15, 15:19). The point is a pattern over three-month intervals: he says price offered a buying opportunity at roughly every three to four months, with each orange area showing some measure of retracement and a buying opportunity appearing in the very next month or inside it (15:21, 15:31, 15:35, 15:44).
He then sets homework on the daily chart of that same pair: study each of the retracement lows he marks, classify why each one offered a buying opportunity, and bring the work to the live session the following Tuesday (15:54, 16:02, 16:40, 16:43). He specifies the analytical content he wants: that the price has to come back to a level of discount, that the move can be examined in terms of the range and of where the sell stops sit, and that the arrays at each reference point are what he wants students to identify (17:37, 18:00). His final framing is that swing trading means looking for high-probability directional trades rather than range-bound trading inside a consolidation (19:10, 19:14, 19:21), and that his own swing model is tightly linked to that directional mindset – if the monthly and weekly point higher he looks to be a buyer and aligns his tools with that, and the reverse when they are bearish (19:24, 19:30, 19:44). He closes by saying the next lesson will add framework to what is looked for beyond the weekly chart (19:50).
Limits of ICT Swing Market Conditions
Several things need separating before the framework is taken as a method. There is no entry model in this lesson: he says a higher-time-frame direction does not mean a setup exists and that other things have to be looked for (10:29, 10:34), and the entries themselves are deferred to later lessons (19:50). There is no documented trade, fill, cost or account result anywhere in the recording; the 200-to-500-pip objectives (1:21) and the several-hundred-pip moves he points at on the charts are his descriptions of distance travelled in the examples he selects, not a performance record. The three-month buying-opportunity pattern on the kiwi chart (15:44) is a pattern he reads in hindsight on one pair, chosen because it already fits; he does not test it as a rule elsewhere, and he frames it as a study exercise for students rather than as a tested signal.
The causal claims also deserve their own boundary. “Large flows”, institutional participation and smart money are the vocabulary he uses to explain trend (4:11, 6:13, 12:19), and the recording supplies no positioning, volume or flow data to support them. What can be checked on a chart is the part he states visually: whether price is range bound or has left consolidation, on which time frames, and for roughly how long. That is the portion of the lesson a reader can verify independently, and it is also, on his own account, the part that gates everything else (3:49, 5:29).
ICT Swing Lesson Date and Identity
The upload date on the publishing channel is 19 September 2022, while the recording identifies itself as the February 2017 lesson one of the swing trading module. The two are different calendar references – a 2022 upload of a 2017 mentorship session – and neither contradicts the other. The chart period discussed in the worked examples is 2015 onward, which is consistent with a 2017 teaching and is treated here as the reference frame he is speaking from, not as a statement about the upload.
ICT Swing Lesson Caption Notes
This article was written from the video’s own auto-generated caption track, which is the primary source for every timestamp link above, and some of its renderings are worth flagging rather than silently correcting. The New Zealand dollar level comes through as “7490” (12:52) with no decimal form, and the transcript’s speech-to-text also renders the pair inconsistently – “kiwi versus the dollar” (12:27), then “new zealand versus the dollar index” (14:30), then “kiwi dollar” (14:15) – so the instrument is described here as the lesson describes it rather than as a single normalised symbol. On one bearish passage the caption reads “shore positions” where “short positions” is plainly meant (9:59), and “turtle soups” appears where he is describing range-bound trading (19:18). One segment renders a phrase as “what markets are trending higher” (5:18). The 7,490 figure is reported as transcribed and is not converted into an assumed decimal form or treated as a verified level. No level, price, fill or outcome from the recording’s charts is asserted as verified anywhere in this article.
Watch the Original ICT Swing Market Lesson
ICT Mentorship Core Content – Month 06 – Ideal Swings Conditions For Any Market
The Inner Circle Trader · published to YouTube on 19 September 2022 · listed as 1,205 seconds, about 20 minutes 5 seconds. The recording identifies itself as the February 2017 lesson one of the swing trading module. This video is the primary source for every timestamp link above.
The recording is not embedded here because the video owner has disabled playback on other websites. That was tested directly on 15 September 2026 from a BestProps page origin at both desktop and mobile widths: the embedded player loads and then reports “Playback on other websites has been disabled by the video owner”, with no playable stream in either case. The link above opens the recording on YouTube itself.
ICT Swing Trading Resources
These are the sources checked for this article. The central-bank and regulator pages are general reference material: the Reserve Bank of New Zealand page is the official source for the New Zealand dollar exchange-rate series used in the lesson’s main example, and the CFTC pages document the positioning data and the regulator’s own warnings about trading-system claims. None of them assesses the speaker, tests the market-profile framework or the three-month pattern, or endorses anything said in the recording. Any ICT, smart-money or third-party indicator, script, note set, transcript pack, chart annotation or re-upload circulating outside the publishing channel’s own page is unofficial and untested here.
- [1] ICT Mentorship Core Content – Month 06 – Ideal Swings Conditions For Any Market The Inner Circle Trader (primary source; watch page read 15 September 2026, listed at 1,205 seconds).
- [2]