
Key takeaways
This is lesson two of ICT’s swing trading module, and it is deliberately theory-only: almost no charts, a list of what he calls the hallmarks of a successful swing trade, and a homework assignment (2:46, 3:40).
Read the full summary
This is lesson two of ICT’s swing trading module, and it is deliberately theory-only: almost no charts, a list of what he calls the hallmarks of a successful swing trade, and a homework assignment (2:46, 3:40). The hallmarks are an obvious higher-time-frame trend or a departure from consolidation, clear institutional order flow, interest-rate and yield support, Commitments of Traders data as optional confirmation, obvious premium or discount arrays on the monthly, weekly and daily charts, optional seasonal alignment, and supporting intermarket analysis (0:28, 0:46, 1:00, 1:18, 1:28, 1:41, 1:49). From there he argues for static filtering rules with no exceptions (9:55, 10:08, 10:18), a risk-capacity gate that can force a trader to pass or cut an existing position rather than add (10:45, 12:14), and rewards framed as multiples of initial risk (12:35, 13:19). The homework is to write a mock swing-trading plan end to end – explicitly not for live or demo execution – defining the opportunity, the setup, entries and cancellations, stops, objectives, stop movement, partial profits, per-trade and portfolio risk, and the filter that rejects weak candidates, plus one hindsight example (13:50, 14:46, 15:28, 15:56, 16:07, 16:33).
How we researched this article
BestProps used document-based research from primary firm sources, checked September 24, 2026. The complete source list, scope, limitations, and commercial-state record appear near the end of this article.
The recording is the second swing-trading lesson of February 2017 (0:16), and he says at the outset that it will be the least popular delivery of the month because it carries the homework (2:46). He states that the purpose is diagnostic: to test where a student currently is and to leave a record of what they understand before he presents a model in lesson three, so that the gap can be measured afterwards (3:12, 17:20). What follows is therefore a set of ideas and vocabulary rather than a tradeable rulebook, and he says so himself.
The hallmarks he lists
He works through the list in a fixed order. First, an obvious trend on the higher-time-frame charts, meaning price is either moving higher and has left consolidation, or is trying to move lower or has already left consolidation and started lower (0:28). Second, institutional order flow on those higher time frames must be clear – his test being whether the chart is giving unqualified indications that it wants to trade higher or lower (0:46). Third, interest-rate markets should support the trade, and he asks specifically whether rates are rising or falling and whether a divergence in the yields is starting to appear that would signal a shift (1:00). Fourth is Commitments of Traders data, which he calls useful but not required, as something that can enhance the odds (1:18). Fifth, what the captions render as “opposing PDA or premium to Discount arrays” should be obvious on the monthly, weekly and daily charts (1:28). Sixth, seasonal tendencies, again optional rather than required (1:41). Seventh, supporting intermarket analysis that confirms the idea (1:49).
He then qualifies the list in two directions. He calls it a broad overview rather than an exhaustive checklist (1:57), and says he wants to accumulate as many of these factors as possible to build the case that an idea is valid (2:06). But he also concedes that a trade can still be viable without every item present (2:06), so the list functions as a preference rather than a threshold. His description of the result – that accuracy will be stunning and the trades will pan out – is his own characterisation of the approach, and the lesson supplies no data behind it (2:39).
Institutional sponsorship, read two ways
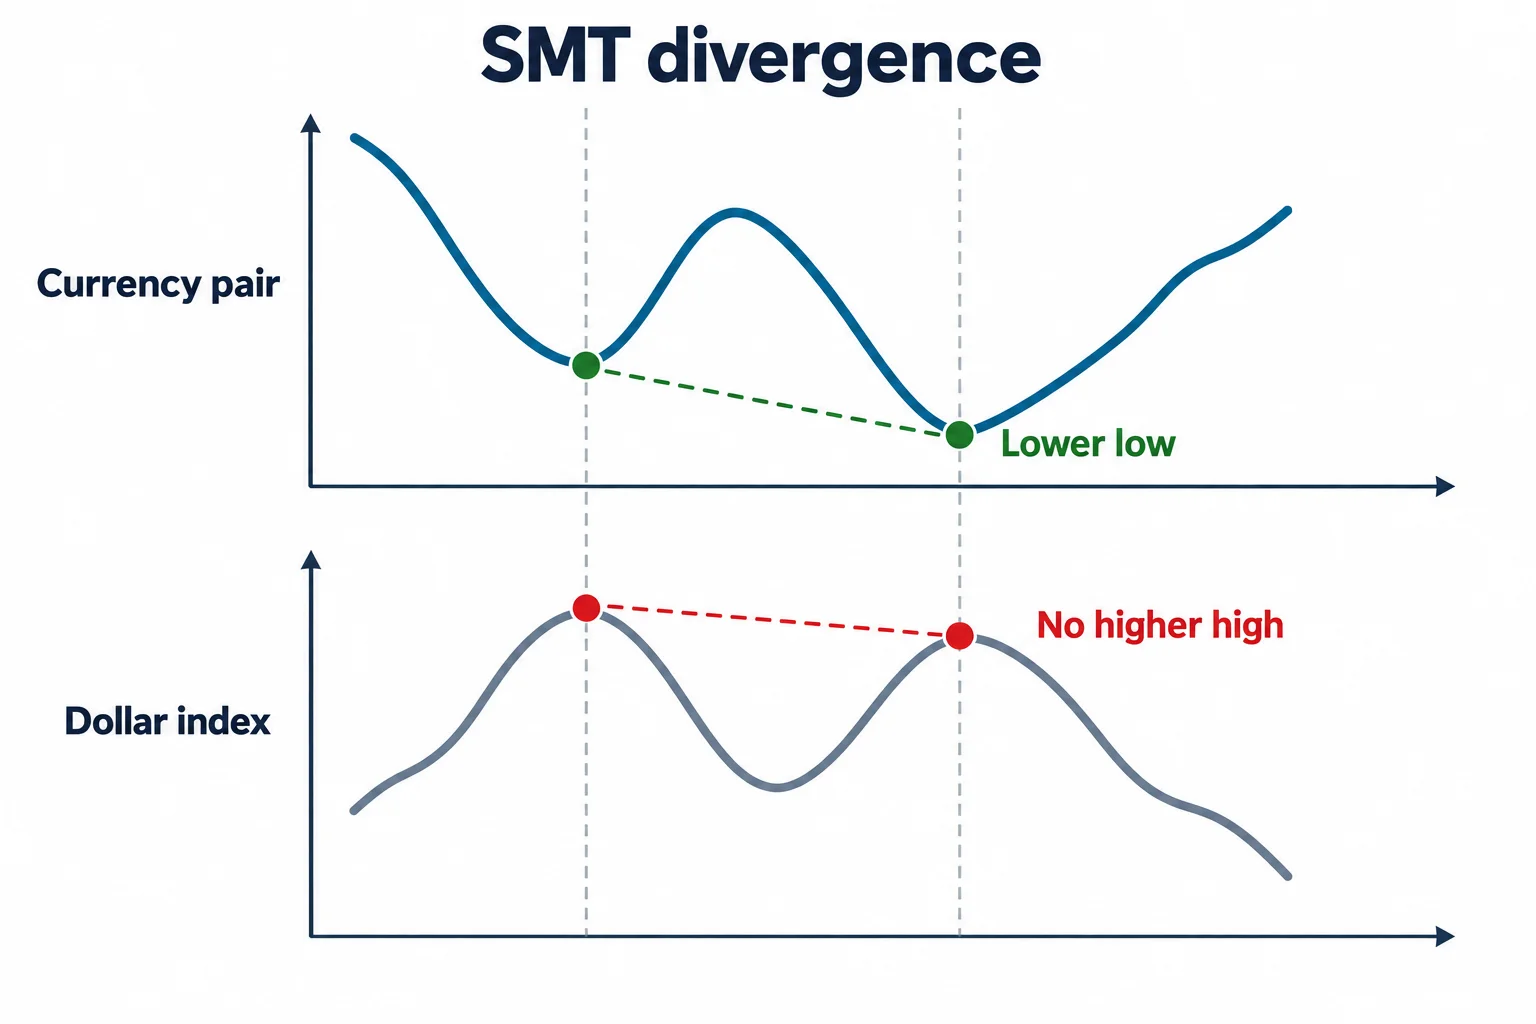
The relative-strength section is framed around a pair and the dollar index (4:08). On a long idea in a pair, he asks whether a lower low in the pair comes with a failure to make a higher high in the dollar index, which he reads as dollar weakness and describes using the term SMT divergence (4:11). He gives the mirror for shorts, using a lower high in a pair against a higher high in the dollar index (4:36). “SMT divergence” is his own label for non-confirmation between correlated instruments; the lesson does not define it formally and does not test it.
He then describes what he calls bank accumulation and distribution, and this part is observable rather than proprietary. On a rising market he asks whether the down candles are being bought and followed by higher prices, and whether swing highs are breaking and producing higher highs (4:53, 4:59). On a falling market he reverses it: up candles become resistance and produce lower prices, and swing lows break (5:10). His explanation of how he reads accumulation is that new buying happens when the market retraces and goes lower, because that is where the algorithm permits a lower price (5:34); in a bearish market he reads the rallies as a premium for adding shorts (5:34), and he summarises the method as measuring accumulation at down candles and distribution at up candles (6:28). That last step is where the interpretation outruns the evidence: price structure can be described without knowing who is buying, and the recording does not establish that any candle represents actual bank activity.
Clear price action and the levels he wants to see
His stated preference in setup selection is for markets with clear price action and very discernible levels above and below current price, whatever the asset class (6:45). The lists he gives are the familiar array names: above price, voids, mitigation blocks, breakers, fair value gaps, rejection blocks, old highs or lows; below price, mitigation blocks, breakers, liquidity voids, fair value gaps, bullish order blocks, rejection blocks and old lows or highs (6:57). The more obvious those are relative to current price, the better he rates the trade (6:57). He adds that price that has not traded in recent weeks or months, left imbalanced on a monthly or weekly basis, acts as a high draw on price (7:41), and that away from equilibrium he expects a move to an imbalance – premium if the breakout is higher, deep discount if it is lower (7:55).
Two remarks in this stretch carry more weight than the array vocabulary. He says the cleanest price action makes the most favourable markets, because there is less erroneous price action to distract or fool a trader (8:20), and after two decades he calls demanding the cleanest charts the hardest lesson he has learned (8:33). The concrete test he offers is almost behavioural: if a trader has to study a chart, hem and haw, and argue with themselves about whether something is an order block or a liquidity point, then it is probably not a good trade, and he says to pass (9:11, 8:46). He finishes the section by asking whether price is respecting the big-figure levels – the round numbers, the 50 mid-figure, the 80 and 20 levels, the 30s and 70s (9:28).
The filtering rule and the risk gate
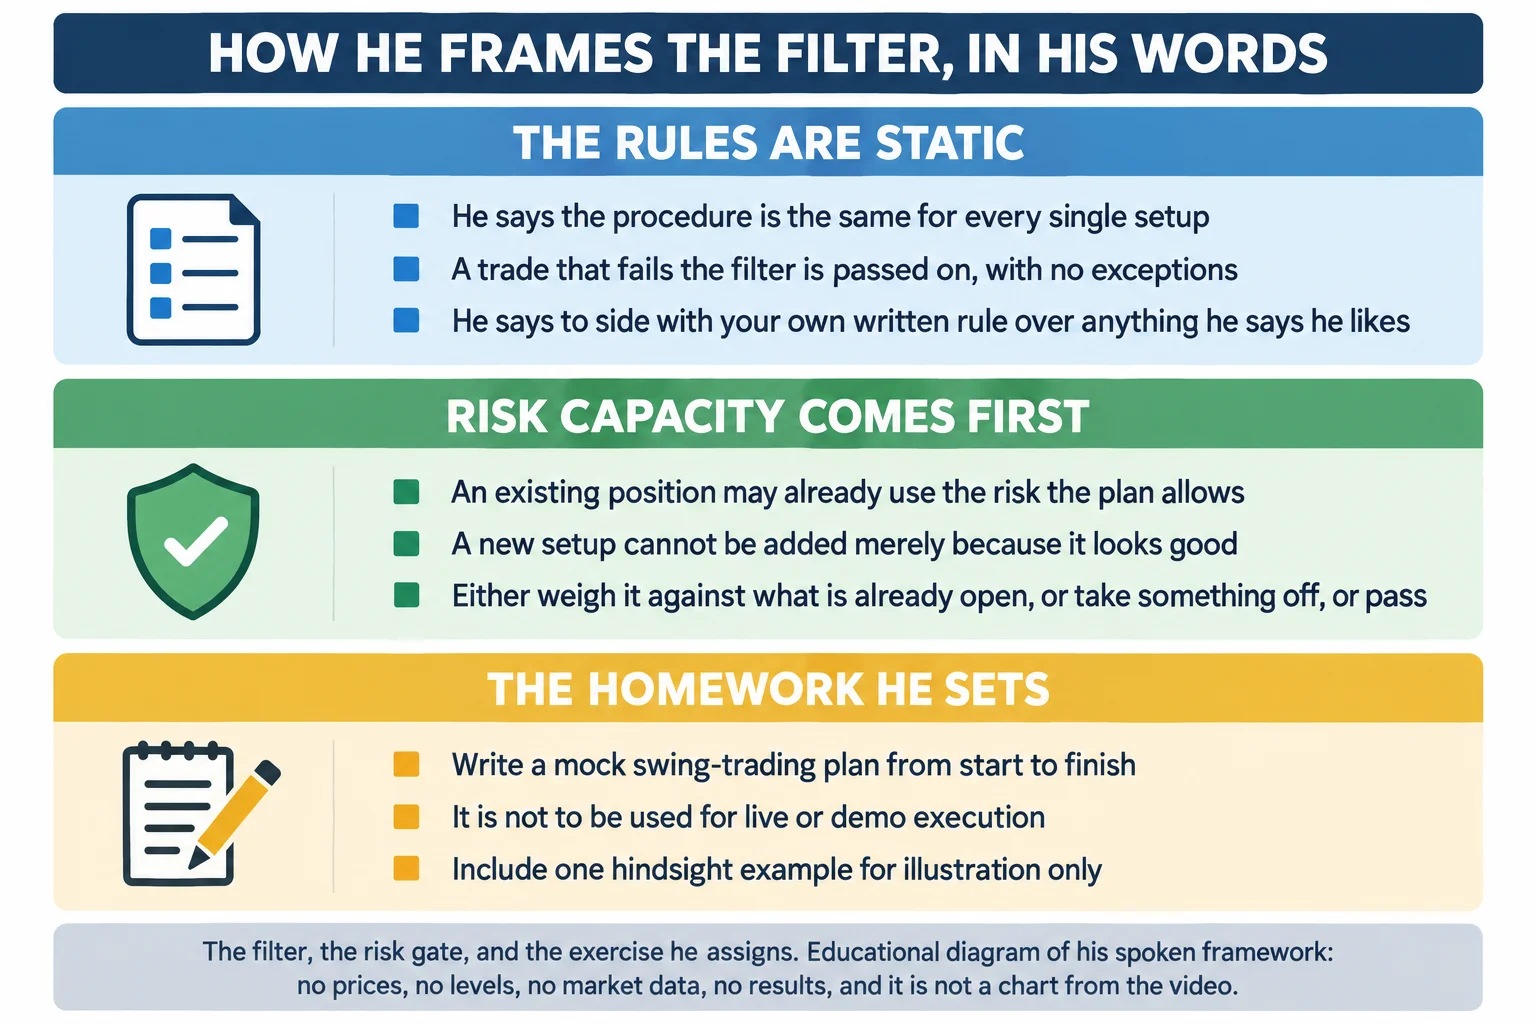
The rule-based section is the operational core of the lesson. He says every discipline needs a rule-based conceptual method, that the rules must be standardised and static rather than changing trade to trade, and that the same procedure is applied to every setup (9:55, 10:08). A setup that fails the filter is passed on with no exceptions (10:18). He is explicit about the order of authority: if your written rule says you cannot take a trade and he says he likes it, you follow your rule, not him (10:31).
Risk capacity then overrides opportunity. He notes that a trader may already hold one or two positions that use the allocation the plan permits, so a new setup cannot simply be added (10:45); no more than a specific percentage of risk may be assumed (10:54). The choice he describes is to weigh whether the new idea is more valid than what is already open, or potentially a better payer, and he illustrates that with a hypothetical: a long gold idea against a soybean idea he thinks will move faster, which he says means more velocity of money (11:04, 11:23). He adds the same comparison for a pair against an existing short (11:49). What a trader may not do is keep the existing open risk and take the new setup anyway – the options are to cut what is on, pass, or accept that risk management does not permit it (12:14, 12:25).
He frames the reward side as arithmetic rather than promise: with setups limited to a three-to-one reward against risk, he says an accuracy rate as low as 34 percent permits a net profit, which he calls marginal rather than wildly profitable (12:35, 12:39, 12:40). He extends the argument to five-to-one rewards, saying that gives higher odds of being profitable and makes losses easier to endure (13:19), and that setups with the most movement potential offer the better ratios (13:19). This is his own break-even arithmetic on paper. It does not account for costs, slippage, or the difference between a planned multiple and a realised one, and the lesson offers no sample of results.
The homework: write a mock trading plan
The assignment starts at 13:50. A mock trading plan is something the student writes themselves, mapping the process from beginning to end: what starts the trade, what executes it, what makes the stop where it is, when the stop moves, when profits are taken, when a trade is collapsed, how the trade is picked and framed (13:50, 13:52). He is upfront that many students will not know how to do it and asks them to engage anyway, because lesson three will walk through building a model from the ground up and the gaps will be filled there (14:46, 15:28).
The written prompts he gives are specific. What is an initial opportunity, and what would you identify as a valid swing setup (14:46, 15:03)? How would you determine profit objectives, in a static form that filters every trade the same way (15:28)? How would you frame risk – how much per trade, how much total exposure, when the stop moves, whether partial profits are taken (15:56, 16:07)? And what would your filter process consist of: the step-by-step method for eliminating opportunities that do not have the highest probability, or advancing them to executable (16:33)? He asks for it in writing, shared on the community forum if the student is willing, and says he will work through emailed plans over the coming months (16:07). He also sets a deadline – before he delivers lesson three – and asks students not to jump ahead to that lesson first (18:02, 19:31).
Two explicit limits belong with the assignment. He states that the plan is not something the student is going to trade, not even in a demo (17:20), that lesson three will present a model for contrast (17:34), and that only one hindsight example is wanted, for illustration (17:34). He does say that after the month’s content they will go into the marketplace to find a setup and execute on it (19:22), but that is a statement about his course sequence, not permission to trade off this lesson. The purpose he gives for the exercise is decision quality: writing it out means every decision has a stated reason, so a trader is not reacting to emotion, to him, or to other people’s commentary, but to what price is doing (20:20, 20:41, 20:54).
What the lesson does not provide
He says the specific setups come later: lesson three will cover the process and the two swing setups he uses (17:34, 19:22). So this recording deliberately contains no entry model, no worked example with levels, no documented trade, and no outcome data. Its own claims about accuracy and about trades panning out are assertions about a method he has not yet taught in this module, and nothing here tests them. The lesson is preparation for a model, not the model itself.
Two further things are worth keeping separate. The vocabulary the lesson leans on – institutional order flow, SMT divergence, premium and discount arrays, accumulation and distribution – is his framework’s language, and this lesson does not define those terms; readers who want the definitions need the earlier content he refers to (19:22). And the chart specifics are absent by design: he says there are not a lot of charts in this one and that it is all theory (2:46), so nothing in the transcript establishes particular levels, candles or reactions that a reader could check against a chart. Where the captions themselves are doubtful, they are flagged below.
A note on the caption track
This article was written from the video’s own auto-generated caption track, which is the primary source for every timestamp link above. The track has a few renderings worth flagging. The fifth hallmark comes through as “opposing PDA or premium to Discount arrays” (1:28), which in context reads as premium and discount arrays rather than a distinct “PDA” concept, and this article has described it that way rather than inventing a definition. “Cot data” is expanded in the next breath to the Commitment of Traders report (1:18), so that one resolves itself in the audio. The dollar-index comparison in the relative-strength section is transcribed with the pair named as “euro dollar” and “Dollar swissy” (4:11, 4:36), and the third-to-one reward discussion is transcribed with the accuracy figure as “34” (12:40) – both are reported here as the captions give them. No level, price or outcome is asserted anywhere in this article, because the recording does not supply one.
Watch the original recording
ICT Mentorship Core Content – Month 06 – Elements To Successful Swing Trading
The Inner Circle Trader · published to YouTube on 19 September 2022 · listed as 1,343 seconds, about 22 minutes 23 seconds. The recording identifies itself as swing trading lesson number two of February 2017. This video is the primary source for every timestamp link above.
The recording is not embedded here because it will not play inside a third-party embed. That was tested directly on 17 September 2026 from a BestProps page origin: the embedded player loads and then stops at a surface reading “Video player configuration error” with error code 153, offering a Watch on YouTube prompt instead of playing, with no playable stream and no reported duration. The link above opens the recording on YouTube itself.
Resources
These are the sources checked for this article. The regulator pages are general reference material: the CFTC page documents the positioning series the lesson calls optional confirmation, and the investor education pages cover asset allocation and the regulator’s own warnings about trading-system claims. None of them assesses the speaker, tests the framework, or endorses anything said in the recording. Any ICT, smart-money or third-party indicator, script, note set, transcript pack, chart annotation or re-upload circulating outside the publishing channel’s own page is unofficial and untested here.
- [1] ICT Mentorship Core Content – Month 06 – Elements To Successful Swing Trading — The Inner Circle Trader (primary source; watch page read 15 September 2026, listed at 1,343 seconds).
- [2] The Inner Circle Trader — official YouTube channel (read 15 September 2026) — the publishing channel for the ICT mentorship series, including the swing trading module this lesson belongs to.
- [3] CFTC — Commitments of Traders (read 15 September 2026) — the regulator’s own publication of the weekly positioning data behind the optional confirmation the lesson describes. Its reports run on a weekly schedule and are not the same lines as any chart series shown in the recording.
- [4] Investor.gov (U.S. SEC) — Asset Allocation (read 15 September 2026) — the regulator’s plain-language explanation of splitting investments across categories, relevant background to the lesson’s discussion of total exposure and portfolio-level risk. General reference, not evidence about the method.
- [5] CFTC — Fraud Advisory: Commodity Trading Systems Sold on the Internet (read 15 September 2026) — the regulator’s guidance on evaluating trading systems and advisory services, including its warnings about claims resting on hypothetical results and about performance figures that omit costs.
Source: ICT, ICT Mentorship Core Content – Month 06 – Elements To Successful Swing Trading, The Inner Circle Trader, published 19 September 2022; the recording identifies itself as swing trading lesson number two of February 2017. Transcript SHA-256 1394b8b202cd9e6b62cab6516787754f3c75f35e32d8c0c55be40142c4722b99. Educational write-up of the speaker’s own framework; it is not trading advice, and no strategy, level, entry or parameter above has been tested or verified here.