
Key takeaways
This is lesson three of ICT’s February 2017 mentorship month on swing trading, and it covers his classic swing trading approach (0:25).
Read the full summary
This is lesson three of ICT’s February 2017 mentorship month on swing trading, and it covers his classic swing trading approach (0:25). The premise is that the arrays most recently reacted to indicate which side of the spectrum price will reach for next: if discount arrays have been providing support, he expects premium arrays above to be sought, and vice versa (0:50). He defines a range around current price and inventories a specific sequence of areas above and below it — mitigation blocks, breakers, liquidity voids, fair value gaps, order blocks, rejection blocks built from candle bodies with wicks, and old or historical highs and lows — noting that not every array type will exist in a given range (1:20). The higher-time-frame sequence works monthly to weekly to daily, with the four-hour chart as the executable time frame, and full alignment across all four is his easiest and most probable condition (7:57). The procedure has four stages: establish a higher-time-frame premise, wait for displacement away from the point of origin, wait for the retracement into a mapped array, then look for participation if price confirms the premise (9:49). On the bullish side he maps the range between the point of origin and the intermediate-term high and searches it for discount arrays; the bearish version mirrors that using premium arrays (29:06). He also gives a failure protocol: if a four-hour buy array fails, look for the next lower discount array at 50 percent of the previous position size; a failed four-hour sell array moves to the next higher premium array under the same sizing rule, and he says not to try to win the lost equity back in one trade (37:39). He states a preference for setups offering at least three units of reward per unit of risk, preferably closer to five (36:51). The recording supplies no documented fills, no verified outcomes, no stop-placement rules, no account loss limits, transaction costs or maximum attempt count, and no comparative evidence that any of it is profitable.
How we researched this article
BestProps used document-based research from primary firm sources, checked September 24, 2026. The complete source list, scope, limitations, and commercial-state record appear near the end of this article.
The premise: which side of the spectrum price reaches for
The recording identifies itself as lesson three of the February 2017 mentorship content on the classic swing trading approach (0:25). He opens by defining market conditions in terms of where price can reach, on both the rally and the decline, and calls that the foundation for determining likely direction (0:39).
The working rule is stated plainly: the PD arrays that have most recently been traded to or executed on indicate that the opposite side of the array spectrum will be reached for (0:50). He spells out both halves — if discount arrays have been providing support for price, the probability increases that premium arrays above will be sought; if premium arrays have been providing resistance, the probability increases that discount arrays below will be sought (0:50). These are his stated probabilities, not measured frequencies, and the recording offers no sample or test behind them.
He then walks the inventory in order, using a monthly chart illustration he says could be any asset class — he names a Swiss franc example — and defines the range price is presently in relative to current market price (1:20). Above and below that reference he looks, in this sequence: the nearest bearish mitigation block above and bullish mitigation block below; any bearish breakers above that have not yet been traded to and any bullish breakers below; liquidity voids above left by fast downward repricing and liquidity voids below left by fast rallies; fair value gaps above and below; the nearest bearish order block above and bullish order block below; candles with wicks at short-term highs or lows, where he marks the candle bodies because that is where he says liquidity rests, which he calls rejection blocks; and finally any old high or historical low beyond those (1:20). He stresses that these arrays may simply not exist in current price action, but that this is the spectrum to look through (1:20).
The time-frame sequence and the executable chart
He frames the higher-time-frame sequence around what he has previously called sell and buy programs. On the shorting side it starts on the monthly chart, where he wants to see the market move away from a resistance level — which may be a bearish order block — and the same behaviour is then sought on the weekly and daily charts (5:17). For buying, he wants monthly, weekly and daily charts showing sensitivity to discount arrays, then a four-hour pullback into a discount array so that the trader is in sync with all four time frames (5:17).
He calls the four-hour chart the executable time frame throughout, and says the easiest and most probable swing trading setups are the ones where monthly, weekly, daily and four-hour are all in alignment (7:57). That preference is a stated opinion: the recording does not compare how aligned setups perform against partially aligned ones.
The four-stage setup sequence
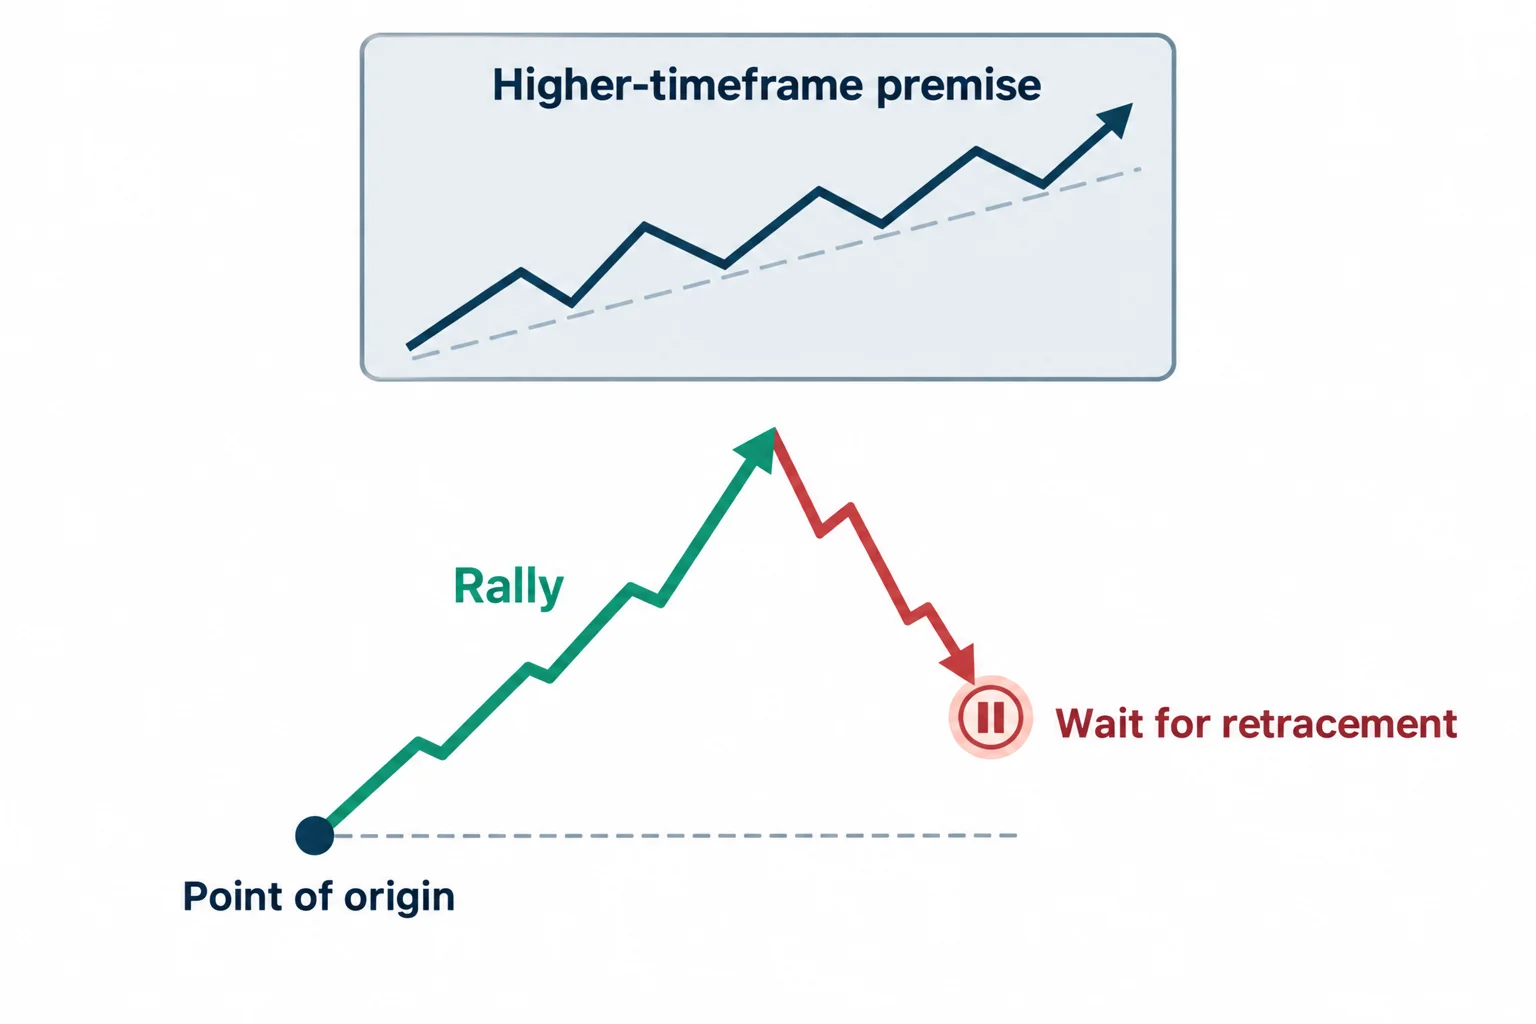
The general concept is introduced at 9:49. He describes the market as already predisposed or poised to trade higher on a higher time frame, a conclusion he says can be reached through seasonality, interest-rate conditions, the Commitments of Traders report, inter-market analysis or market structure. His practical point about how many inputs are needed is worth noting: he says a few things in agreement is a large enough sample and that everything does not have to line up (19:00). Interest rates he treats as his highest-probability single input, and he refers back to interest-rate differentials between currencies as an example (19:00).
From that premise the sequence is: price rallies away from the point of origin, and the trader then waits for a retracement rather than chasing the move. He is explicit that this waiting is the hard part — he says you had to sit on your hands until the retracement came to fruition, because only then does the setup stage exist (12:51). Once the retracement is under way he defines the range between the point of origin and the intermediate-term high made before the retracement, calls everything below that high down to the origin the discount matrix, and inventories that range for the arrays actually present in it (16:40). The bearish procedure is the mirror image: he defines the range from the short-term low up to the point of origin as the premium matrix and sells above the rejection-block candle bodies, doing the same exercise on the monthly, weekly, daily and four-hour charts and transposing the levels down (29:06).
He notes that once you have inventoried the discount side you should also determine where the premium arrays sit on the same time frame, because that is where the trade is scaled out (20:51). The stated execution is to buy all four-hour discount arrays — bullish order blocks, bullish breakers, bullish mitigation blocks, violated old lows, and rejection blocks below candles with wicks, which he describes as entering just below the candle bodies in the manner of a turtle soup long, without needing price to trade through the wicks (20:51). Profits are then taken at the daily, weekly and monthly premium arrays that have been transposed down to the four-hour chart (20:51).
On risk and reward he gives a concrete selection rule: he looks for setups offering at least three times the range between the entry and the closest opposing array across all time frames, and says he prefers scenarios closer to five to one (36:51). He also describes how the position should be wound down — taking something off at the four-hour, daily and weekly premium arrays as price advances, and holding the smallest portion of the position by the time price is pressing into the monthly and weekly range, because that is where the odds of continuation fall (36:51).
The stated trade procedure, step by step
His procedure section begins at 18:44 with the instruction to read the nine-to-18-month market profile on the monthly and weekly charts and decide whether the market is trending or in range-bound consolidation. If it is consolidating, what he looks for is a market that leaves that range aggressively — on a monthly or weekly chart he treats that as displacement and says the market then has to be followed because it most likely wants to trend (19:00).
From there the order is: determine the monthly PD arrays and note which discount arrays are active; if the monthly discount arrays are supporting price, determine the monthly premium arrays as well; transpose those levels to the weekly chart and repeat; then to the daily chart and repeat; then to the four-hour chart and repeat (20:51). He acknowledges that some array types will be absent on any given time frame — there may be no void or no breaker — and that only the ones that are actually present are labelled and carried down (20:51). The bearish procedure at 32:43 inverts all of it: premium arrays are mapped on the monthly, weekly, daily and four-hour charts and transposed down, while the discount arrays become the objectives.
He also explains why the time-frame transfer exists at all, with a fractal argument: a weekly impulse can be broken down into daily impulse, retracement and expansion swings, and each daily swing can in turn be seen as four-hour impulse, retracement and expansion swings (25:07). Because discount arrays exist inside each of those swings, a failed buy at one scale can be followed by looking for a buy inside the next higher-time-frame discount array instead (25:07).
The failure protocol and the 50 percent sizing rule
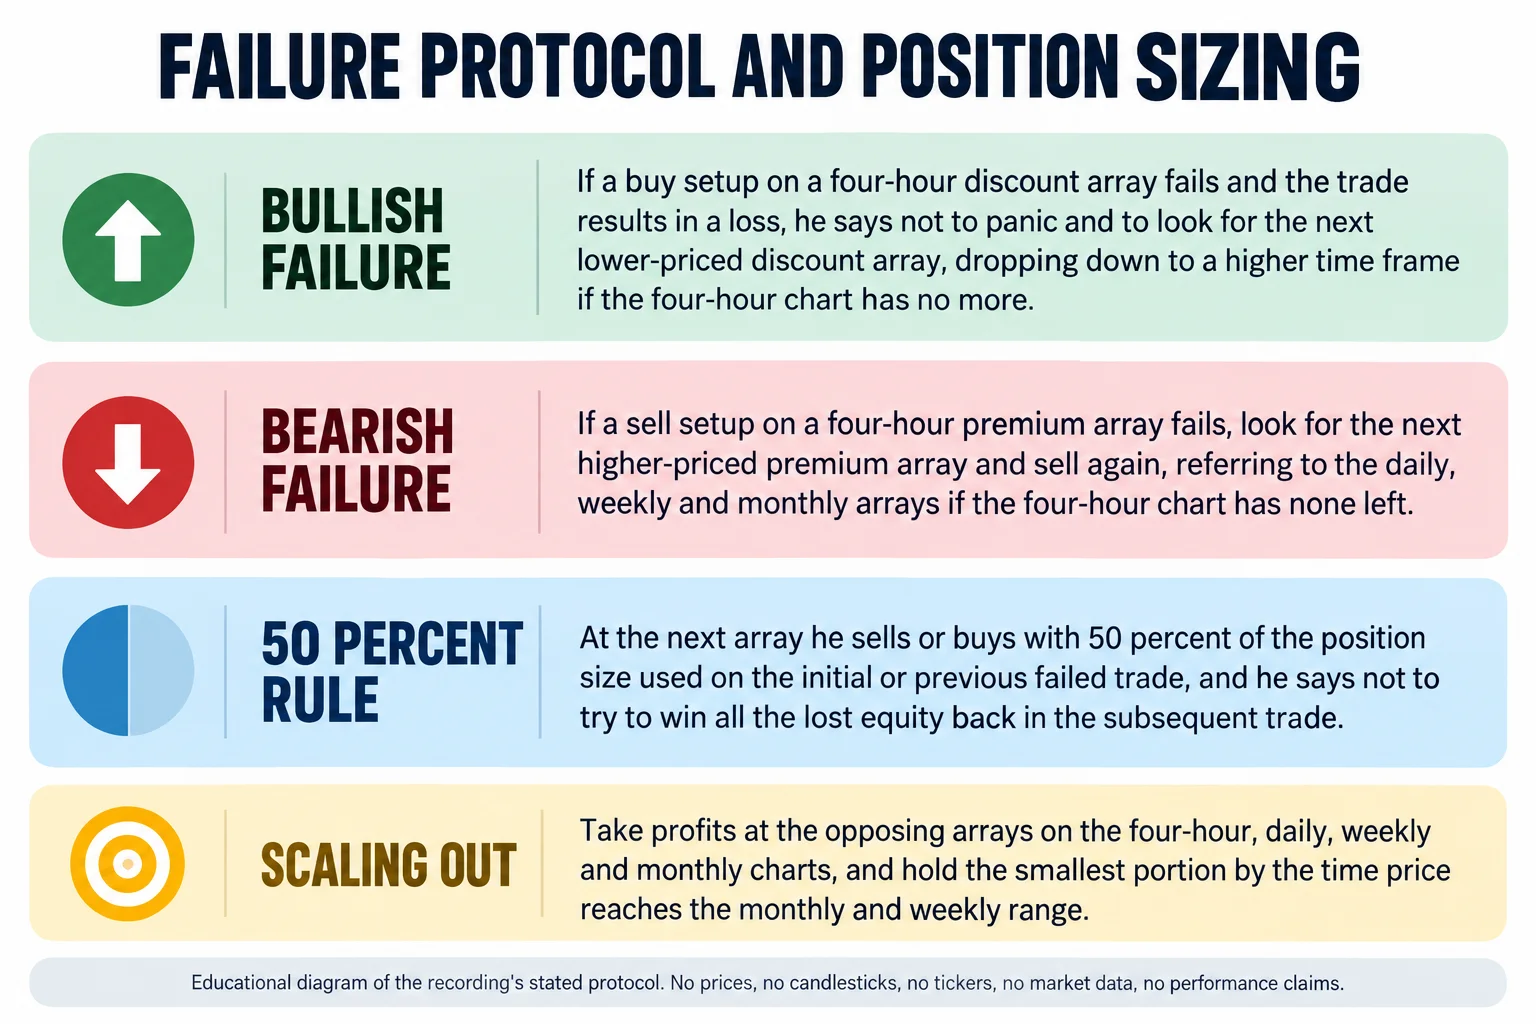
The set-up failure protocol is stated for both directions. If a buy setup on a four-hour discount array fails and the trade results in a loss, he says not to panic: simply look for a lower-priced discount array, and if the four-hour chart has no more discount arrays left, refer to the daily, weekly and monthly arrays for a better price (23:24). The bearish version, given at 37:39, mirrors it: if a sell setup on a four-hour premium array fails, he says the trade results in a loss and the trader goes to the next higher-priced premium array — whether that is a bearish order block, a trade through an old high, or something else — taking every one of them in turn, and if the four-hour chart runs out, referring up to the daily, weekly and monthly premium arrays.
The sizing rule attached to that protocol is explicit: at the next array he sells or buys with 50 percent of the position size used on the initial or previous failed trade (37:39). He also states the intent directly — do not try to win all of the lost equity back in the subsequent trade, get what the trade gives you, and if it only delivers something less than the full loss, be satisfied with that because it is still mitigating the loss (37:39).
Two limits belong with this section. Halving the size reduces the exposure per attempt but does not remove the risk of consecutive losses, and repeatedly re-entering at successive arrays still accumulates exposure. The recording does not specify stop placement, an account-level loss limit, transaction costs or a maximum number of attempts, so the protocol cannot be evaluated as a complete risk system from this source alone.
The confirmation rule and the close of the lesson
Near the end he gives a running confirmation condition: always confirm that lower-time-frame discount arrays give way or fail as price moves in your favour, and that new premium arrays resist price as it moves toward discount arrays on the higher time frames (39:45). Expressed operationally, he wants to see bullish order blocks or down candles broken and each support level giving way, with new resistance found at old up candles — and he says that as long as that keeps happening, the trader is seeing institutional sponsorship on side, which he calls a great condition to be in when short (39:45).
The lesson closes by saying he will now look at specific setups that can be used with this idea for swing trading, and then signs off until lesson four (39:58). The recording ends at that point, so the worked examples he refers to are not contained in this source.
A study routine drawn from the lesson
- Read the nine-to-18-month monthly and weekly profile and classify the market as trending or range-bound, treating an aggressive departure from a range as displacement (19:00).
- Inventory the arrays above and below current price in the order he gives, and note which types are simply absent rather than assuming all of them exist (1:20).
- Work the sequence monthly to weekly to daily to four-hour, transposing levels down and labelling only the active arrays on each chart (20:51).
- When price displaces away from the point of origin, define the range to the intermediate-term high or low and wait for the retracement instead of entering the impulse (12:51).
- Record the reward-to-risk the setup actually offered against his three-to-one minimum, and note where the opposing arrays sat (36:51).
- Log failures against the stated protocol and check whether the next array was reached at half size, as he describes (37:39).
This checklist is an educational reading of the lesson. The recording does not provide entries, stop placement, position sizing beyond the halving rule, transaction costs, instrument selection, loss limits or results, and none of those gaps should be filled in from elsewhere.
Watch the original recording
ICT Mentorship Core Content – Month 06 – Classic Swing Trading Approach
The Inner Circle Trader · published 20 September 2022 · about 40 minutes 3 seconds. This recording is the primary source for every timestamp link above.
The recording is not embedded here because the video owner has disabled playback on other websites. That was tested directly on 15 September 2026 from a BestProps page origin at both desktop and mobile widths: the embedded player loads and then reports “Playback on other websites has been disabled by the video owner”, with no duration and no playback progress, while the video itself plays normally on YouTube. No half-working player is left on this page.
The watch page was read on 15 September 2026 and is publicly listed as ICT Mentorship Core Content – Month 06 – Classic Swing Trading Approach by The Inner Circle Trader, upload date 20 September 2022, not private and not unlisted, with a listed duration of 2,403 seconds — about 40 minutes 3 seconds. The caption track used here runs to 2,402.7 seconds, so the transcript and the listed duration agree. The description states that the audio and visuals are as distributed in February 2017, which matches the speaker opening the recording as the February 2017 mentorship material.
A note on the captions
This article was written from the automatic YouTube caption track, which is machine generated and mishears several terms in this recording. “Bearish order block” appears repeatedly as “bear shorter block” or “bear shoulder block” (20:51). “Buy program” is rendered as “by program” and “sell program” as “cell program” (5:17). The Commitments of Traders reference is rendered as “commitment Traders” and once as “commit administrators” (19:00). SMT divergence appears variously as “SMT”, “s t” and “smt” (19:00). The word “rally” is once rendered as “aurelian” (0:39), and “turtle soup” appears with correct spelling (20:51). Where phrasing was ambiguous the meaning was taken from surrounding context and the reading is noted in this article rather than presented as the speaker’s exact wording. Nothing here comes from anywhere other than the spoken content of this recording; no chart reading or trade outcome has been supplied from outside it, and this review did not view the recording’s charts.
Resources
These are the sources checked while preparing this article. The regulator and investor-education pages are general material about how trading systems offered to the public should be assessed and about the risk of short holding periods; neither evaluates this speaker, verifies any array, time-frame sequence, sizing rule or reward-to-risk preference described above, nor endorses anything said in the recording. Any ICT, smart-money or third-party indicator, script, note set, chart annotation, transcript pack or re-upload circulating outside the publishing channel’s own page is unofficial and has not been tested here.
- [1] ICT Mentorship Core Content – Month 06 – Classic Swing Trading Approach — The Inner Circle Trader (primary source; watch page read 15 September 2026, listed duration 2,403 seconds).
- [2] The Inner Circle Trader — official YouTube channel (read 15 September 2026) — the publishing channel for the 2017 mentorship series used here.
- [3] CFTC — Fraud Advisory: Commodity Trading Systems Sold on the Internet (read 15 September 2026) — the regulator’s guidance on assessing trading systems and advisory services offered to the public, including its warning that hypothetical trading results are typically simulations calculated over historical price data with the benefit of hindsight.
- [4] Investor.gov (SEC) — Day Trading (read 15 September 2026) — investor education describing day trading as extremely risky and capable of producing substantial financial losses in a very short period.
Source: ICT, ICT Mentorship Core Content – Month 06 – Classic Swing Trading Approach, The Inner Circle Trader, 20 September 2022. Automatic YouTube captions were the transcript used for this article, and the terms the track mishears are noted above. This commentary is educational and is not investment advice.