
Key takeaways
This is lesson five of ICT’s February 2017 mentorship month on swing trading, and it covers high-probability sell setups in bear markets (0:10).
Read the full summary
This is lesson five of ICT’s February 2017 mentorship month on swing trading, and it covers high-probability sell setups in bear markets (0:10). He works the premium side of his PD array matrix on a monthly, weekly, daily and four-hour sequence, arguing that premium arrays on all three of the higher time frames are what drive price lower (0:48). The rules are stated as conditions: when monthly, weekly and daily are all bearish he sells daily and four-hour bearish premium arrays — old highs or lows, rejection blocks, bearish order blocks, fair value gaps, liquidity voids, bearish breakers and bearish mitigation blocks (1:42). When the daily turns bullish inside a bearish monthly and weekly he treats it as a correction and prefers premium arrays at or nested inside weekly premium arrays (2:23), and he adds an avoidance condition: do not sell the daily premium array if the daily has just posted a lower low and rejected it, which he reads as a bullish breaker (2:52). He demonstrates the process on an 18-month EUR/USD sample, transferring monthly references onto the weekly chart, refining weekly bearish order blocks and their mean thresholds, then mapping those levels onto the daily and four-hour charts (3:41). Downside objectives are the discount references below price, and he explicitly labels several examples as losses or stop-outs rather than presenting only winners (19:00). He also states that four-hour analysis produces more setups and more failures than monthly and weekly work (27:40), and describes the intended holding period as roughly two weeks to a month while noting one three-day example did not meet his own time criterion (21:27). The recording gives no complete entry, stop-loss or position-sizing system and no verified performance record; the pip figures he quotes describe chart moves selected for instruction, not documented fills.
How we researched this article
BestProps used document-based research from primary firm sources, checked September 24, 2026. The complete source list, scope, limitations, and commercial-state record appear near the end of this article.
ICT bear-market swing-trading context
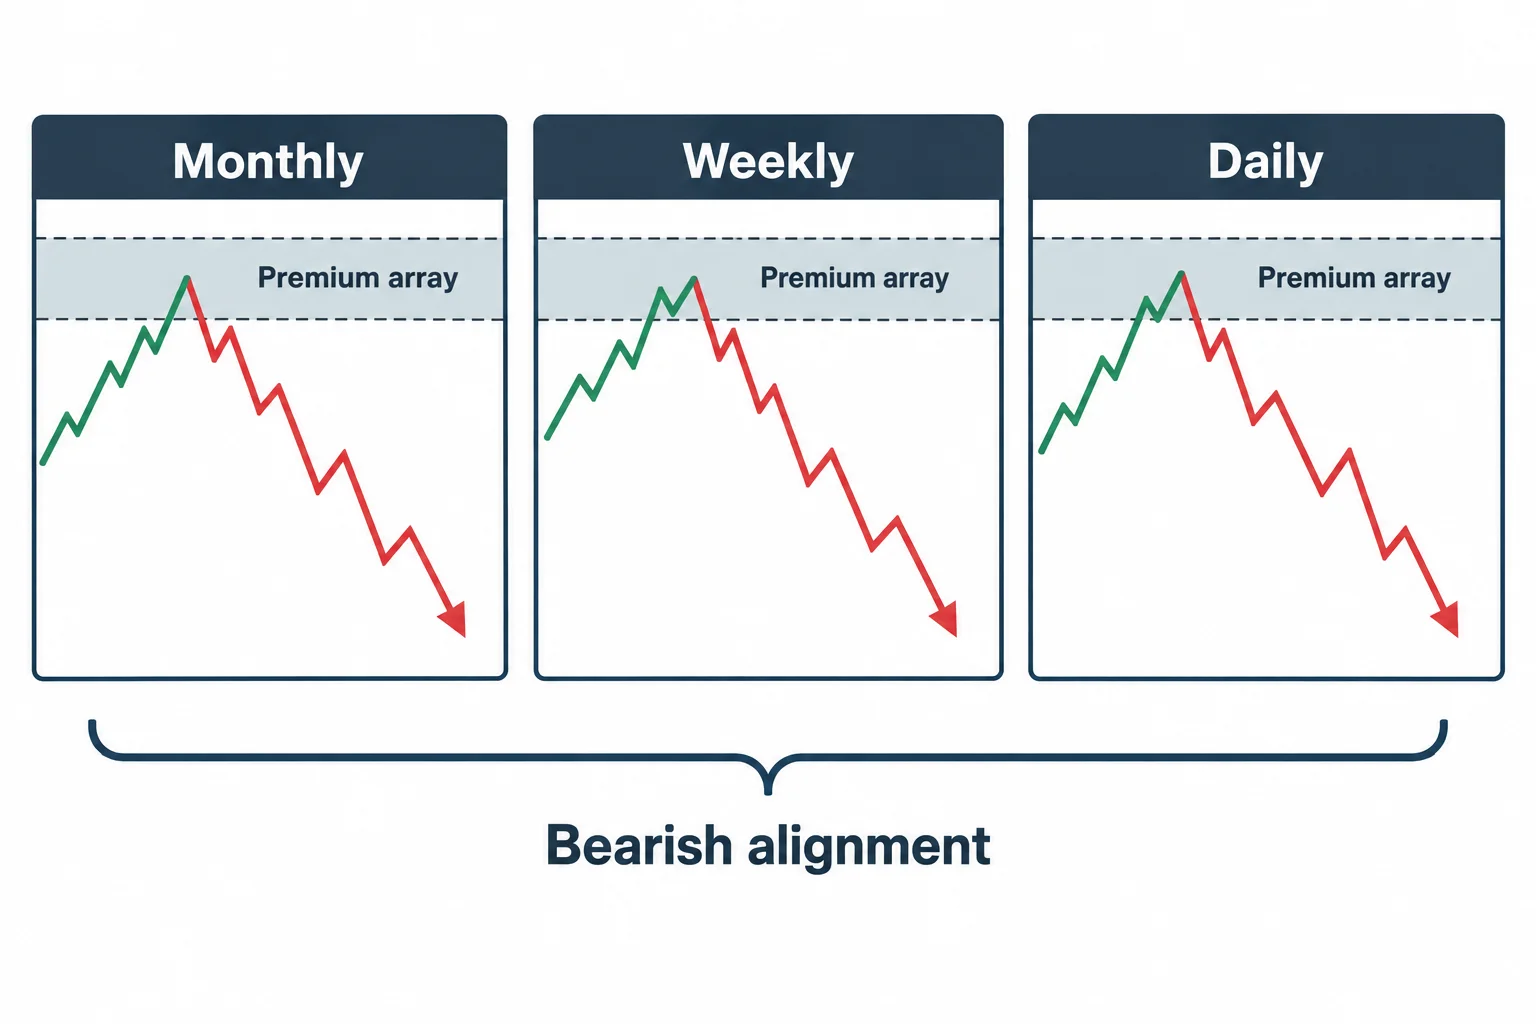
The recording opens by placing itself as lesson five of February 2017 and names the topic: high-probability swing-trade setups in bear markets (0:10). He says the PD array matrix is included again purely as a reference point so that viewers do not have to go back and forth between videos (0:30). This lesson uses the premium side of that matrix, on what he calls the bearish monthly, weekly and daily sequential (0:48).
His stated reasoning is repeated three times in almost identical wording: a premium array on the monthly chart has shown itself able to induce selling, evidenced by price moving lower; the same is then said of the weekly chart and of the daily chart (0:48). From that he concludes that when all three time frames are bearish, every candle supplies fresh resistance and there is little to no upward strength to trade against. This is his interpretation of the charts he presents, not a measured result, and the recording offers no statistics behind the claim.
ICT bearish swing-trade conditions
The lesson’s core is a short set of if-then statements. The first covers full alignment: when the monthly, weekly and daily are all bearish, he sells all daily bearish premium arrays and every four-hour bearish premium array (1:42). He names the forms those arrays can take: an old high or low, a rejection block above the candle bodies, a bearish order block, a fair value gap, a liquidity void, a bearish breaker, and any bearish mitigation block (1:42).
The second covers a mixed reading: monthly bearish, weekly bearish, but daily bullish. He describes that as a correction already under way on the daily chart, and says he sells daily bearish premium arrays located at or nested inside weekly premium arrays, with four-hour bearish premium arrays taken at daily arrays or nested inside weekly bearish premium arrays (2:23).
The third covers monthly bearish with both the weekly and the daily bullish: in that case he shifts to selling daily bearish premium arrays at or nested inside monthly premium arrays, and four-hour bearish premium arrays at weekly arrays or nested inside monthly bearish premium arrays (3:07).
Two avoidance conditions accompany those rules. He will not sell the daily premium array if the daily has just posted a lower low and rejected it, because he reads that formation as a bullish breaker (2:52); the same caution applies to selling a weekly premium array after the weekly has just posted and rejected a lower low. The logic is consistent with the rest of the framework — the level is only a candidate when the higher-time-frame context supports it.
Transferring swing levels across time frames
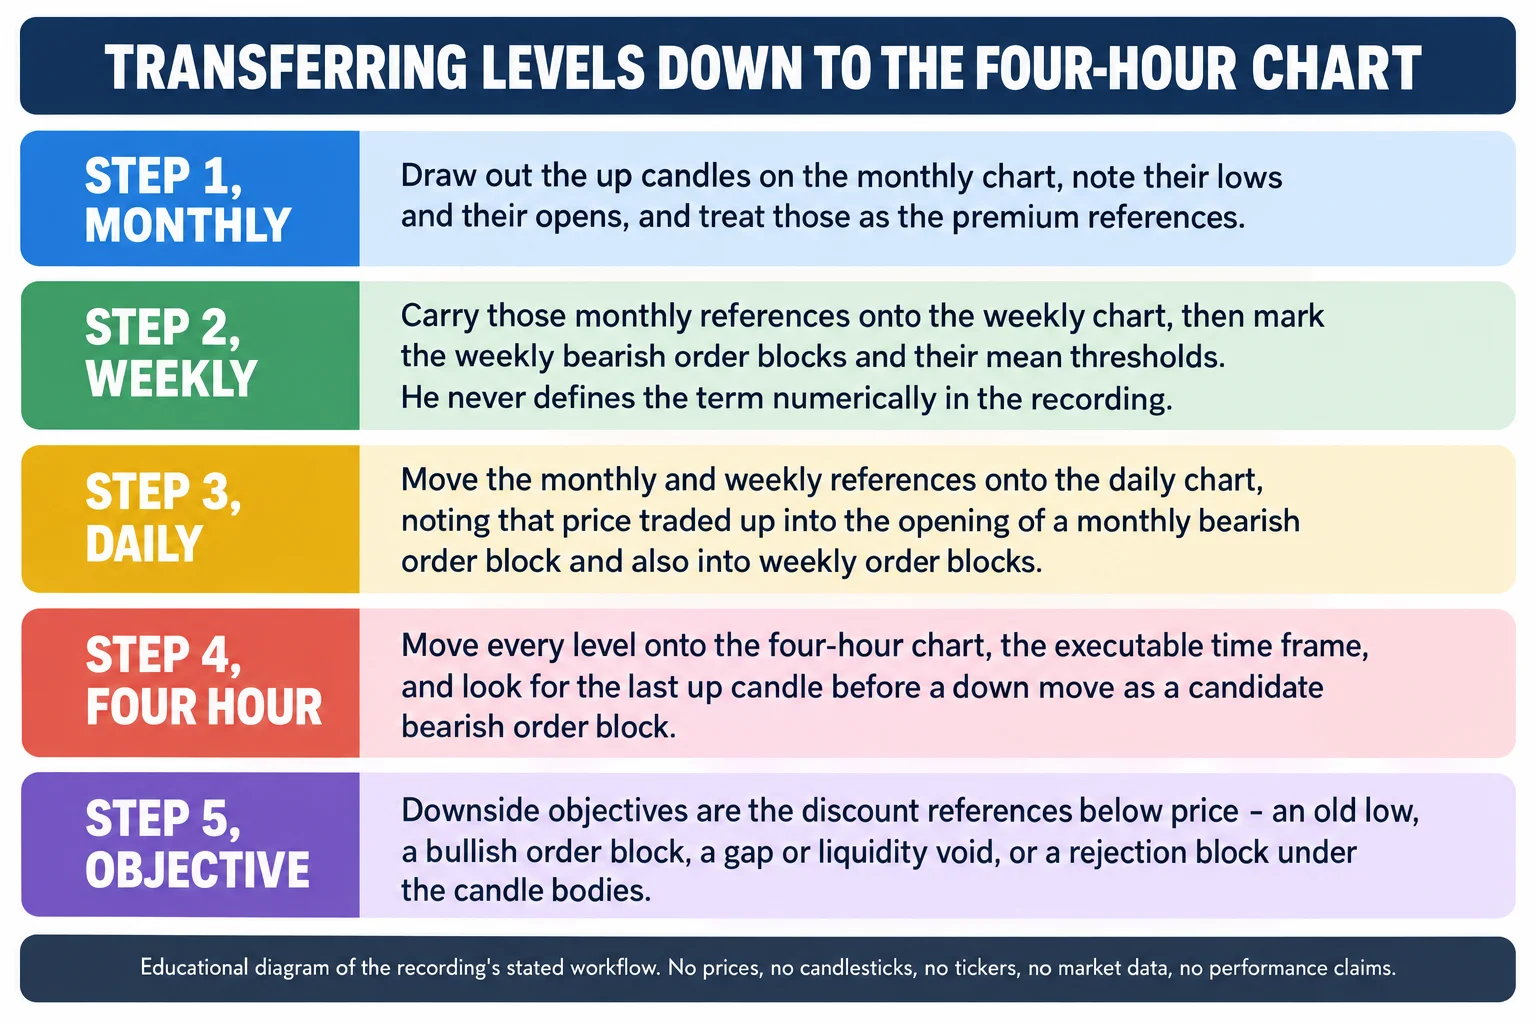
The practical demonstration starts at 3:41 on what he identifies as a euro-dollar monthly chart with 18 months of data highlighted. On that monthly view he marks out the up candles before declines, noting their lows and then their opens, which become his monthly premium references (3:41). He then drops those levels onto the weekly chart and refines them into weekly levels, drawing the weekly bearish order blocks and adding the mean thresholds of the bullish candles that preceded each down move (6:35).
The lesson uses “mean threshold” for marked levels within bullish candle bodies before a decline. In one example he combines two bodies and excludes the wicks, but he does not give a numerical formula. The recap therefore follows his level-transfer process without assigning an unstated calculation.
On the daily chart he lays the monthly and weekly references over each other and points out places where price traded up into the opening of a monthly bearish order block and then into weekly bearish order blocks, describing one instance where a monthly order block open and a weekly order block mean threshold overlapped and price reacted twice from the same level (6:35). He then moves everything to the four-hour chart, which he calls the executable time frame for this model (11:03).
One clarification he makes explicitly is that discount references serve as the downside objectives, not as the entry zone: each time price moves lower he says it is seeking a discount array — a bullish order block, a liquidity void or gap below price, a rejection block under the candle bodies, or an old low (10:31). Before starting that walkthrough he also inserts a losing example on purpose, saying that he does not want to be accused of cherry-picking (10:45).
Four-hour swing setups and failed candidates
Most of the second half is four-hour analysis. He identifies the last up candle before a down move as a candidate bearish order block, and works through the sequence methodically — marking a mitigation block where price traded back up into a small down candle, treating three consecutive up candles as one bearish order block, and using the candle with the larger body when a smaller up candle is encapsulated inside it (11:03). He also describes using an old high as a premium array and waiting for a false break above it before considering a short, and using fair value gaps between candles as further candidate selling areas (19:00).
The presentation includes failed candidates as well as favorable examples. He says outright that one marked bearish order block would have been a loss if executed (14:11), that another would have been a losing trade, that a further one would have been a stop-out, and that a short taken at one level could have stopped the trader out (18:14). He sums it up by saying there are a lot of potential entries that were profitable but a few that would have stopped a trader out and produced a losing trade if only the sell side were considered (18:14). A marked level is therefore a candidate inside his framework, not a guaranteed reversal — and the recording does not specify stops, sizing or costs that would let anyone measure the results independently.
Two quantitative asides deserve care. He notes a short example where the move to get below equal lows was 245 pips and the full range was 289 pips, describing the white shaded area as the setup (21:27); that trade ran from 13 February to 16 February 2012 and he calls it a three-day trade that paid well but did not fit his time criteria for a swing trade (21:27). Later he describes another short with a range of 536 pips, with the low forming on 1 June 2012 and the move beginning on 21 May 2012 (24:53). These are pip distances measured on historical charts he selected for teaching, not realised account results.
On holding period he says these are swing trades that could run two weeks to a month, and adds that profits have to be taken at a logical area along the way (21:27). Immediately after, he points out one example that only lasted three days, and says it did not meet the swing-trade time criterion even though it paid out well (21:27).
Swing-level convergence and stop-outs
He closes with the argument for higher-time-frame levels. Looking back at the daily chart after the four-hour work, he observes that setups become less frequent but more responsive, and that the four-hour opportunities are the ones that put a trader in sync with the higher-time-frame daily or weekly context (27:40). His stated reason for prioritising monthly and weekly levels is that they are, in his words, the biggest catalysts for big moves, and that the more levels converge around a price the more likely it is to be sensitive (28:55).
He also explains why the same higher-time-frame level can be traded to repeatedly: larger orders and larger positions are built at monthly and weekly levels, so it may take several passes into a level to fill them, and he says monthly and weekly levels can be retraded several times for that reason (29:36). That leads to an explicit risk admission — because he is not always looking for precision at a monthly or weekly level, and because there can be a layered area of levels there, a trader has to expect the possibility of being stopped out, and he warns against abandoning the whole idea of the trade and then missing the next setup (30:00).
Swing-trade study sequence
- Establish whether the monthly, weekly and daily charts agree on direction, and note which of the three conditions above therefore applies (1:42).
- Mark the premium references on the monthly chart from the up candles preceding declines, recording their lows and opens (3:41).
- Carry those levels onto the weekly chart and add the weekly bearish order blocks, noting that the recording does not define the mean threshold numerically (6:35).
- Overlay the monthly and weekly levels on the daily chart and note where they converge (6:35).
- On the four-hour chart, look for the last up candle before a down move as a candidate bearish order block, and record the ones that failed as well as the ones that worked (11:03).
- Identify the discount reference below price as the objective rather than as an entry, and log how often the objective was reached (10:31).
This checklist is an educational reading of the lesson. The recording does not specify entries, stop placement, position sizing, transaction costs, instrument selection or loss limits beyond the general warnings above, and it reports no verified results; those gaps should not be filled in from elsewhere.
The next ICT swing-trading lessons
He ends by saying this model will be built on in lessons six and seven, and that the million-dollar swing-trading model arrives in lesson eight (31:25). That is useful for placing this recording: it is an intermediate step in a sequence rather than a complete trading system on its own.
Watch the original recording
ICT Mentorship Core Content – Month 06 – High Probability Swing Trade Setups In Bear Markets
The Inner Circle Trader · published 22 September 2022 · about 31 minutes 35 seconds. This recording is the primary source for every timestamp link above.
The video owner disables playback on other websites. Use the YouTube link to watch the recording.
The Inner Circle Trader published this upload on September 22, 2022. Its description identifies the material as the original February 2017 audio and visuals; the lesson lasts about 31 minutes 35 seconds.
A note on the captions
This recap is based on the spoken lesson, using the automatic YouTube captions. The captions misrender some trading terms, including “bearish order block” and “mitigation block.” The figures above are the speaker’s descriptions of historical chart moves, not independently verified fills or returns.
Resources
The recording is the primary source for the lesson recap. The regulator and investor-education pages are general material about how trading systems offered to the public should be assessed and about the risk of short holding periods; neither evaluates this speaker, verifies any array, level, mean threshold or conditional rule described above, nor endorses anything said in the recording. Any ICT, smart-money or third-party indicator, script, note set, chart annotation, transcript pack or re-upload circulating outside the publishing channel’s own page is unofficial and has not been tested here.
- [1] ICT Mentorship Core Content – Month 06 – High Probability Swing Trade Setups In Bear Markets — The Inner Circle Trader (primary source; listed duration 1,895 seconds).
- [2] The Inner Circle Trader — official YouTube channel the publishing channel for the 2017 mentorship series used here.
- [3] CFTC — Fraud Advisory: Commodity Trading Systems Sold on the Internet the regulator’s guidance on assessing trading systems and advisory services offered to the public, including its warning that hypothetical trading results are typically simulations calculated over historical price data with the benefit of hindsight.
- [4] Investor.gov (SEC) – Day Trading investor education describing day trading as extremely risky and capable of producing substantial financial losses in a very short period.
Source: ICT, ICT Mentorship Core Content – Month 06 – High Probability Swing Trade Setups In Bear Markets, The Inner Circle Trader, 22 September 2022. Automatic YouTube captions were the transcript used for this article, and the terms the track mishears are noted above. This commentary is educational and is not investment advice.