
Key takeaways
This is lesson 7.1 of the mentorship series, and the subject is placing stop orders on the daily chart in the direction of a monthly or weekly idea (0:12).
Read the full summary
This is lesson 7.1 of the mentorship series, and the subject is placing stop orders on the daily chart in the direction of a monthly or weekly idea (0:12). The long condition has four parts: the monthly and/or weekly chart should suggest institutional order flow is seeking a PD array above daily price (0:21), the daily must post a bearish candle that has actually closed down, since the signal is not valid while the candle is still trading or forming (0:34), the buy stop goes at that bearish candle’s opening price (0:49), and he prefers the entry to be at equilibrium or below within the identified higher-timeframe range rather than in the premium (5:43). The short condition mirrors it: a monthly or weekly draw to a PD array below daily price, a completed bullish daily candle, and a sell stop at that candle’s open (5:52, 6:02, 6:11). If price never trades back through the open, there is no fill, and the procedure is to wait for the next qualifying candle rather than chase (3:04, 3:09, 3:30). He connects the technique to order-block theory (2:35, 6:57), describes taking partial profits and re-establishing that portion if price returns to the same opening price (4:45, 7:38), suggests starting with a fraction of normal size (13:31), and defers the actual stop-loss reference to a later lesson (10:20, 10:24). The source is automatic local speech-to-text of the video’s audio with no low-confidence characters flagged, not human-verified captions, and the examples are retrospective chart walkthroughs rather than documented fills or results.
How we researched this article
BestProps used document-based research from primary firm sources, checked September 17, 2026. The complete source list, scope, limitations, and commercial-state record appear near the end of this article.
What this lesson covers
He opens by naming the lesson: lesson 7.1, stop entry techniques for long-term traders (0:12). The scope is deliberately narrow and he is explicit about it. This is an entry-mechanics recording, not a complete trade plan: direction is taken from the monthly and weekly charts, execution is on the daily, and the recording’s own stop-loss discussion is deferred to a later lesson (10:20, 10:24).
One sourcing note matters for how the rest should be read. The transcript used here is an automatic speech-to-text pass over the full audio of the recording, not a human-transcribed caption track; its integrity checks passed (complete audio, no low-confidence characters flagged), but automatic transcription of this kind of material can still mishear tickers, numbers and specialised vocabulary. Where a term below looks like a plausible mishearing it is flagged rather than silently corrected, and nothing that could not be established from the words spoken was reconstructed from the charts.
The long side: buying with a stop order
He states the long condition as a sequence. First, the preferences: he is looking for setups where the monthly and/or weekly suggests institutional order flow would be seeking a PD array above daily market price (0:21, 0:27). Second, the daily chart must post a bearish candle and must close that candle with a down close — in his words it is not valid while the daily candle is trading or forming (0:34, 0:42). Third, the order itself: a buy stop placed at the bearish candle’s opening (0:49).
He walks the candle geometry out loud so there is no ambiguity about which price he means: he identifies the high of the candle, the low, the opening, and the close, and places the buy stop for the long entry at that opening price (0:57, 1:06, 1:15). The rationale he gives is that strength is what gets the trader long rather than anticipation (1:15, 1:23).
He then narrows which down candles qualify, because it is not any down candle. The down candles he wants are the ones sitting at PD arrays that would be in a discount, or appearing inside a long-term uptrend where each down candle promotes a new buying opportunity for what he calls smart money (1:28, 1:35, 1:42). The point of the technique, as he describes it, is to get in sync with those long-term trends rather than to react to a single red day (1:42, 1:47).
The higher-timeframe requirement is a real filter in his description. He says there must be a monthly and/or weekly institutional order flow reference point in the form of a PD array — naming a weekly bearish order block above daily price, or a fair value gap above daily price on the weekly or monthly chart — and preferably confirmation from both timeframes that price will be drawn up there (1:52, 2:14). Because the daily has to move against that intended direction to set the entry, the setup is inherently a counter-move into the higher-timeframe draw (2:20, 2:24).
He links the pattern directly to order-block theory. In his vocabulary a down candle is a bullish order block if price trades away from it, and trading back down into that opening is what makes it a future long entry as well (2:30, 2:45). He describes the mechanics as buying strength: the opening price should be turned and price should be trading higher from there (2:51, 3:00).
The part he stresses most about order handling is what happens when the order does not fill. If price does not trade back above the opening price there is no fill, and the instruction is to wait for another new down candle and keep moving forward, adding each new entry at that candle’s opening price and advancing one trading day with every new candle (3:04, 3:30). He accepts the consequences openly: a trader may miss moves, may not get filled, and may get filled and later be stopped out (3:35, 3:41). Stops, he says, are a conversation for trade management, and this lesson stays on the entry pattern (3:41, 3:46).
He also flags that the technique will not travel in a straight line, and turns that into a management idea. Price will trade up and then come back down to that same opening price many times, giving another opportunity to buy (4:15, 4:18, 4:26). Where new buying appears after price has moved away, that can be an opportunity to add, but he ties the addition specifically to instances where profits have already been taken (4:26, 4:30, 4:35).
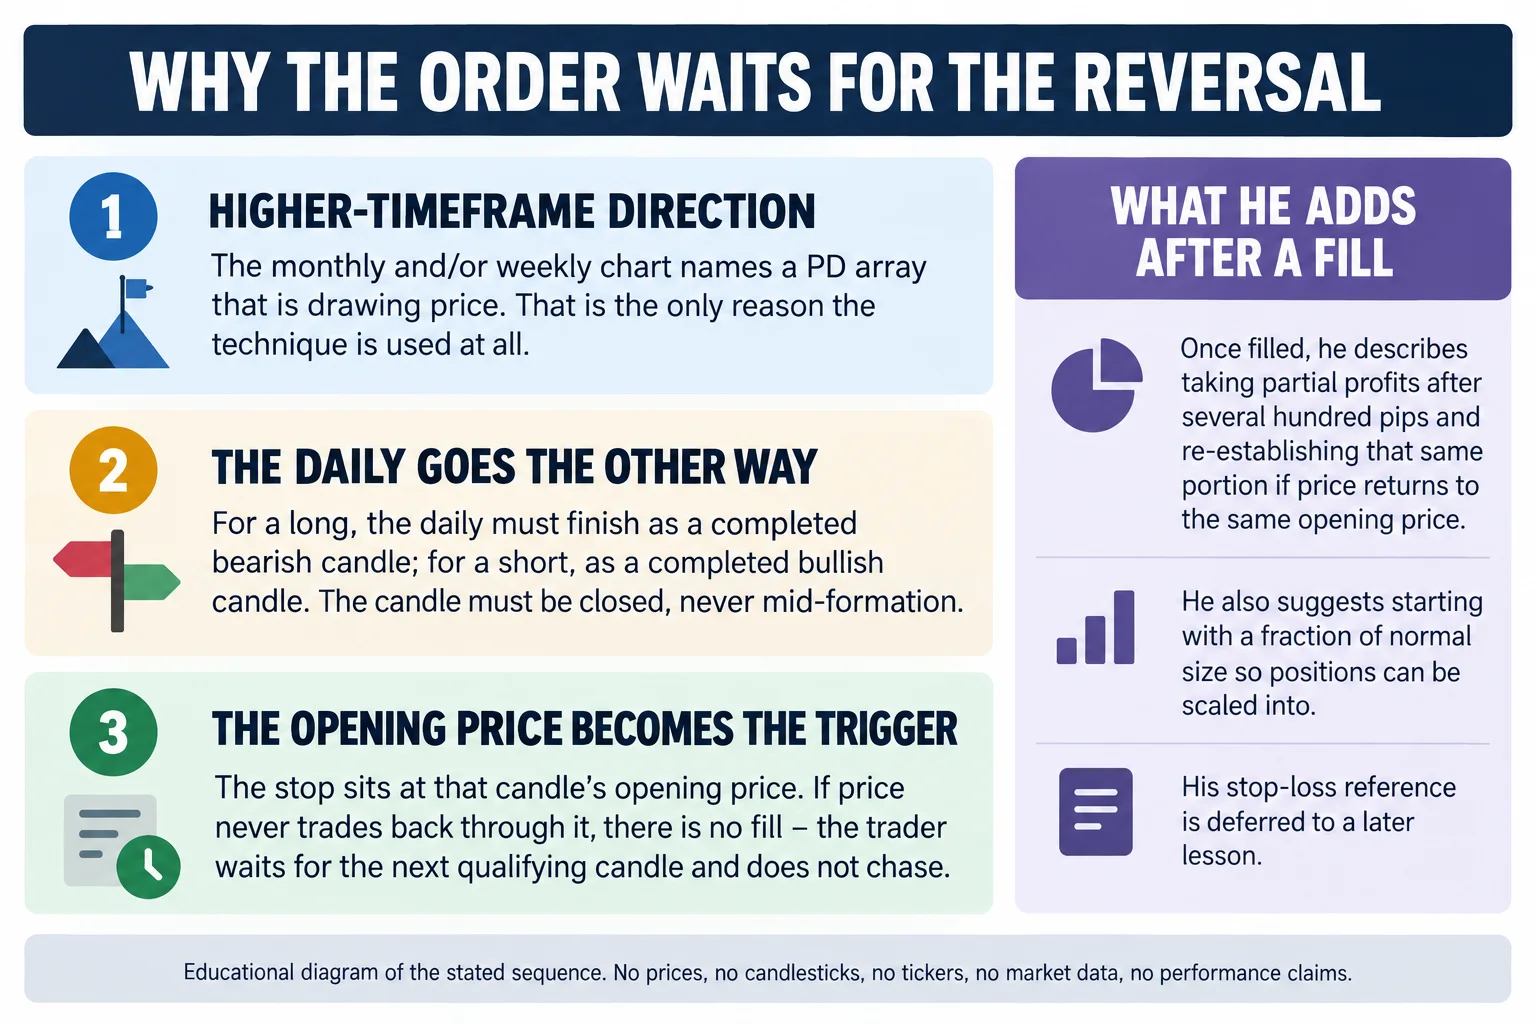
The partial-profit mechanic is stated concretely for the long side: after the buy entry has executed and the trade is several hundred pips in profit, he takes a portion of the position off, expecting that price may retrace to the same opening price; if it does, that same portion goes back on at that price (4:41, 5:01). He describes the effect as getting the same average cost for the long position as before and holding it for the remainder of the trade, and says the same sequence applies to each new down candle entered on a buy stop (5:01, 5:13).
That process continues, in his description, until price reaches the monthly and/or weekly PD array in the form of a premium market (5:13, 5:16). He treats the premium as a warning rather than a target to be forced: as price gets higher within the monthly and weekly range and closer to those premium areas, he says the down candles are less likely to promote strong buying, and he advises care and a preference for buying at equilibrium or below within the range he identified (5:16, 5:47).
The short side: selling with a stop order
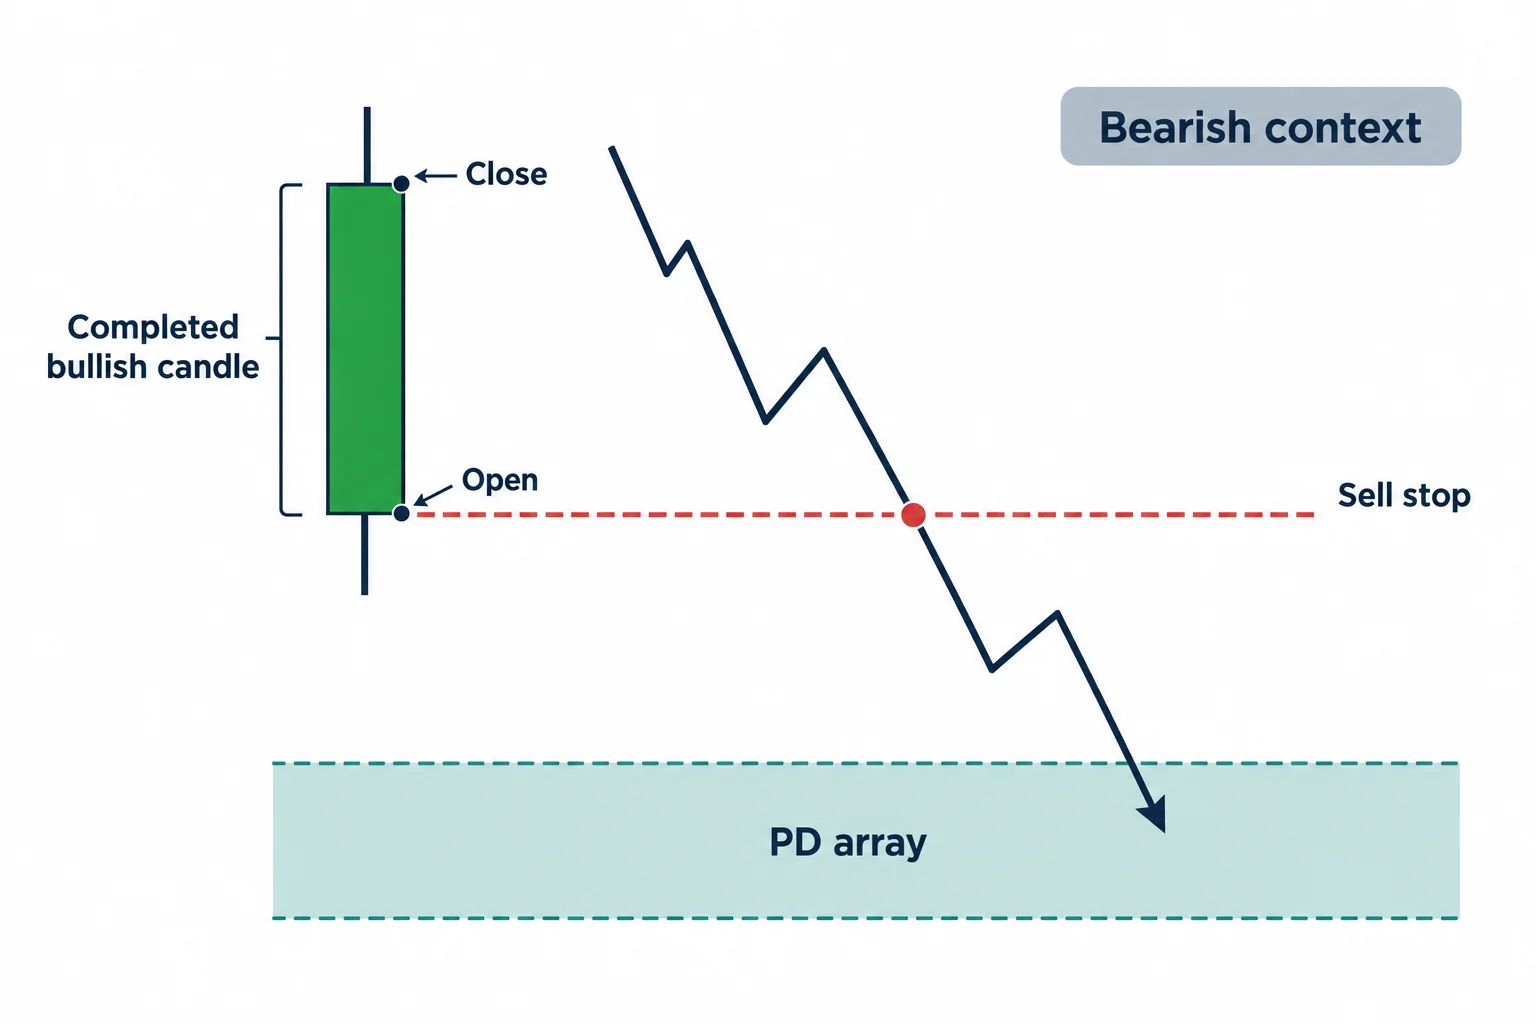
He presents the short side as the mirror image, with the same four parts. The monthly and/or weekly should suggest institutional order flow will be seeking a PD array below daily market price (5:52, 5:57); the daily should post a bullish candle and must close it with an up close, and again it is not valid while that daily candle is still trading or forming (6:02, 6:07, 6:11); and the sell stop is placed at that bullish candle’s open (6:11, 6:17). He reads out the same geometry — high, low, close, open — and marks the open as the sell-stop location for a short entry (6:17, 6:27, 6:32).
His premise is that weakness carries the trader into the short rather than the appearance of an up candle by itself (6:32, 6:36). He ties the two sides together explicitly: buying a stop on a down candle at its opening price is like returning to a bullish order block, and selling a stop at the opening price of the last up candle before a down move is the entry technique for a bearish order block (6:41, 6:57). Once in profit on the short, he describes the same partial-profit loop: bank a portion after several hundred pips, and if price retraces to that same opening price, re-establish the same portion at that average price while the monthly and weekly premise still points lower (7:02, 7:51).
He restates the timeframe split that makes the pattern coherent: the analysis and bias come from the monthly and weekly chart, but execution is on the daily, and the trader is specifically waiting for a move that is opposite the intended direction in the form of that completed up candle before the short is triggered (7:55, 8:12). He adds an observation he says is common: when the opening price on that up candle is traded to repeatedly and price never turns back from the low, that opening price becomes a good trigger for a sell program (8:16, 8:29).
The examples he walks through
The first walkthrough is the long side on a daily chart (8:34). He points at a small down candle, sets a hypothetical buy stop at its opening price, and then says it did not fill — a missed opportunity, which is exactly the outcome he had already described in the rules (8:43, 8:49, 8:58). The next down candle supplies a new reference, and he notes that the following bullish candle opened below that down candle’s open, so the buy stop would have triggered as price traded up through it (9:02, 9:25).
From there the example becomes a sequence of successive down candles, and he walks each one as another potential long triggered at its opening price, including three down candles in a row where each candle is a new opportunity to be net long (9:31, 10:04). He notes that in the middle of those three a trader may already have been tripped into a long (10:04, 10:14). This is also where the risk side of the discussion is deliberately cut short: he says the stop loss would sit below the most recently created swing low on the daily chart and below a specific reference point that he will outline in lesson 8 (10:14, 10:20, 10:24). He then continues the example, using further opening prices as triggers and additions, and one lower candle whose opening price gets tripped two candles later (10:31, 11:01).
The second walkthrough switches to the short side on the Japanese yen (11:06, 11:14). He describes an old high from 2007, price piercing a level he speaks as 123.50 and rejecting, then a break in market structure and a sell-off; he says the shaded area holds an initial market structure break and a secondary one that the example focuses on (11:21, 11:37). From there he frames the daily as getting in sync with lower monthly and weekly objectives for dollar-yen, and with the PD arrays that would draw price lower on the daily (11:45, 12:02).
He says he mapped every up candle that traded back into the premium of the daily ranges price was working in, and walks five examples where each up candle triggered a short a short time after it formed once its opening price was crossed (12:02, 12:19). A further example has price trading back up into a mitigation block, with the up candle’s opening price as the short trigger and the very next candle leaving the trade short, which he then shows again on a higher-timeframe view (12:26, 12:47). He characterises the results in that illustration as several hundred pips in places and over a thousand pips of downside potential in the last one, and attributes the whole reading to monthly and weekly PD arrays supplying the directional bias while the daily candles supply the triggers (12:47, 13:07).
Two things are worth separating about those example figures. They are his retrospective narration over historical charts: the recording shows no order tickets, no account, no fill prices and no realised result, so the pip counts are his description of the illustrated moves rather than a documented performance record. And the charts themselves were not available to this review, which worked from the timestamped transcript of the audio only, so the level and candle descriptions above are his spoken account rather than independently reconstructed chart data.
The yen example also sets up the point he ends on: many of those candles that were shorted on a stop later turn into bearish order blocks when price returns to them, which he says allows more position to be added and larger positions to be built (13:16, 13:26). The size advice attached to it is to start with a small allocation — he suggests a half position or half of normal size — so that additions are funded by portions already taken in profit rather than by new risk (13:26, 13:43).
Key takeaway
Stripped of the vocabulary, the technique is a conditional-entry process: form a directional thesis on the monthly and weekly charts, wait for a completed daily candle that moves against it, and put a stop order at that candle’s opening price so the entry only activates if price reverses through it (0:34, 6:11). The discipline sits in what happens when the condition fails: no fill means no trade, and the reference simply rolls forward to the next qualifying candle (3:04, 3:09, 3:30).
What the lesson does not settle is left open deliberately. The stop-loss reference is deferred to a later lesson (10:20, 10:24); the examples are historical chart walkthroughs rather than trades with a documented order ticket (11:14, 12:52); and the pip figures are his retrospective descriptions of chart moves. He closes by signing off until the next lesson (13:49). Nothing above is a recommendation to copy a trade, a size or an order placement, and it is not investment advice.
Watch the original recording
ICT Mentorship Core Content – Month 05 – Stop Entry Techniques For Long Term Traders
The Inner Circle Trader · published 17 September 2022 · about 13 minutes 54 seconds. This recording is the primary source for every timestamp link above.
The recording is not embedded here because the video owner has disabled playback on other websites. That was tested directly on 15 September 2026 from a BestProps page origin at both desktop and mobile widths: the embedded player frame loads, then reports “Playback on other websites has been disabled by the video owner” with no duration and no playback progress, while the video itself plays normally on YouTube. No empty or half-working player is left on this page.
The watch page was read on 15 September 2026 and is publicly listed as ICT Mentorship Core Content – Month 05 – Stop Entry Techniques For Long Term Traders by The Inner Circle Trader: upload date 17 September 2022, not private and not unlisted, with the player reporting a duration of 834 seconds — about 13 minutes 54 seconds. The audio used for this article runs to 833.2 seconds, so the transcription and the listed duration agree. The recording identifies itself in its opening seconds as lesson 7.1, which is the lesson number used in the text above (0:12).
Resources
These are the sources checked for this article. The regulator and investor-education pages are general material about what stop and market orders involve, and about how trading systems and advisory services sold to the public should be assessed; neither one evaluates this speaker and neither verifies any PD array reading, order-block mapping, pip figure, example or scaling suggestion described above. Any ICT, smart-money or third-party indicator, script, note set, chart annotation, transcript pack or re-upload circulating outside the publishing channel’s own page is unofficial and has not been tested here.
- [1] ICT Mentorship Core Content – Month 05 – Stop Entry Techniques For Long Term Traders — The Inner Circle Trader (primary source; watch page read 15 September 2026, listed duration 834 seconds, about 139,000 views at the time of reading).
- [2] The Inner Circle Trader — official YouTube channel (read 15 September 2026) — the publishing channel for the 2017 mentorship series used here.
- [3] CFTC — Fraud Advisory: Commodity Trading Systems Sold on the Internet (read 15 September 2026) — the regulator’s guidance on assessing trading systems and advisory services sold to the public, including its warning that hypothetical results are typically simulations calculated over past prices.
- [4] Investor.gov (SEC) — Day Trading (read 15 September 2026) — investor education on short-term trading risk, relevant background to the conditional-entry and partial-profit management described above.
Source: ICT, ICT Mentorship Core Content – Month 05 – Stop Entry Techniques For Long Term Traders, The Inner Circle Trader, 17 September 2022. The transcript used was automatic local speech-to-text of the recording’s full audio (Whisper large-v3-turbo), not human-verified captions; the integrity checks passed with no low-confidence characters flagged, and any term that looked like a mishearing is flagged above rather than silently corrected. No price, level, order, fill, position size or result has been invented anywhere above. This commentary is educational and is not investment advice or a recommendation to copy any trade or order placement.