
Key takeaways
This is lesson 2.2 of the January 2017 ICT Mentorship, and it is about qualifying trades with the 10-year Treasury yields (0:12, 0:18).
Read the full summary
This is lesson 2.2 of the January 2017 ICT Mentorship, and it is about qualifying trades with the 10-year Treasury yields (0:12, 0:18). He starts from the seasonal tendency covered in the previous lesson – the 10-year note’s tendency to rally in June, illustrated on the September 2015 contract (0:24, 0:32) – and then tests it against the Dollar Index. The rule he states is one of mirror symmetry: lower lows in note futures should be paired with higher highs in the Dollar Index, and higher highs in the note with lower lows in the dollar (1:35, 1:41). When that symmetry does not appear he calls it a crack in correlation, and treats it as a qualifying condition rather than an entry signal (2:08, 3:49). He walks three episodes: June 2015, where the note made lower lows and the dollar lower highs instead of higher highs (1:26, 2:00); June 2016, where roughly equal lows in the note coincided with higher highs in the dollar (3:14, 3:26); and late 2016 on the March 2017 contract, where a lower high in the note ran against a lower low in the dollar (4:26, 5:10). In each case he adds the yield direction as support and places the idea inside the quarterly-shift framework on a roughly three-month horizon (4:03, 7:21). He says the pattern can also be qualified with an intraday structure or a currency-pair divergence against the Dollar Index, that one form of confirmation is enough, and that the alignment puts the odds in a trader’s favour without removing the possibility of loss (8:27, 8:35, 9:26). Everything below is his own reading of selected past charts; the recording measures nothing.
How we researched this article
BestProps used document-based research from primary firm sources, checked September 24, 2026. The complete source list, scope, limitations, and commercial-state record appear near the end of this article.
In ICT Mentorship Core Content – Month 05 – Qualifying Trade Conditions With 10 Year Yields, the speaker sets out how he uses the relationship between 10-year Treasury-note futures, the U.S. Dollar Index and the 10-year yield to decide whether a higher-time-frame trade idea is worth taking seriously. This article follows the recording in order and links each point to the passage it comes from.
Two limits apply throughout. The episodes he works through are charts he is describing from memory and from his own annotations, so the article reports his readings rather than verified swing counts, prices or fills; nothing here is a data-backed backtest. And the transcript is an automatic speech-to-text rendering of the audio rather than a human-checked caption track, so the renderings that are genuinely ambiguous are flagged near the end instead of being silently corrected.
Where the lesson sits
He introduces the session as lesson 2.2 of the January 2017 mentorship, with the stated subject being qualifying trade conditions with the 10-year yields (0:12, 0:18). The starting point is the lesson before it: a seasonal tendency in the 10-year note to rally in June, which he had examined on the September 2015 contract, and which he says did produce a low in June 2015 (0:24, 0:37). His question for this session is how a trader knows the seasonal tendency is actually going to express itself (0:46).
That distinction matters for reading the rest of the lesson. Seasonality supplies a hypothesis about direction; the intermarket comparison is what he uses to decide whether the hypothesis is being confirmed or contradicted.
The symmetry rule he states
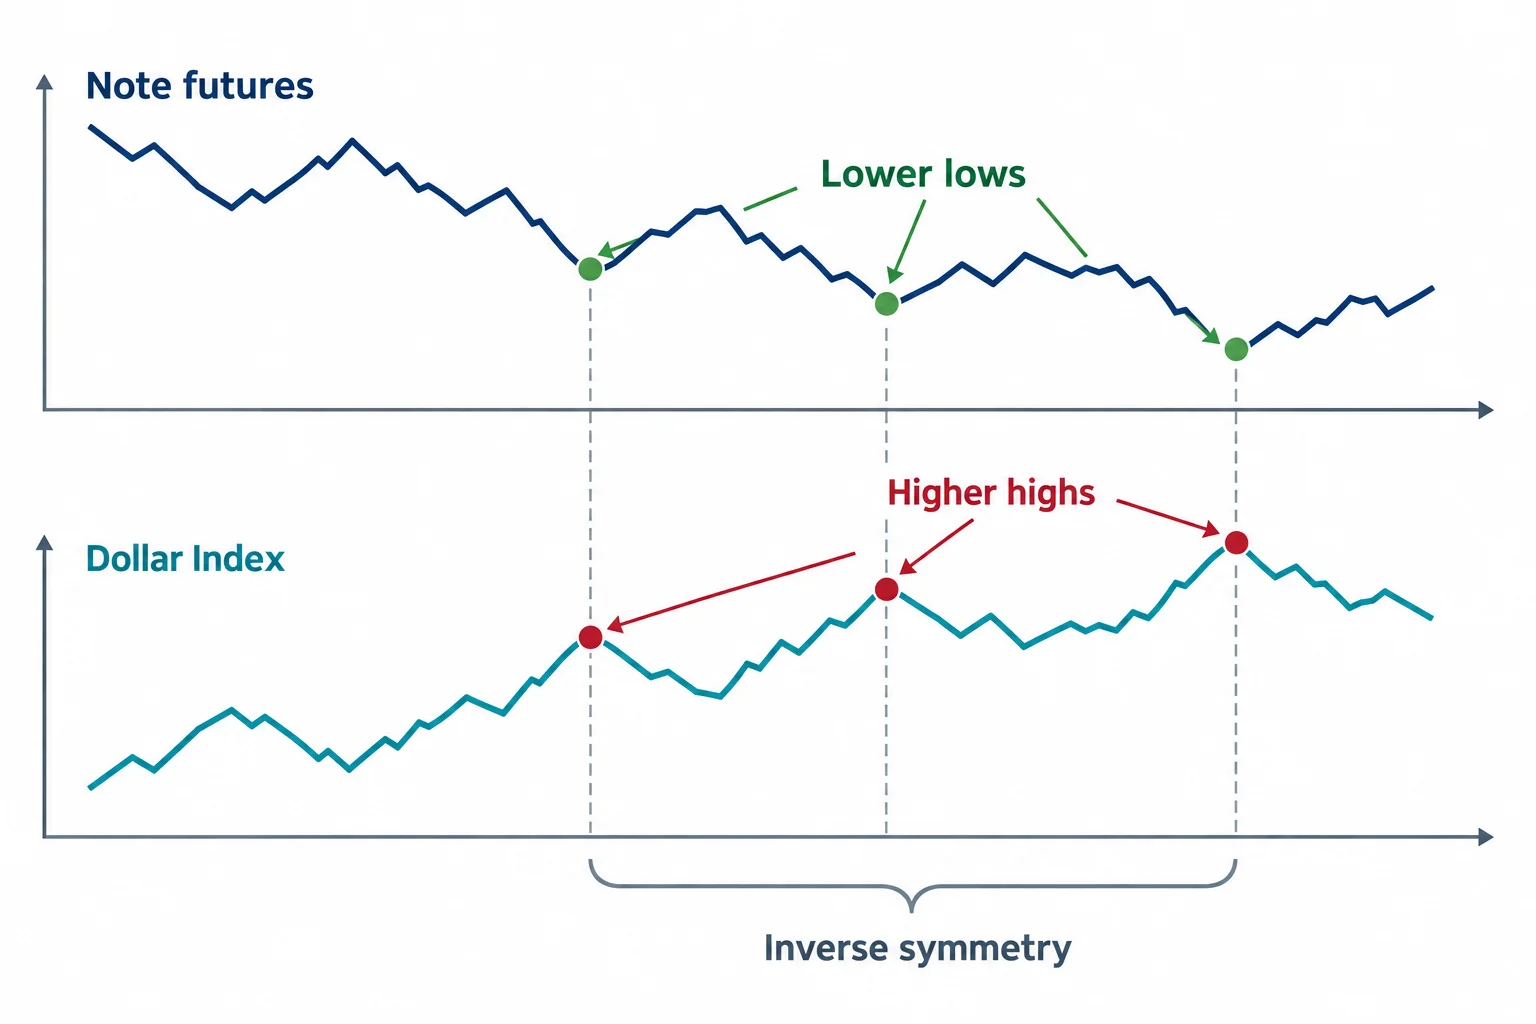
His first step is to qualify the swings against the Dollar Index (0:55). The expected relationship is mirror-like: a run of lower lows in note futures should be accompanied by a series of higher highs in the Dollar Index, which he describes as how market symmetry should be posted and delivered in price (1:35, 1:41). Read the other way round, a lower low in the Dollar Index should coincide with a higher high in the note (5:23).
When the mirror fails he draws a specific conclusion. He describes the market as a mirror image of everything seen for perfect symmetry, and says that when that symmetry is broken it indicates an underlying trend or manipulation is underway (5:45, 5:49). The word qualifying is doing real work here: a divergence of this kind is a reason to look further, not a reason to place an order.
June 2015: lower lows in the note against lower highs in the dollar
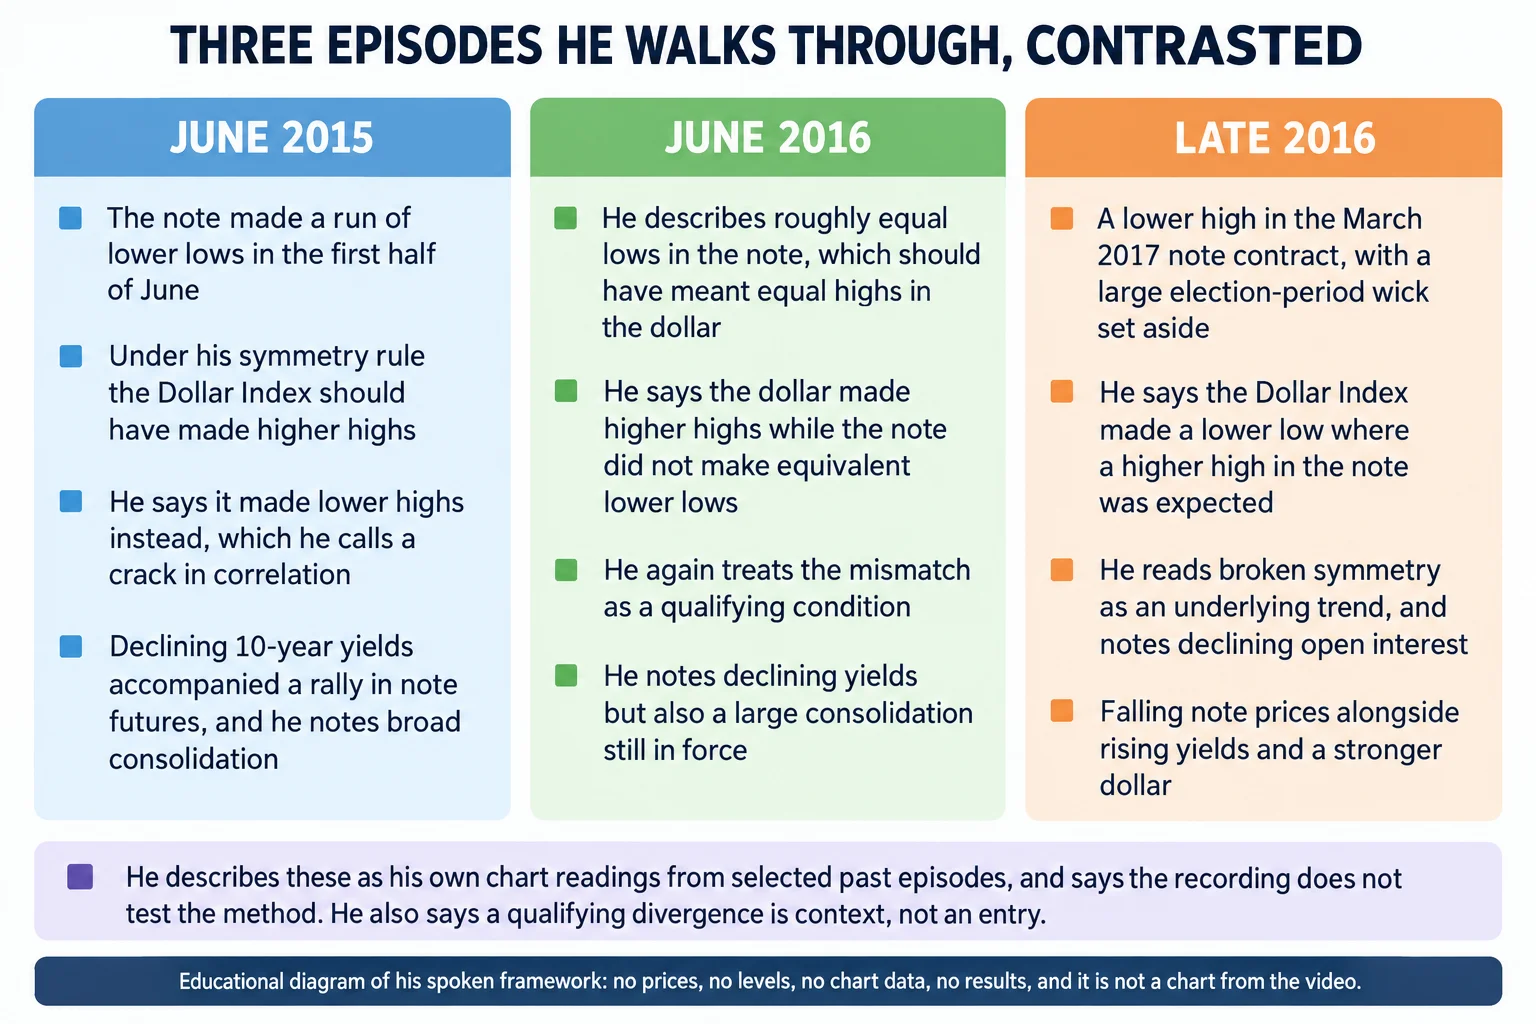
The first worked episode begins with his delineation at the start of June 2015 (1:05). He says price slid, took out the May low, and then produced what he counts as five to six successive candles making lower lows through the first half of June (1:15, 1:24). Those lower lows are the note-side half of the pattern.
The Dollar Index half is where the expectation fails. He looks at what the dollar actually did over the same period and says that from the first trading day after 1 June it was making lower highs (1:47, 2:00). Under his symmetry rule the dollar should have been making higher highs. He calls the disagreement a crack in correlation, and says it amounts to confirmation that a trade idea is unfolding in the 10-year note against the Dollar Index (2:08).
The yield is the third leg. He says the interest rate market was declining at the same time, and that as the yield declined the 10-year note futures price was rallying (2:24, 2:37). That is the ordinary inverse relationship between a bond’s price and its yield, and he uses it as corroboration rather than as a separate signal.
He also observes that the yield’s consolidation ran alongside a consolidation in the Dollar Index, the 10-year Treasury and foreign currencies over the same stretch of 2015 (2:43, 2:48, 2:52). He offers that as the context the currency consolidation should be read in, not as a measured correlation.
June 2016: equal lows in the note against higher highs in the dollar
The second episode is June 2016, and he again frames it as the same seasonal tendency being tested (3:02, 3:12). This time he says the note was making equal lows, which under his symmetry model should have been seen against equal highs in the Dollar Index (3:14, 3:20). Instead, he says the dollar made higher highs (3:26).
He calls it a crack in correlation for the second time and spells out why: the market showed a willingness to go higher in the Dollar Index, and that willingness was not seen in the form of going lower in the 10-year note (3:42). His conclusion is that it is therefore a qualifying condition that an underlying trade is underway (3:49). He adds the same yield check – a visible decline in the 10-year yields – as further confirmation (4:03).
His own caution on this episode is about zoom level. A tight look could make the move read as an uptrend, he says, while the market was still inside a rather large consolidation, which he offers as part of why the currency markets were consolidating over that period (4:14, 4:14).
Late 2016: a lower high in the note against a lower low in the dollar
The third episode uses the 10-year Treasury note March 2017 contract and turns on a lower high (4:26). He acknowledges the large wick around the election and asks the viewer to set it aside and read market structure alone: he identifies a lower high in the first couple of days of November relative to the mid-October highs (4:43, 4:54).
Then he works the mirror. He says the Dollar Index made a lower low, and that for the dollar to make a lower low the note should have produced a higher high – which, he says, did not happen (5:10, 5:33). Broken symmetry, in his framework, points to an underlying trend or manipulation being underway (5:56).
He supports the reading with open interest. He says open interest declined in November and describes that as covering by the smart money, with the Dollar Index moving up as a result (5:56, 6:03). Two things should be kept apart there. Declining open interest alongside a rising price is a fact a trader can check in the exchange data; the attribution of that activity to a particular class of participant is the speaker’s interpretation, and the recording does not evidence it. He also adds that the note was in a trending move with more range left to travel lower, which he says supported the dollar’s trending move over two complete months (6:12, 6:23).
The yield is the closing link in this episode, and it is also where he states a general principle. He says the increase in the 10-year yield accompanied the dollar’s rally, and gives the reasoning as markets seeking yield: if the interest rate is increasing, the dollar has a strong tendency to rally as well (6:35, 6:41). He presents that as his market interpretation. It is not a one-variable rule, and the recording offers no test of it.
Blending it with the quarterly shift, and the three-month horizon
He notes as a side point that these readings should be blended with the quarterly-shift concepts taught elsewhere in the month’s content rather than used on their own (6:50). The horizon he attaches to that is explicit: he is looking for the next potential swing three to four months out, with the trade setups generally completing in about half that time (6:55, 7:08). He adds that trades sometimes run the full three months or a little longer (7:17), and states his own working horizon as about three months (7:21).
The reason he gives for the short horizon is risk management rather than impatience. Long-term trends can reverse, he says, and in a long-term uptrend he does not want to be attempting to pick the top (7:28, 7:40). He repeats that his expectation is a position lasting up to three months, and that in practice he rarely holds that long – usually about half the time frame (7:58).
Two optional ways to confirm the same divergence
He then gives the trader two ways to qualify the same idea. The first is to look for the divergence when the seasonals align and a qualifying SMT divergence appears between the Dollar Index and the 10-year note, and to qualify that further with an intraday structure (8:10, 8:20). The second is to drop into a forex currency pair and look for an SMT divergence against the Dollar Index there (8:27). His point about combining them is permissive rather than additive: both are not required, and either one gives a qualification for a trade idea that may be unfolding as a quarterly shift (8:35).
What he says the alignment is for is worth quoting precisely. He frames it as getting in sync with the marketplace and viewing the higher-time-frame charts with these tools in alignment, which he says gives trades high probability and filters out a lot of noise (8:52, 8:56). He extends the claim beyond long-term position trading: even a trader who does not operate in that capacity can use the ideas to get in sync with higher-time-frame trend or order flow, which he says puts swing trades, short-term trades, day trades and scalps in line with institutional order flow (9:01, 9:12, 9:17).
He closes on the limits of his own claim, and this is the sentence the rest of the lesson has to be read with. He says the alignment is very hard to go wrong with, immediately qualifies that it is not perfect, states plainly that it does not negate the opportunity to lose money, and finishes by saying it puts the odds in your favour (9:17, 9:22).
What this article is not claiming
No episode in this lesson is presented as verified. The speaker describes charts from 2015 and 2016 from memory and from his own annotations; the article reports his swing readings, his causal interpretations and his conclusions, and does not treat them as measured facts. The recording contains no test of the symmetry rule, no sample size, no win rate and no account result, and it does not supply an entry, a stop, a position size or an exit. The open-interest attribution to smart-money covering, and the claim that rising yields pull the dollar higher, are his interpretations rather than verified relationships. Nothing here is trading advice, and the article does not recommend trading the pattern.
Date and identity note
The publishing channel lists this video as uploaded on 13 September 2022, while the recording identifies itself as lesson 2.2 of the January 2017 mentorship and discusses charts from 2015 and 2016. Those are three different calendar references – a 2022 upload of a 2017 teaching about 2015 and 2016 markets – and they do not contradict one another. The upload date is not treated here as the date the content was taught, and the chart periods are reported as the speaker labels them.
A note on the transcript
This article was written from an automatic speech-to-text transcript of the video’s own audio rather than a human-checked caption track, so every timestamp link above resolves to a machine-timed segment. The renderings that matter are flagged here rather than silently corrected. The transcript repeatedly writes “10-year node” where the context makes clear that “10-year note” is meant (0:24), and it renders “intraday” as “intratray” in the phrase about a structure used for additional confirmation (8:20); both are normalised in the prose above and named as renderings here. The instruction to “focus on the market structure alone without that wick” (4:49) comes through intact, as does the qualification about losing money. No price level, swing high, swing low or order fill is asserted anywhere in this article as a verified value, because the source is audio-only and contains no visual verification of the charts being described.
Watch the original recording
ICT Mentorship Core Content – Month 05 – Qualifying Trade Conditions With 10 Year Yields
The Inner Circle Trader · published to YouTube on 13 September 2022 · listed at 571 seconds, about 9 minutes 31 seconds. The recording identifies itself as lesson 2.2 of the January 2017 mentorship. This video is the primary source for every timestamp link above.
The recording is not embedded here because the video owner has disabled playback on other websites. That was tested directly on 15 September 2026 from a BestProps page origin at both desktop and mobile widths: the embedded player loads and then reports “Playback on other websites has been disabled by the video owner”, with no playable stream and no duration reported in either case. The link above opens the recording on YouTube itself.
Resources
These are the sources checked for this article. The Treasury rates page is the government publication for the 10-year yield series the lesson uses as confirmation, and the exchange page is the primary specification for the Dollar Index futures contract, which is the other half of its symmetry pair. None of them assesses the speaker, tests the symmetry framework or endorses anything said in the recording. Any ICT, smart-money or third-party indicator, script, note set, transcript pack or re-upload circulating outside the publishing channel’s own page is unofficial and untested here.
- [1] ICT Mentorship Core Content – Month 05 – Qualifying Trade Conditions With 10 Year Yields — The Inner Circle Trader (primary source; watch page and metadata read 15 September 2026, listed at 571 seconds).
- [2] The Inner Circle Trader — official YouTube channel (read 15 September 2026) — the publishing channel for the ICT mentorship series this lesson belongs to.
- [3] U.S. Department of the Treasury — Daily Treasury Rates (read 15 September 2026) — the government’s published daily Treasury yield curve, which is the source for the 10-year yield series the lesson uses as confirmation. General reference; it contains none of the lesson’s charts or readings.
- [4] ICE Futures U.S. — US Dollar Index Futures contract specification (read 15 September 2026) — the exchange’s own specification for the USDX futures contract, which is the second half of the lesson’s symmetry pair. Background on what that futures price represents.
Source: ICT, ICT Mentorship Core Content – Month 05 – Qualifying Trade Conditions With 10 Year Yields, The Inner Circle Trader, published 13 September 2022; the recording identifies itself as lesson 2.2 of the January 2017 mentorship and discusses 2015 and 2016 charts. Transcript SHA-256