
Key takeaways
ICT lesson 1.2 defines open float as presumed pending interest above and below market price, split into buy stops entering longs, buy stops protecting shorts, sell stops entering shorts and sell stops protecting longs, while providing no visible order-book data, test or performance result.
Read the full summary
ICT lesson 1.2 defines open float as presumed pending interest above and below market price, split into buy stops entering longs, buy stops protecting shorts, sell stops entering shorts and sell stops protecting longs, while providing no visible order-book data, test or performance result. The framework maps buy-side liquidity above the last bearish shift, weekly or monthly highs and three-month, six-month and twelve-month highs, with mirrored sell-side liquidity below the last bullish shift and corresponding lows. ICT prioritizes each quarter’s highest high and lowest low, claiming significant liquidity runs occur every three months. Direction is inferred by comparing which side makes new ground rather than treating a stop run as a standalone signal. Repeatedly lower short-term and intermediate-term lows alongside rallies that fail to make higher highs indicate a draw toward sell-side liquidity, with the inverse implying buy-side interest. The walkthrough describes a move from 105.34 to about 115.70 over roughly six months, followed by failed rallies near 114 and 112.95 and repeated downside extensions, while defining an intermediate-term high as a high with short-term highs on both sides and a long-term high as the center intermediate-term high flanked by lower intermediate-term highs. ICT applies the daily-chart bias to day trading, scalping, short-term trading and swing trading, but acknowledges that these patterns are easier to identify in hindsight and offer little turnaround time.
How we researched this article
BestProps used document-based research from primary firm sources, checked September 24, 2026. The complete source list, scope, limitations, and commercial-state record appear near the end of this article.
What ICT Open Float Means
He gives the definition in his own words early on: open float is the current open interest above and below current market price (1:12). He then says that interest takes the form of pending buy orders (buy stops resting above old highs, or simply above market price, since he notes it does not have to be an old high) and sell orders that can sit below market price by only a small distance or below significant lows (1:19, 1:31).
He breaks that interest into four categories, and the distinction between entering and protecting matters for how he reads them later:
- Buy stops used to enter a long position, above the market.
- Buy stops protecting an existing short position (1:52).
- Sell stops used to enter a short position, below the market.
- Sell stops protecting an existing long position (1:45).
He calls the sum of all of it the total open interest of the players who are either in the market now or hope to be, depending on where price goes relative to those standing orders (1:58). Two things are worth separating here. The first is that an order book is not visible on a price chart, so the four categories are his model of what is likely to be sitting at a level rather than a measurement of what is actually there. The second is that he states the model, not a set of confirmed positions; nothing in the recording shows resting order data.
ICT Open Float Buy-Side and Sell-Side Levels
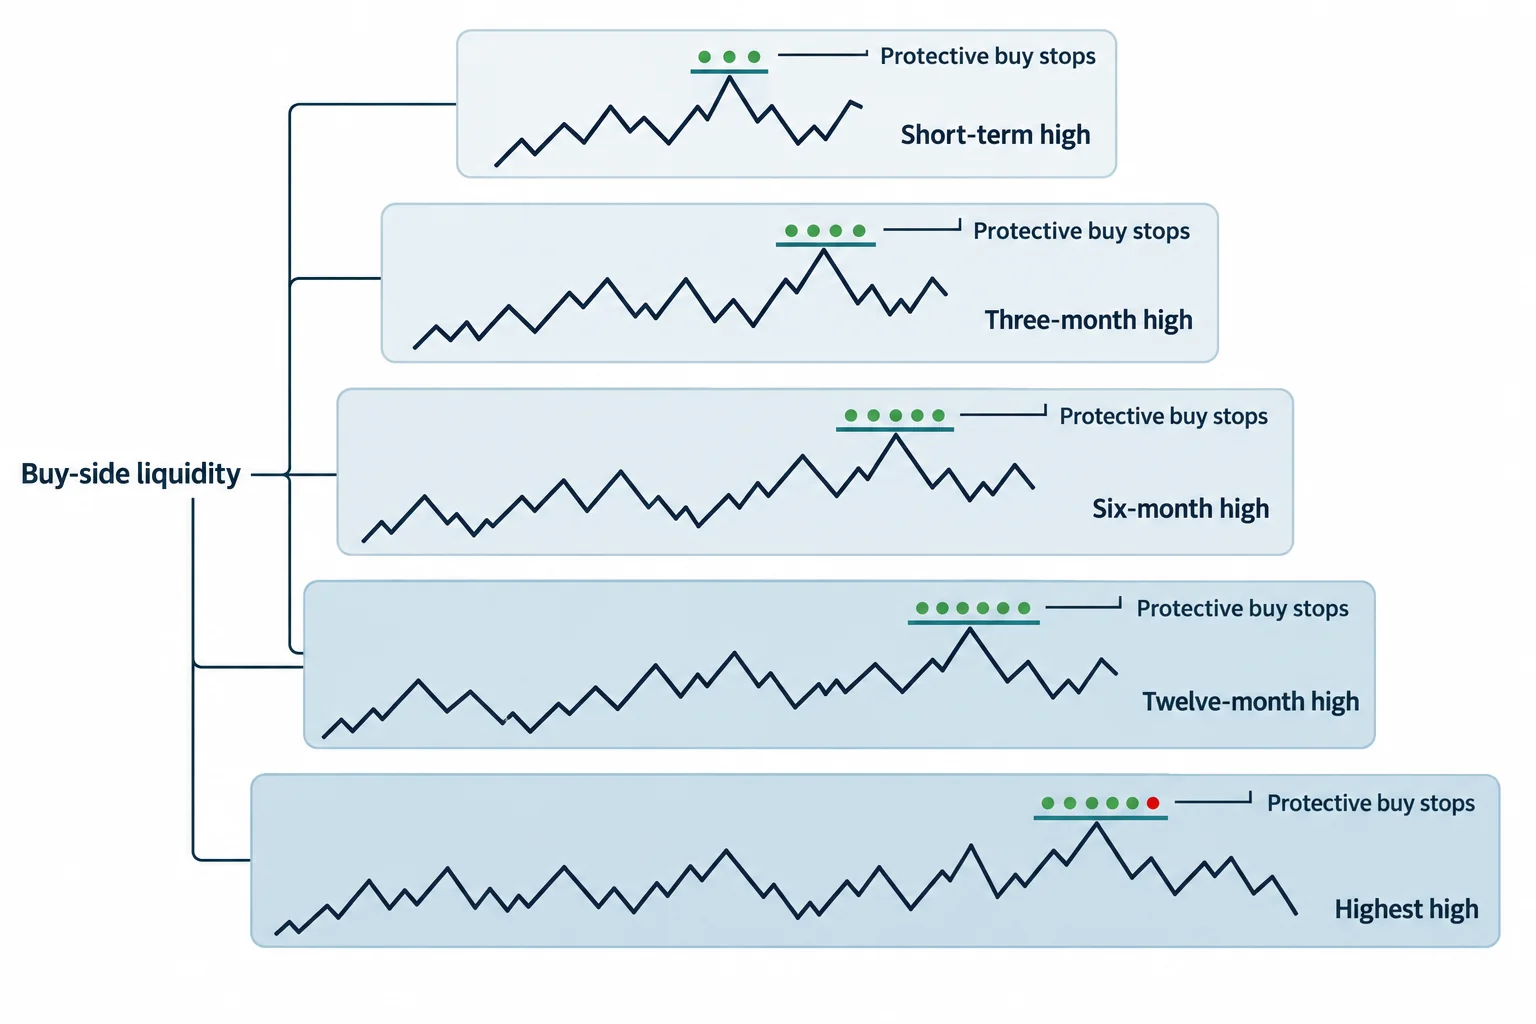
He starts with buy side liquidity and lists the highs in ascending order of how much he says the stops above them matter (2:18):
- Shorts using protective buy stops above the last bearish shift (2:25).
- Buy stops above short-term highs, which for him can take the form of a weekly high or a monthly high (2:32, 2:34).
- Buy stops above the highest high in the last three months (2:42).
- Buy stops above the current six-month high (2:47).
- Buy stops above the current twelve-month high (2:52).
He anticipates the objection to the longer windows: a market can sit near a twelve-month high or low for a long stretch without ever reaching it, so he tells the listener not to be discouraged by the numbers (2:55). He describes his own early error as expecting twelve months to be needed to get back to a level, then says how quickly a twelve-month high or low can actually be reached depends on the range in that market. This is where he narrows the lesson’s focus: the three-month high is the reference he says matters most, because it pairs with the quarterly shift and is the level where he expects the largest concentration of resting buy stops (3:51, 3:57).
The sell side is given as the mirror image at 4:39: longs using protective sell stops under the last bullish shift, sell stops below short-term lows in the form of a weekly or monthly low, sell stops below the lowest low of the last three months, and then the current six-month and twelve-month lows (4:45, 4:53, 5:01, 5:12).
Why ICT Open Float Focuses on Three-Month Levels
The lesson is framed as quarterly shift with open float, and he says the connection is direct: every three months there is a significant run on liquidity, so each three-month interval should be marked off and its high and low noted (9:31, 4:09). He adds that any run on the buy stops above a short-term high (his examples are weekly and monthly highs) gives him what he calls strong prognostication for short-term volatility (4:22).
He also explains the chart he is using: it lays out the same quarterly reference points, with most vertical lines removed and short segments used instead to mark where each interval falls (6:27). Before walking through it he asks the listener to pause the recording and note significant price highs and lows, which is an instruction to do the annotation rather than to accept his reading (6:52).
The Key ICT Open Float Question
He says the question he gets most often, including by email, is how to know whether the market will stop just above an old high or just below an old low and reverse, or keep going. This covers the language he uses for it: running stops, turtle soup, false breaks above an old high or below an old low (5:21, 5:40). His stated aim is to give the listener the ideas that produce his own conviction that price will punch through a level and probably not continue far, then retrace, and he says the same logic applies in reverse when an old low has been violated (5:54).
The answer he builds is not about the penetration itself. He points out that two significant runs are visible on the chart, one above an old high and one below an old low, and then directs attention to a particular short-term low: when price traded below it, he calls that a break in market structure, and he says the market continued trading down to a level he reads as 105.30 (7:24, 7:34, 7:38, 7:45). He repeats the level as 105.34 later in the walkthrough, so the two readings are noted here rather than merged. The recording's spoken digits are the only record of it and the transcription renders them automatically (9:19).
His rule for where to look after a shift is explicit: when there is a bearish shift lower, your eyes go right to the high price just came from, because on a daily chart there is a lot of liquidity above it in the form of a pool of buy stops (7:56, 8:13). He then addresses who those stops supposedly belong to, arguing the market is not trading against retail traders but against the large liquidity offered by the big funds, and that because funds are traditionally long-term trend-following traders, daily-timeframe reference points are the ones that matter for understanding where price is drawn (8:37, 8:53, 8:57). That claim about who the market is trading against is his interpretation of market behaviour; the recording offers no evidence about the identity or intent of counterparties.
Mapping ICT Open Float in the Walkthrough
The example he narrates runs from the low he calls 105.34 up to a run on the buy stops he places at the 115 big figure. Along the way he describes one more market structure shift sending price higher, a subsequent retracement back to a short-term high, a fill of a liquidity void he dates to October, a retrace to a level he reads as 108.60, and then the rally that finally reaches the stops above 115 (9:19, 9:40, 9:53, 9:59, 10:03, 10:16, 10:22). He describes the bullish market structure break as the catalyst for that move, and estimates the displacement from 105.34 to roughly 115.70 as about six months of range for the euro-dollar (10:49). He also says sell-side liquidity in the form of a pool of sell stops sat below a low, and that price swept down and took it, neutralising those stops (11:00, 11:13).
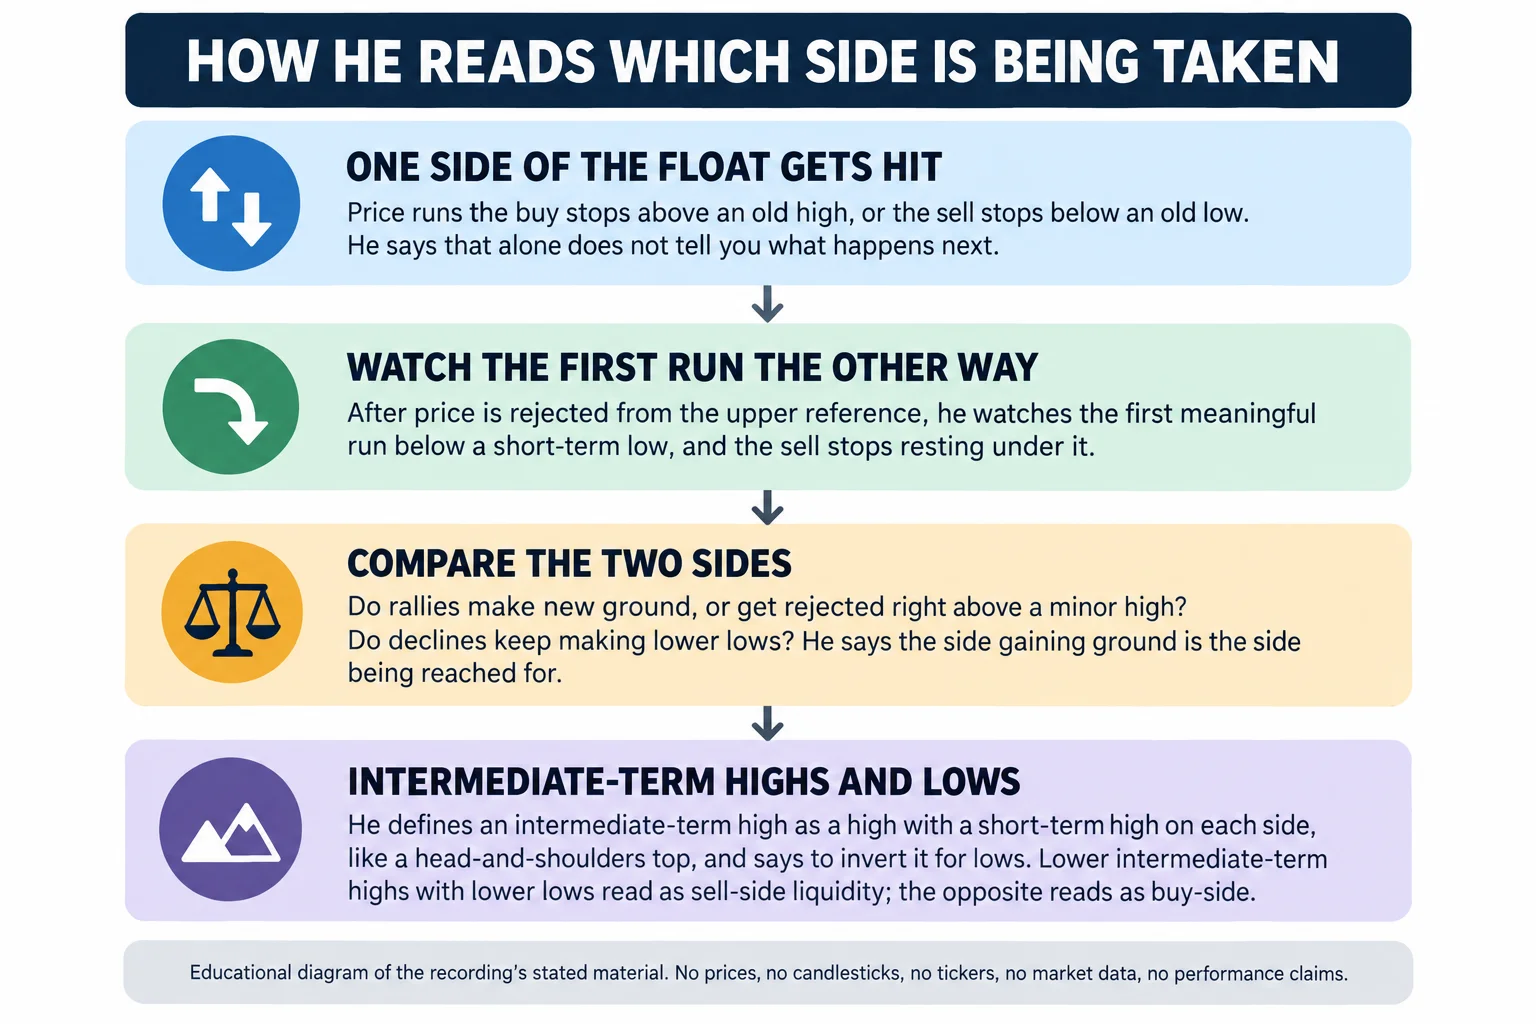
The instructive part for his argument is what happens after the upside level is reached. Notice, he says, that while price travelled from the low to the 115 big figure there was no significant move on sell stops at all. The buy-side stops were the draw (13:42). Once that liquidity was taken, the market broke down and violated a short-term low that had trailing sell stops under it, which he says cancelled those stops and knocked out the longs holding there (13:50, 13:56, 14:06). He calls that first run below the short-term low the first clue that the market was going to work the sell side, while conceding that it is not knowable at the moment it forms. The point is to start watching what price does next (14:25, 14:32, 14:38).
From there the evidence he points to is a sequence of failures on one side. Short-term highs get violated briefly but do not make new ground; he notes one such attempt did not even challenge the old high, and was rejected right above it (14:55, 15:02, 15:10). The short-term lows, meanwhile, keep having their sell stops run out, so each decline makes new lower ground (15:18, 15:58). He puts the observer at roughly the midpoint between the two extremes and says the chances of a higher high from there did not look likely, not, he insists, because of hindsight, but because the behaviour he had just described was showing price could not gain ground after the buy side was taken (15:28, 15:36, 15:46). He states the pattern as a rule at that point: every drop goes a little further, every rally fails to make a new high, and every rally is being distributed (16:14, 16:23).
He continues the comparison through more attempts: a rally above a short-term high that does not create a new high and cannot get above the previous failed attempt near a level he reads as 114 (16:31, 16:36, 16:44), then a rally through an old high that is quickly rejected and trades lower, with price dipping below 109.10 twice before running up to take stops at 112.95 and being rejected there (16:55, 17:01, 17:14). He notes that the short from the 112.95 high came on the heels of the US elections, with a strong dollar and foreign-currency rallies being rejected quickly (17:35, 17:43). Those are his contextual remarks about the period the chart covers, not verified explanations of why the currency moved.
How ICT Open Float Uses Intermediate-Term Highs and Lows
He generalises from the example: the indication to look for is movement below every short-term low with more ground gained on the downside, and he says this works regardless of the timeframe being traded, though on a daily chart he is looking for clues about which side is gaining momentum (17:51, 18:01). What he is watching, in his words, is the tug-of-war between each new run on the stops below the market and the stops above it (18:18). If intermediate-term highs keep forming lower while short-term and intermediate-term lows keep going lower, he reads that as the market wanting the open float below it, in other words wanting the sell side of liquidity, which he says means it is going to be drawn lower (18:24, 18:31, 18:40, 18:46).
The payoff he claims for this is a directional bias on the daily chart, and he says the same reading carries over into day trading, scalping, short-term trading and swing trading because it tells him which side of the market is going to be run (the buy stops or the sell stops) (18:55, 19:06, 19:37). He also stresses the timeframe discipline: if the daily is indicating it wants to run lower because it has no trouble getting under short-term lows while every rally fails to make new ground, then that is the read, and he adds that when price does make a higher high it is punished immediately and only ever just above an insignificant short-term high (19:46, 20:06).
He defines the swing vocabulary the reading depends on: an intermediate-term high is any high that has a short-term high to the left of it and to the right of it, and he compares the shape to a head-and-shoulders top formation (20:15, 20:23). He then extends it: an intermediate-term high with a lower intermediate-term high to the left and another intermediate-term high to the right is, in his description, actually a long-term high in the middle, and the same is to be inverted for lows (20:27, 20:41). He attributes the market-structure reading itself to what he learned from studying Larry Williams as a new trader, which is a named influence rather than a citation of a source inside the recording (20:49).
ICT Open Float and the Quarterly Cycle
He closes the walkthrough by pointing to the longer sample: he revisits a void between two levels that price filled before trading down to the short-term low he reads as 105.34, and a later break of a level near 107 reaching below to take sell-side liquidity out (21:17, 21:31). He is candid about what daily-chart study of this kind requires: he says the examples are plentiful in hindsight but take time, and that they do not offer much turnaround time (21:47, 21:54, 22:01).
The two periods he cites as illustration are a move from a December 2015 low up to a May 2016 high, which he describes as about six months, and the move from that spring 2016 high down to a low in December 2016, which he calls about six months or a little more (22:09, 22:14, 22:27, 22:41). He presents them as the effect of how the quarterly shift takes place alongside the runs on liquidity and the implementation of open float (22:45). The duration figures are his characterisation of the chart, not a measured statistic, and the recording gives no entry, exit, risk or result for either period.
ICT Open Float Summary
In his own closing definition, open float is the study of how the market reaches for the buys and the sells that are above market price (22:58). Knowing where orders will be building and stacking above old highs and below old lows is, he says, the framework for mapping which side of the marketplace the market makers and smart money are seeking to run (23:07, 23:14). He says determining that on a daily chart gives trend, daily bias and long-term bias, and what he calls prognostication for a smart-money and institutional vantage point on all of your trades (23:19, 23:26). He signs off wishing the listener good luck and good trading (23:34).
How to Study ICT Open Float
Taken as a chart-annotation exercise rather than an established market law, the lesson’s instructions reduce to a repeatable sequence:
- Work from the daily chart, which is the frame this lesson uses.
- Divide the history into three-month intervals and mark each interval’s highest high and lowest low.
- Label the probable resting orders above the highs and below the lows using his four categories, and keep entering-protection separate.
- When price runs one side, watch the first meaningful run in the opposite direction and the stops resting under or over it.
- Compare which side keeps making new ground and which keeps failing, rather than treating one sweep as a reversal.
- Record the sequence of short-term, intermediate-term and long-term highs and lows, and revise the bias when that sequence stops confirming it.
Framed that way, the reading is closer to “which side is being worked” than to “buy below an old low” or “sell above an old high.” That distinction matters, because the lesson’s own examples depend on the sequence of rejections and follow-through, not on the penetration of a single level.
What ICT Open Float Does Not Prove
Three limits belong with this material. First, no order data appears anywhere in the recording: the buy-side and sell-side pools are inferred from the shape of the chart, not read from an order book, so “where the stops are” is a working assumption rather than a measurement. Second, the walkthrough is a historical chart reviewed after the fact. He says as much about the time these setups require, and nothing in the recording is a live, out-of-sample test of the method. Third, there is no account information of any kind (no entry or exit records, no position sizes, no risk parameters and no profit or loss figures) so the lesson is a framework for studying price, not a demonstration of profitability.
The chart readings above are reported from his spoken description of the chart. This review heard the audio and read the transcript; it did not independently verify the bars, the levels or the swing labels, and no price, pip distance or level has been added that the recording does not state. His explanations of who is on the other side of the market (large funds, market makers, smart money) are his interpretation, not an independently verified account of counterparty behaviour.
Watch the ICT Open Float Recording
ICT Mentorship Core Content – Month 05 – Open Float
The Inner Circle Trader · watch page lists upload 12 September 2022 · 1,422 seconds, about 23 minutes 42 seconds. The speaker opens the recording as lesson 1.2 of the long-term analysis content. This recording is the primary source for every timestamp link on this page.
The recording is not embedded here. An embedded player was tested directly on 15 September 2026 from a BestProps page origin at desktop and mobile widths, and it loads but then reports “Playback on other websites has been disabled by the video owner”, with no duration and no playback progress, while the video itself plays normally on YouTube. No half-working player is left on this page.
The watch page was read on 15 September 2026 and is publicly listed as ICT Mentorship Core Content – Month 05 – Open Float by The Inner Circle Trader, with an upload timestamp of 12 September 2022, not private and not unlisted, and a listed duration of 1,422 seconds, about 23 minutes 42 seconds, against a transcribed audio duration of 1,421.6 seconds.
ICT Open Float Resources
These are the sources checked for this article. The regulator and investor-education pages are general material on assessing trading systems sold to the public, on how futures positioning data is reported, and on short-term trading risk. None of them evaluates this speaker, and none of them verifies open float, the reference lev