
Key takeaways
ICT defines open float as a rolling 120-trading-day bracket on a daily chart, spanning 60 trading days behind and 60 trading days ahead of the reference date, with the highest high and lowest low of the last 20, 40, and 60 trading days labeled near-term, short-term, and intermediate-term open float.
Read the full summary
ICT defines open float as a rolling 120-trading-day bracket on a daily chart, spanning 60 trading days behind and 60 trading days ahead of the reference date, with the highest high and lowest low of the last 20, 40, and 60 trading days labeled near-term, short-term, and intermediate-term open float. Buy stops are presumed above old highs and sell stops below old lows, creating liquidity pools that large funds target roughly quarterly, while new buy-side and sell-side pools form every 20 trading days as the window rolls. The 20-day range is considered easiest to reach and most useful for intraday scalping and day trading, the 40-day range provides broader short-term context, and the 60-day range defines the time boundary. Repeated runs on buy stops indicate bullish institutional order flow, repeated runs on sell stops indicate bearish flow, and a switch in the side being taken can signal a market-structure or quarterly shift. ICT favors false breaks of old highs or lows rather than simple breakout continuation and relates the idea to Richard Dennis and the Turtle traders, who bought 20-day highs and sold 20-day lows. The forward 60-day half is not a forecast because future extremes are recorded only as price forms them. The lesson uses March-delivery Canadian dollar futures and USD/CAD daily charts, provides no entry model, risk protocol, or performance result, and relies on an automatic audio transcript whose quoted chart levels, pip figures, and open-interest percentages were too inconsistent to reproduce reliably.
How we researched this article
BestProps used document-based research from primary firm sources, checked September 24, 2026. The complete source list, scope, limitations, and commercial-state record appear near the end of this article.
ICT Open Float Lesson and Chart Sources
He opens by naming the lesson: lesson 1.4, defining open float liquidity pools (0:07, 0:08). The example charts are the March delivery Canadian dollar futures contract and the USD/CAD daily pair, and he says at the outset what he wants the viewer to take from them, on a higher timeframe, identify where the liquidity is, because the liquidity pools for the large funds are largely where markets will reach, apart from the long-term fundamentals (0:39, 0:47, 0:52). On an intermediate-term basis he puts that horizon at about three or four months, and defines the liquidity in question as the open float: the liquidity above old highs or below old lows that gets targeted roughly every quarter (0:56, 1:01, 1:08).
A sourcing note belongs here because it changes what can be claimed. The transcript used for this rewrite is automatic local speech-to-text of the recording’s full audio (Whisper large-v3-turbo), not human-verified captions. The integrity checks passed: the decoded audio is complete and matches the listed duration, with no low-confidence characters flagged. Two things still need care. First, the automatic transcription renders his term “institutional order flow” as “institutional overflow” in places (19:24) and “buy stops” as “buy stocks” (6:01); both are read here as the terms he uses consistently elsewhere. Second, the recording quotes specific chart levels, a pip magnitude and an open-interest percentage for its 2016 worked examples, and the automatic transcription renders those digit strings inconsistently, one rally is spoken both as a four-digit level and as a rounded decimal figure in the same passage (22:59). For that reason this article describes the examples in words and reproduces no level, pip count or percentage as a quotation from the chart. The charts themselves were not available to this review.
ICT Framework for Defining Open Float
The definition itself is a time bracket rather than a pattern. He describes open float as taking the last three months, or taking the last month and a half to the next month and a half in the future, and encapsulating that time, in substance, looking at about three months of data to find the highest high and the lowest low on the daily chart, which is where the large-fund liquidity pools sit above and below market price (1:18, 1:27, 1:34, 1:44, 1:49, 1:54).
He then makes it concrete with a hypothetical reference date of the first of August. On that date he looks back at the highest high and lowest low over the prior 60, 40 and 20 days, and then looks forward to the highest high and lowest low in the first 20 trading days to the right of the reference date, then the 40-day range and then the 60-day range out from it (1:54, 2:01, 2:06, 2:17, 2:25, 2:32). His summary of the whole construction is that when you have that range (60 days looking back and 60 days cast forward), that is open float, and you want the highest high and the lowest low between those two reference points and times (2:32, 2:41, 2:45).
He restates the same construction later in the lesson as a revolving range of 120 days: whatever day you are looking at, you look back 60 and look forward 60, and you constantly monitor where the highest high and the lowest low sit inside that range (25:10, 25:16, 25:26, 25:32). He adds a practical distinction between the two halves. The lookback phase is where the actual buy and sell stops rest, above an old high and below an old low. The forward phase is not known, so while studying new price action he says to stay mindful of where price currently sits inside the last 60 days (near a high or near a low) because that is also indicative of where he expects the next quarterly shift (25:42, 25:54, 26:03, 26:10).
Open Float Day Horizons
He is explicit that the exercise is not to take the single outermost 60-day extreme and stop there (4:41, 4:45). Instead the lookback is divided into three nested horizons, and he names each one: the highest high and lowest low of the last 20 trading days is the near-term open float, the last 40 trading days is the short-term open float, and the last 60 trading days is the intermediate-term open float (4:52, 4:58, 5:05, 26:33, 26:46, 26:52, 26:57). He summarises the same three definitions near the end of the lesson (26:33, 26:39, 26:46, 26:52, 26:57).
The horizons are not equivalent in purpose, and he says which is which. The 20-day range is the one he calls easiest for the market to reach and the most useful for intraday scalps and day trading, because the near-term liquidity is the closest (5:15, 5:22, 5:27, 5:35, 5:40). The 40-day view gives a broader short-term basis for defining liquidity pools on the daily chart (5:40, 5:50, 5:55). The 60-day view sets the boundary point at which open float ends, and he corrects himself while saying it, clarifying that he means in terms of time, not price (6:05, 6:13, 6:20, 6:22).
Where Open Float Liquidity Pools Form
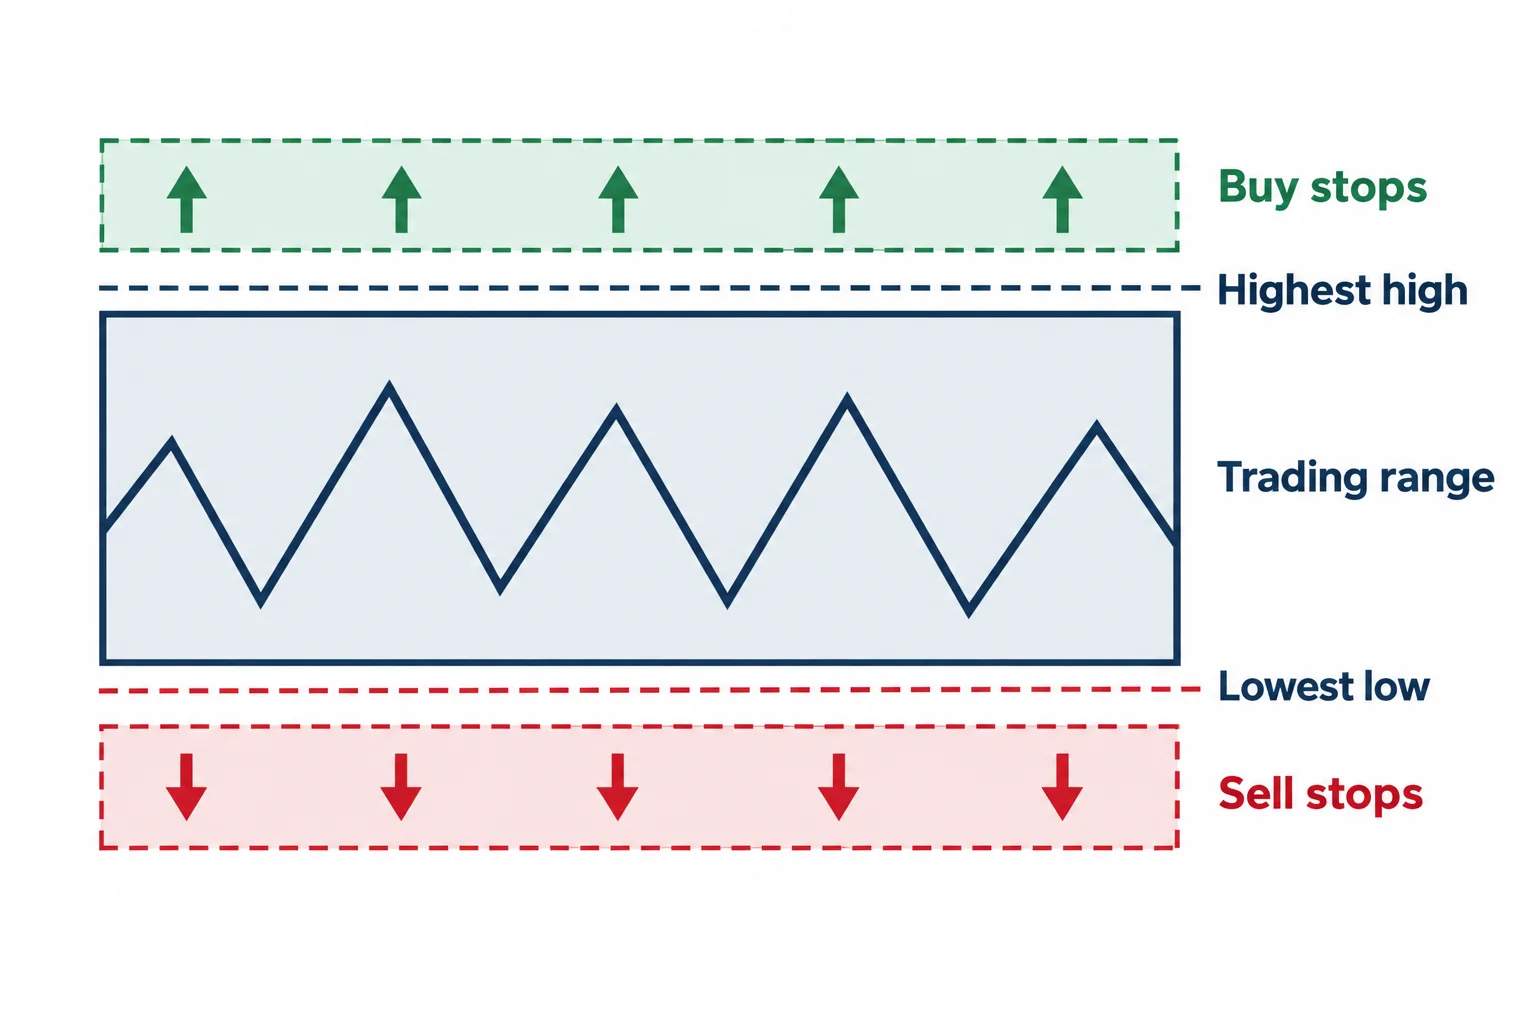
Everything above is preparation for one mapping. Once the range is marked, buy stops are assumed to rest above its high and sell stops below its low, and he says the highest high and lowest low of the lookback are exactly the two price points that reference open float on a large-fund level (10:34, 10:39, 10:42, 10:48). He makes the point in the 40-day terms as well: find the last high and the last low that made the extremes of that range, and buy stops sit above that high while sell stops sit below that low (5:55, 6:01, 6:05). Because the window rolls forward month by month, he says a new liquidity pool forms on the buy side and on the sell side every 20 trading days, and that the work is simply to identify where those ranges are relative to the most obvious swing high and swing low (14:42, 14:47, 14:50, 14:56, 14:58).
He also states the limitation of the method in his own words: nobody can accurately depict or forecast the future, which is why the forward half of the bracket is treated as ideal timing windows rather than as a projected price range (4:21, 4:27, 4:33, 4:41). Later he returns to the same caveat, saying explicitly that we do not know where the next high will be, or whether the next 60 trading days will produce a higher high or a lower low. The market is simply monitored as price creates new swings (15:32, 15:38, 15:44, 15:49, 15:55).
Open Float Liquidity Pools Around Old Highs and Lows
The pattern he says he likes to trade inside this framework is the false break: a break above an old high or below an old low that does not hold. He introduces it with a flourish before naming it 6:44, and he credits the idea he is using to the Street Smarts book, explicitly stating that he is not teaching that pattern here and that he is giving respect to the authors (6:56, 7:01, 7:06). He then describes the underlying model he says the pattern came from: the turtle traders assembled by Richard Dennis, taught a long-term trend-following approach that bought breakouts above a 20-day high and sold short breaks of a 20-day low, and he notes that while they had many losing trades their winners were very large (7:13, 7:18, 7:23, 7:27, 7:33, 7:38, 7:43, 7:49).
His adaptation is the part that matters for this lesson. He says that breakout was many times false, and that the falseness itself gives the edge (8:20, 8:27). He also links the long-term trend-following character of the model to why he considers it relevant to currencies, saying the large funds in FX are long-term trend followers and that these markets are closely linked to interest-rate markets, which are the underlying fundamental drivers (7:53, 7:57, 8:01, 8:07, 8:13). On this article’s reading, the second half of that is his own framework for why trends exist rather than something the lesson demonstrates.
Reading ICT Open Float Liquidity From Rolling Day Ranges
This is the interpretive core of the lesson, and he states it as a conditional: if buy stops keep being hit and sell stops rarely are, that teaches you the institutional order flow is bullish and is drawing on the buy stops above (8:52, 8:57, 9:02, 9:10); if instead the sell stops keep being run and the buy stops rarely get hit, the flow is bearish and the banks are reaching for the large-fund liquidity below the lows (9:10, 9:14, 9:18, 9:22). He then attaches a way to notice a change of character. If price is above the last 60-day high, he says buy stops should keep being taken out, and if sell stops start being taken instead, that is probably a quarterly shift (16:50, 16:55, 16:57, 17:01). The mirror case is a market below the last 60-day low: he calls that deeply oversold and a deep discount, and says that if buy stops start getting hit while sell stops rarely are, a market-structure or quarterly shift toward a new direction is probably forming (17:01, 17:08, 17:10, 17:14, 17:19, 17:22).
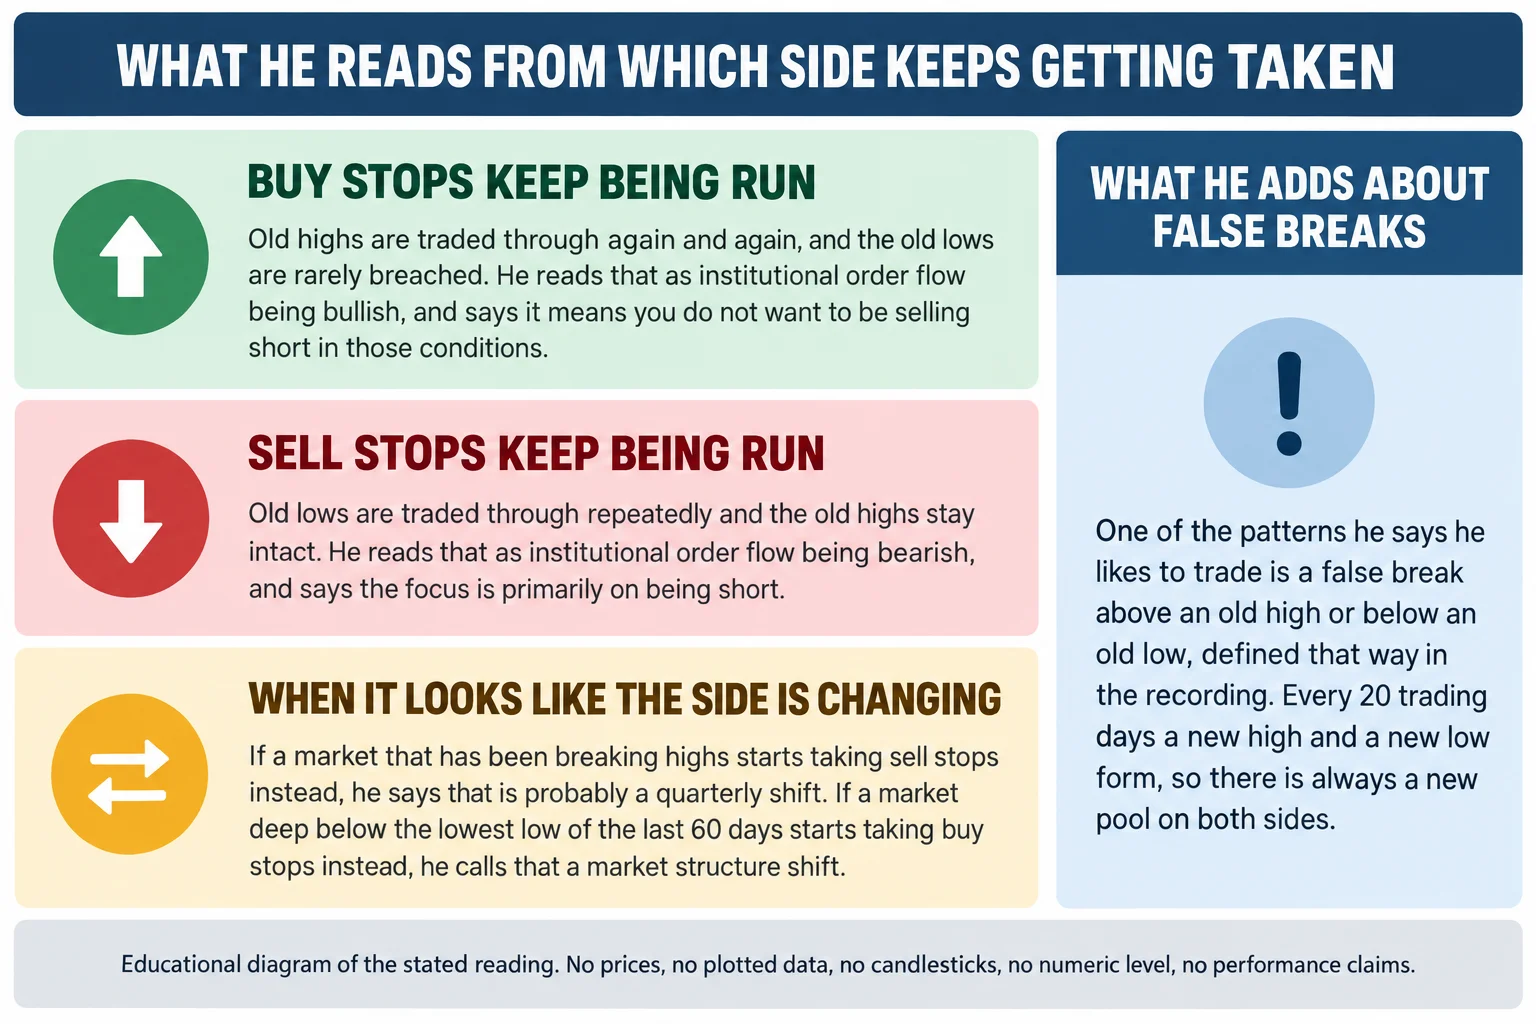
He applies the same logic at the end of the lesson, repeating the two conditions and adding the instruction that follows from each: in conditions where the buys keep being taken you do not want to be selling short, and where the sells keep being taken and the highs rarely are, the focus is primarily on being short (23:58, 24:04, 24:09, 24:14, 24:19, 24:21). He qualifies the whole method once more, saying the market generally moves from range to range rather than in a one-sided parabolic move, with a forward reference to a lesson on that exception (26:12, 26:18, 26:22, 26:27).
Open Float Liquidity Examples From Canadian Dollar Charts
Most of the middle of the recording is a month-by-month walk through the same exercise, and it is worth describing the shape of it rather than the levels, for the reason given in the sourcing note above. From the first of August reference date he casts the 60-day lookback and 60-day forward window, then observes that during September the highs formed in the latter portion of July were in fact traded through, the market was drawn to the buy stops on the fund level at those highs (2:58, 3:06, 3:13, 3:21). He then extends the window to the full 60 back and 60 forward to show the same thing happening again, with price driving forward to reach for the buy stops above the October highs (3:31, 3:40, 3:53, 3:59).
He repeats the roll for each subsequent month. With a September reference date he marks the range for the lookback and notes the buy stops above an old high being taken again during that month (9:34, 9:39, 9:44, 9:49, 9:56, 10:04). For October he sets the open-float range from the lookback extremes, states that the higher point is where the buy stops sit and the lower is where the sell stops sit, and describes the first 20 trading days after the reference date producing a low in Canadian dollar futures that took out lows formed through the bodies of candles made in late September, followed by a rejection and a trade higher, one attempt to clear out sell-side liquidity (10:20, 10:27, 10:34, 10:39, 10:42, 10:48, 10:52, 10:59, 11:03, 11:08, 11:09). For November he marks all three lookback horizons, notes the lowest low and highest high, and reports that the high was then taken out to the upside (11:16, 11:24, 11:31, 11:38, 11:43, 11:48). For December he describes the first 20 trading days producing a low and a run up that blew through the buy stops above the November high, followed by a run down into a lower low that formed in the first 40 trading days after the reference date (11:55, 12:02, 12:08, 12:12, 12:16, 12:23, 12:27, 12:34, 12:42). In the freshest window at the time of the recording, he notes that the lowest low of the lookback has already been violated (sell stops at large-fund level taken) and says the forward question is whether a retracement higher is followed by another move lower, because everything he is seeing indicates they now want the sell-side liquidity (12:52, 12:58, 13:05, 13:14, 13:19).
All of those are his readings of the displayed charts as he walks through them. The recording reports the sequence as it appeared on his screen, and none of the levels or outcomes described in this section can be independently verified from the audio transcript.
ICT Open Float Framework for USD/CAD and Open Interest
From 13:19 he turns to the USD/CAD daily chart and applies the same ideas at the level of candle bodies. His method there is to note where the bodies of the candles form a reference, say that stops rest just beyond it, and then watch whether price trades through that area and runs away or wicks through it and is rejected. He walks through a wick below a level that he says is where the sell stops rest on an intermediate-term basis, price trading down, taking them and running away, then a similar sequence on the buy side where the buy stops are taken and price is quickly rejected, then a low whose bodies have sell stops just below, which the market sweeps out (13:27, 13:35, 13:38, 13:43, 13:51, 13:58, 14:00, 14:02, 14:05, 14:13, 14:17, 14:19). The generalisation he draws is that these false breaks are lucrative because the fund trader’s buy stops sit above these levels and sell stops below them (14:26, 14:35, 14:40).
He then returns to the futures contract and flags the inversion explicitly: the futures price action is inverted relative to the dollar index versus Canadian dollar, because USD/CAD going higher means the dollar is strong and the Canadian dollar weak, while USD/CAD going lower means the dollar index is weak and the Canadian dollar is strengthening (17:41, 17:45, 17:47, 17:52, 17:58, 18:05). He asks the viewer to look for the same reference points from the earlier slides, inverted in the futures market, and notes the bodies of the candles being run out in December and quickly rejected, then November bodies traded in December and rejected, then an old high being run where buy stops rest (18:12, 18:17, 18:22, 18:28, 18:36, 18:43, 18:47).
The final ingredient is open interest, and it is the part of the lesson that depends most on interpretation. He says that on higher-timeframe charts he is looking for clues and evidence that a move is about to happen on one side of the market, that every three months there can be a manipulative phase which is itself a catalyst for high-probability entries and exits, and that the evidence he wants is participation by smart money, meaning the banks (19:18, 19:24, 19:30, 19:33, 19:38, 19:43, 19:48, 19:51, 19:56, 20:00, 20:08). He then describes the case he is looking at: as the market traded down through successively lower reference levels, open interest had already dropped sharply by the time price got below the lower of them (20:15, 20:24, 20:34, 20:40, 20:43, 20:45). His rule of thumb is stated outright. Only a 15 per cent decrease is needed for a massive indication that there is large institutional sponsorship behind the move you are expecting (20:45, 20:53).
His interpretation of the signal is worth setting out as he states it, because it is reasoning rather than measurement. Declining open interest, in his account, says the participants are not willing to offer sell-side liquidity to buyers and are scaring those buyers by dropping the market quickly; open interest only declines, he says, as evidence that the smart money do not want to be heavily short, while high open interest indicates a large liquidity program offered for buyers (20:55, 21:01, 21:07, 21:13, 21:21). He then applies it: a run down that takes out sell stops below a level on low open interest while price sits at support is read as indicating potential strength, and he says the move that followed was rather explosive (22:27, 22:33, 22:38, 22:39, 22:45, 22:52, 22:59, 23:08). The transcript cannot verify the open-interest figures, identify the participants, establish that causation, or confirm any part of that outcome; it records what he said about a chart that was on his screen.
Key ICT Open Float Takeaways
The procedure the lesson describes, stated plainly:
- Pick a reference date and mark the highest high and lowest low of the last 20, 40 and 60 trading days on the daily chart.
- Treat the same three horizons as open windows cast forward, recording their extremes only as new daily bars form.
- Read the buy stops above the old highs and the sell stops below the old lows as the liquidity references, not just the single outermost extreme.
- Track which side keeps being taken out, and treat a change of side as a possible shift in character rather than a signal on its own.
- Roll the window forward each new month and repeat, because a new pool forms on both sides every 20 trading days.
- Keep the forward half descriptive: the future high and low are unknown until price forms them.
What the recording does and does not establish should be kept apart. It supports the definition of open float and its two halves, the 20/40/60 horizons and their stated purposes, the mapping of buy stops above old highs and sell stops below old lows, the 20-trading-day replenishment of the pools, the two order-flow readings, the quarterly-shift condition and the false-break framing, because he states all of those in the audio. It does not supply a tested threshold for oversold or deep discount, a complete entry, exit and risk protocol, or any measured result. The open-interest discussion is his reading of a chart this review never saw, and because the automatic transcription renders the spoken level and percentage strings inconsistently, no level, pip figure or percentage is reproduced here as a quotation. What remains is a repeatable way of organising dail