
Key takeaways
This is lesson 2.3 of the January 2017 mentorship (0:13): ICT uses central-bank policy-rate gaps to select forex pairs and establish higher-time-frame bias, then requires confirmation from support and resistance, institutional order flow, open interest, seasonality, and the US Dollar Index rather than treating rates as entry signals.
Read the full summary
This is lesson 2.3 of the January 2017 mentorship (0:13): ICT uses central-bank policy-rate gaps to select forex pairs and establish higher-time-frame bias, then requires confirmation from support and resistance, institutional order flow, open interest, seasonality, and the US Dollar Index rather than treating rates as entry signals. Historical AUD/USD examples compare Australia at 1.5% with the United States at 0.50% or 0.75%, reference support near 71.50, declining futures open interest interpreted as commercial short covering, and a reported rally above 400 pips. The USD/JPY example compares a positive US rate of 0.50% or 0.75% with a negative Japanese rate, explains that expected yen weakness implies higher USD/JPY, references yen resistance near the transcribed 98 big figure, and reports a move above 1,200 pips amid seasonality and 2016 US election volatility. ICT recommends reviewing the prior three to six months, but the transcript does not verify chart measurements, fills, profitability, or a dependable edge, and the framework remains vulnerable to hindsight bias, expected policy changes, inflation, risk sentiment, economic conditions, and positioning.
How we researched this article
BestProps used document-based research from primary firm sources, checked September 24, 2026. The complete source list, scope, limitations, and commercial-state record appear near the end of this article.
In ICT Mentorship Core Content – Month 05 – Interest Rate Differentials, ICT presents central-bank policy rates as a starting point for forming a higher-time-frame currency bias. The lesson uses historical Australian dollar and Japanese yen examples to show how he paired a relatively high-yielding currency with a lower-yielding one, then looked for supporting technical evidence.
This is a summary of ICT’s framework, not proof that an interest-rate differential predicts exchange rates. The rates, chart references, and market narratives in the recording relate to its historical examples and should not be read as current market data.
How ICT Compares Interest Rate Differentials
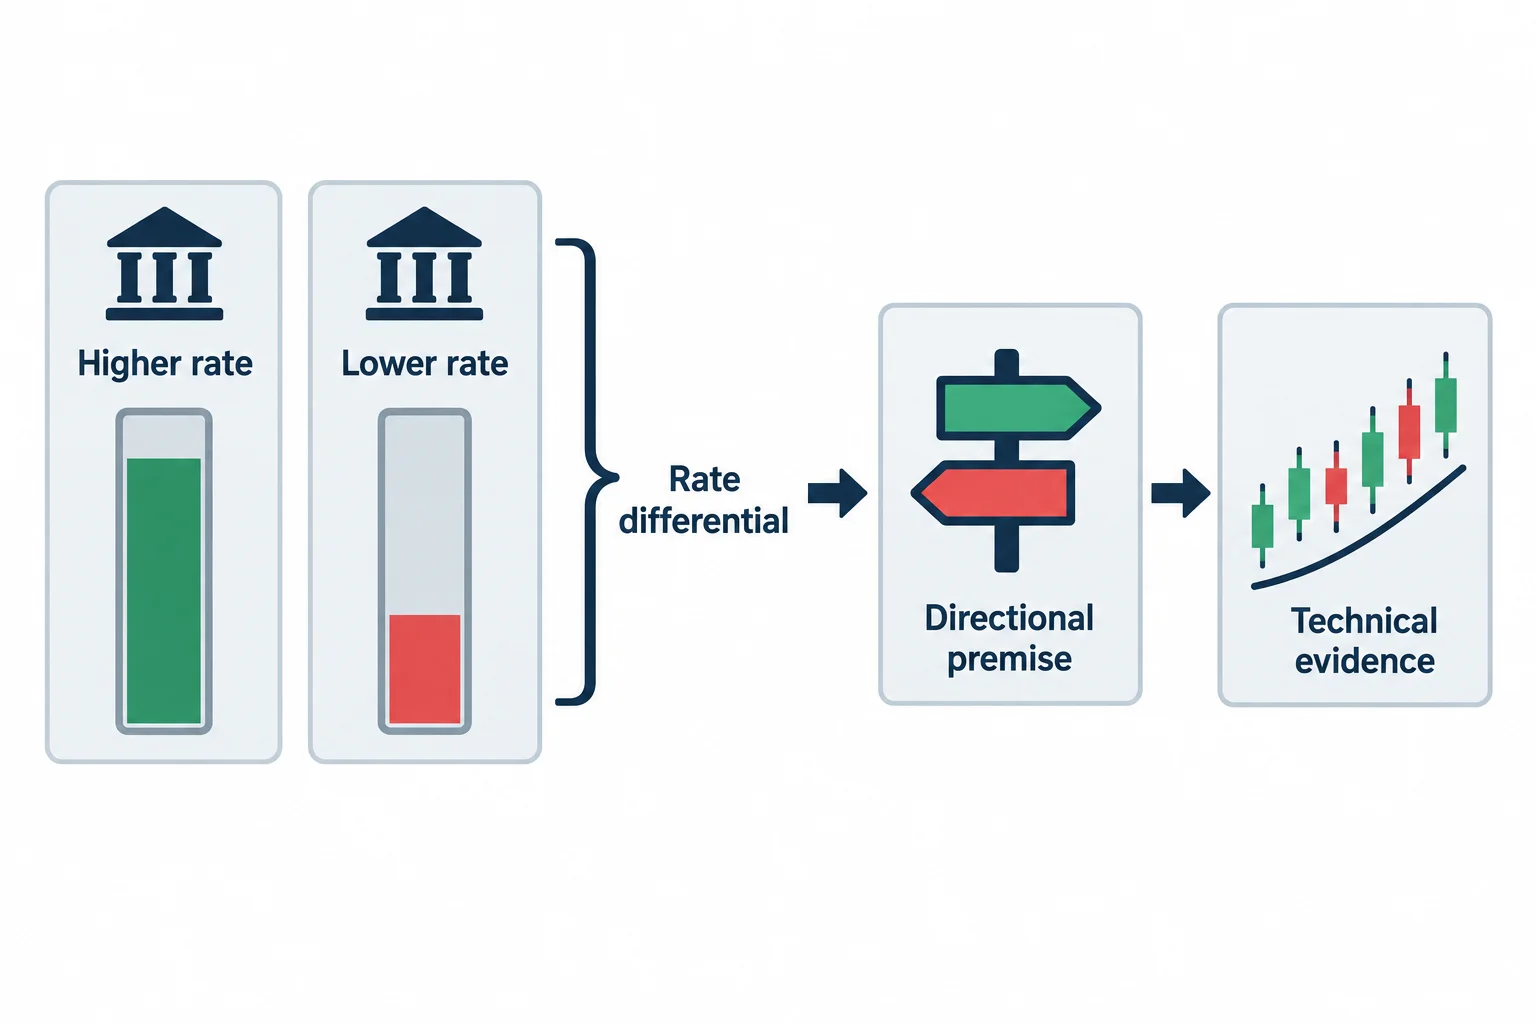
ICT begins the substantive discussion at 0:25 by describing central-bank interest rates as the foundation of his macro analysis, and says the published list of global central-bank rates he reads came from fxstreet.com (0:35). His selection process is straightforward:
- Identify one currency with a relatively high central-bank rate.
- Identify another with a materially lower rate.
- Construct the corresponding forex pair.
- Use the differential to form a directional premise.
- Wait for higher-time-frame technical evidence rather than acting on the rate comparison alone.
On the list he is using, he points out that the highest rate is the Reserve Bank of New Zealand, the next is the Reserve Bank of Australia, and the low end is the Bank of Japan, the Swiss National Bank and the European Central Bank (1:34). At 4:20, ICT emphasizes that the comparison does not have to use the absolute highest and lowest rates. In his model, a sufficiently strong difference can provide a starting point. He characterizes capital as tending to seek higher yield, leading him to favor the stronger-yielding currency against the weaker-yielding currency.
That is a simplified macro interpretation. Currency prices can also reflect expected rate changes, inflation, risk sentiment, economic conditions, positioning, and other variables. Even within the lesson, ICT does not treat the differential as a complete entry signal.
ICT Interest Rate Differential Example for AUD/USD
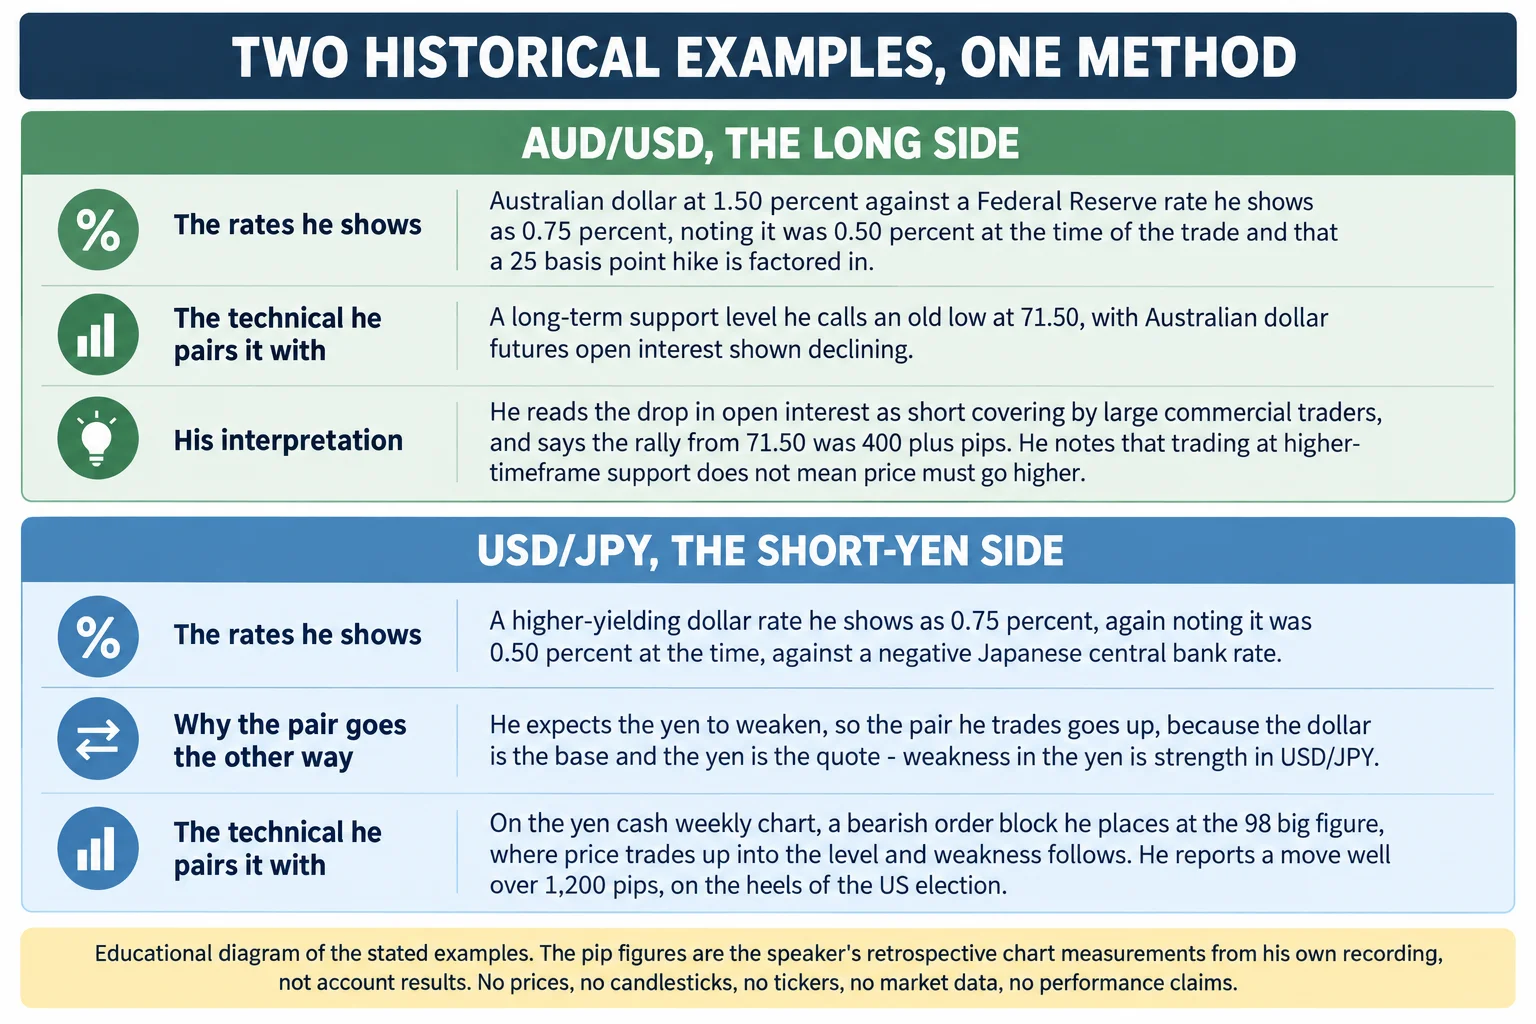
ICT’s first historical example starts at 4:56. He selects the Australian dollar as the higher-yielding side and the US dollar as the lower-yielding side. The rates discussed are 1.5% for Australia and either 0.50% or 0.75% for the United States, depending on the point in the historical sequence. ICT explicitly notes that a 25-basis-point Federal Reserve increase affected the displayed comparison.
After choosing AUD/USD, he adds several filters:
- Higher-time-frame support
- Open-interest behavior
- Seasonal tendencies
- Directional confirmation from the US Dollar Index
At 7:16, ICT discusses an Australian dollar cash chart and an old low he calls 71.50. He then describes declining open interest in an Australian dollar futures contract. His interpretation is that the contraction represented short covering by large commercial participants and supported the possibility of higher prices.
ICT says the subsequent rally exceeded 400 pips, but the transcript alone cannot verify the chart scale, the precise move, or an executable trade. More important for understanding the lesson is how he combines evidence: the rate differential creates the macro premise, while support and open interest are used as confirmation. At 9:25, he also acknowledges that reaching higher-time-frame support does not by itself mean price must rise.
ICT Interest Rate Differential Example for USD/JPY
The second example begins at 11:38. ICT compares a positive US policy rate (described as 0.50% at the time of the example and later displayed as 0.75%) with a negative Japanese rate.
This section also illustrates the importance of pair notation. If ICT expects the yen to weaken against the dollar, his directional expectation for USD/JPY is higher because the dollar is the base currency and the yen is the quote currency. He explains that relationship at 12:53.
ICT then discusses resistance in the Japanese yen cash market and a level transcribed as “98 big figure.” He associates the yen’s decline with the rate differential, technical conditions, seasonality, and elevated volatility around the 2016 US election. He reports a move of more than 1,200 pips, although neither that measurement nor the unseen chart can be independently established from the transcript.
Using ICT Interest Rate Differentials for Forex Bias
At 15:29, ICT says this framework is primarily for higher-time-frame analysis rather than short-term or day-trading setups. His thesis is that large funds require fundamental reasons to establish substantial currency exposure, while technical tools may help traders look for signs of those flows.
He also mentions that yield spreads are a related subject he intends to cover when the series reaches swing trading (16:44), and says he does not advise trading exotic pairs such as euro-Swiss (17:38). The lesson closes with a retrospective exercise at 16:58. ICT asks students to compare central-bank rates, construct relevant currency pairs, and review the preceding three to six months for:
- Major support and resistance
- Institutional order-flow concepts
- Open-interest changes
- Alignment between the macro premise and historical price movement
ICT Interest Rate Differential Limits and Risks
The useful analytical distinction is between pair selection and trade timing. In ICT’s presentation, rate differentials help select a market and directional theme; they do not independently determine an entry. His additional filters are intended to test whether observed price behavior agrees with that theme.
Retrospective chart review can help a student understand the framework, but it also introduces hindsight bias. A careful exercise should record the rate data that were actually available at the historical date, distinguish current rates from expected future policy, and document examples that did not follow the simple high-yield-versus-low-yield narrative. Nothing in the transcript establishes profitability, verifies fills, or demonstrates that the method offers a dependable trading edge.
Watch the original recording
ICT Mentorship Core Content – Month 05 – Interest Rate Differentials
The Inner Circle Trader · published 14 September 2022 · about 18 minutes 37 seconds. This recording is the primary source for every timestamp link above.
The recording is not embedded here because the video owner has disabled playback on other websites. That was tested directly on 15 September 2026 from a BestProps page origin at both desktop and mobile widths: the embedded player frame loads, then reports “Playback on other websites has been disabled by the video owner” with no duration and no playback progress, while the recording itself plays normally on YouTube. No empty or half-working player is left on this page.
The watch page was read on 15 September 2026 and is publicly listed as ICT Mentorship Core Content – Month 05 – Interest Rate Differentials by The Inner Circle Trader: upload date 14 September 2022, not private and not unlisted, with the player reporting a length of 1,118 seconds — about 18 minutes 37 seconds. The audio used for this article runs to 1,117.6 seconds, so the transcription and the listed length agree. Inside the recording he identifies the session as lesson 2.3 of the January 2017 mentorship (0:13). As with the other lessons in this series, the lesson identity it states about itself and the YouTube upload date are two different pieces of information.
Resources
These are the sources checked for this article. The central-bank pages are the official publishers of monetary-policy decisions, included as the authoritative place to check what a given policy rate was; they do not evaluate this speaker and none of them verifies any rate comparison, support level, open-interest reading, pip figure or example described above. The regulator and investor-education pages are general material about leveraged foreign-exchange trading and about how trading systems and advisory services sold to the public should be assessed. Every rate, chart level and pip figure in this article is reproduced from what the speaker states in the recording and attributed to him; none is an independently verified measurement. Any ICT, smart-money or third-party indicator, script, note set, chart annotation, transcript pack or re-upload circulating outside the publishing channel’s own page is unofficial and has not been tested here.
- [1] ICT Mentorship Core Content – Month 05 – Interest Rate Differentials — The Inner Circle Trader (primary source; watch page read 15 September 2026, listed length 1,118 seconds, about 148,800 views at the time of reading).
- [2] The Inner Circle Trader — official YouTube channel (read 15 September 2026) — the publishing channel for the mentorship series used here.
- [3] Federal Reserve Board — Open Market Operations (read 15 September 2026) — the official Federal Reserve page on how the FOMC sets its policy target, i.e. where the US side of the differential in this lesson is actually published.
- [4] Reserve Bank of Australia — Cash Rate Target (read 15 September 2026) — the RBA’s own page stating that monetary policy decisions involve setting a target for the cash rate, which is the interest rate on unsecured overnight loans between banks and the near risk-free benchmark for the Australian dollar; the authoritative source for the Australian side of the first example in this lesson.
- [5] Bank of Japan — Monetary Policy Releases 2016 (read 15 September 2026) — the Bank of Japan’s own list of 2016 monetary policy releases, the official record of the Japanese policy stance referenced in the second example.
- [6] CFTC — Fraud Advisory: Foreign Currency (Forex) Fraud (read 15 September 2026) — the regulator’s warning that the forex market is volatile and carries substantial risks, and its list of persuasion tactics used in forex sales pitches.
- [7] Investor.gov (SEC) — Glossary: Interest Rate (read 15 September 2026) — plain-language background on what an interest rate is, relevant to reading a differential rather than a single rate.
Source: ICT, ICT Mentorship Core Content – Month 05 – Interest Rate Differentials, The Inner Circle Trader, uploaded 14 September 2022. The transcript used was automatic local speech-to-text of the recording’s full audio (Whisper large-v3-turbo), not human-verified captions; the integrity checks passed with no low-confidence segments flagged. The policy rates, the 71.50 and 98 chart references and the pip figures in this article are reproduced as the speaker states them from his own historical chart review; they are not independently verified measurements, and no level, fill, order, position size or account result has been invented anywhere above. Where the machine transcript renders a term or figure ambiguously, that is flagged in the text rather than silently corrected. This commentary is educational and is not investment advice or a recommendation to copy any trade.