
Key takeaways
ICT Ideal Seasonal Tendencies is a higher-time-frame FX framework that compares currency-futures seasonality with US Dollar Index futures seasonality, then checks for alignment with a primary trend or a potential long-term turn rather than using seasonality as a standalone entry signal.
Read the full summary
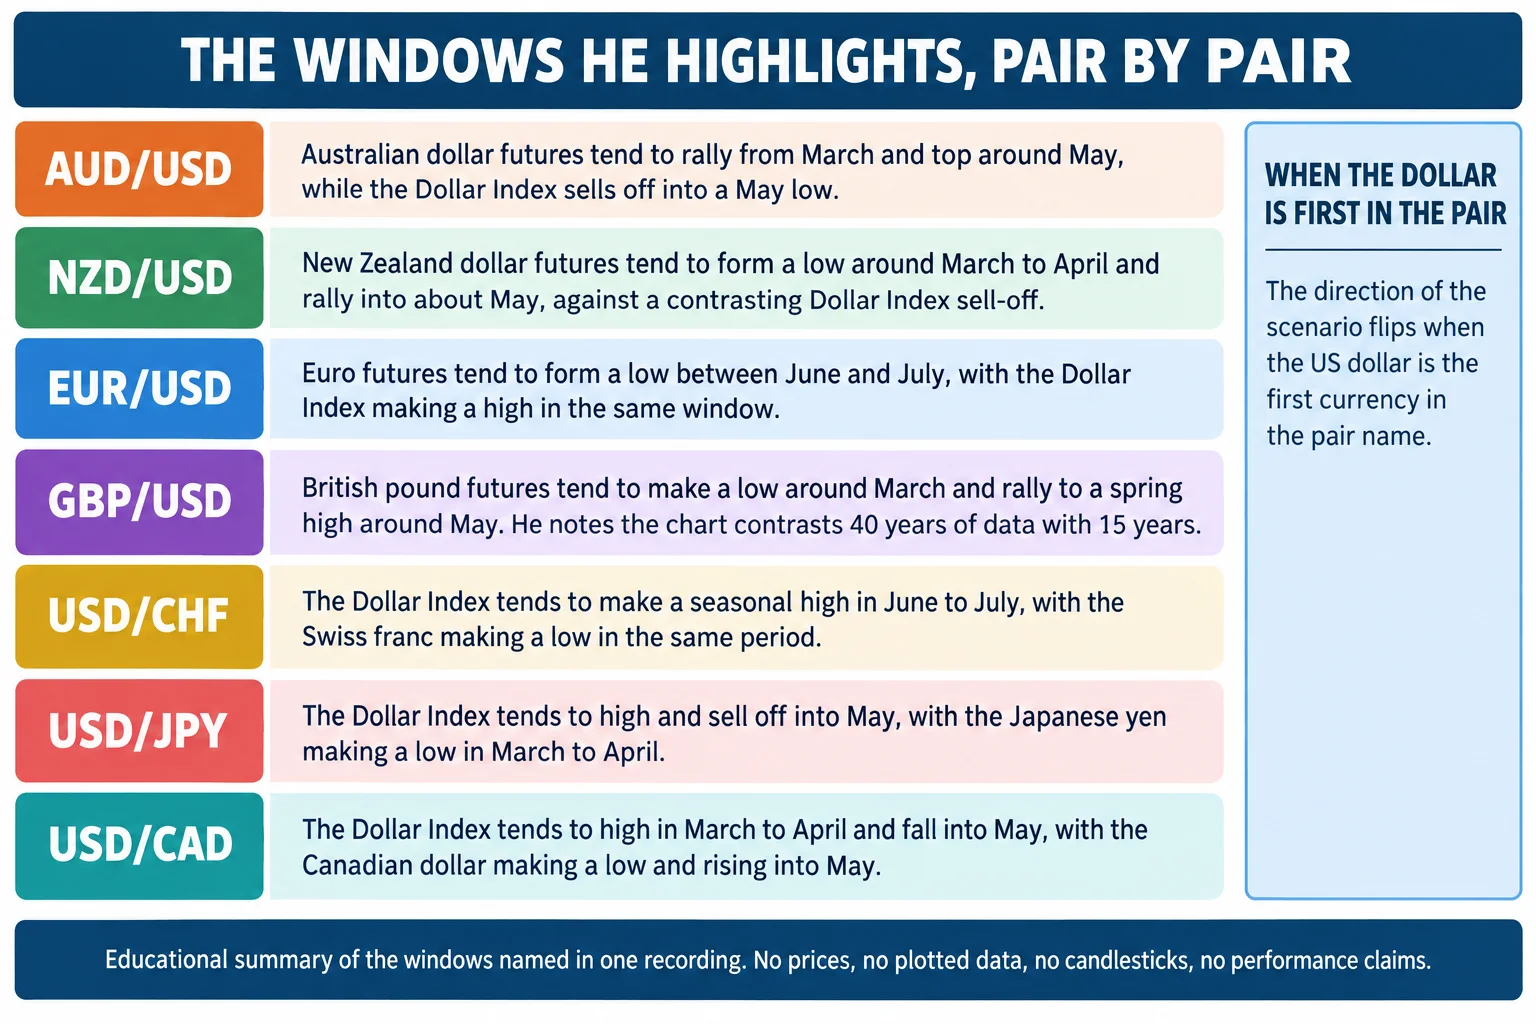
ICT Ideal Seasonal Tendencies is a higher-time-frame FX framework that compares currency-futures seasonality with US Dollar Index futures seasonality, then checks for alignment with a primary trend or a potential long-term turn rather than using seasonality as a standalone entry signal. AUD/USD and NZD/USD may strengthen from March or April into May when AUD or NZD futures rise while the Dollar Index weakens; EUR/USD may form a low between June and July as euro futures bottom against a Dollar Index high; GBP/USD may rise from a March low toward a May high, with the 40-year and 15-year samples he points at both showing the pattern; USD/CHF may reach a turning window around a June-to-July Dollar Index high and a Swiss franc low; USD/JPY may weaken as the Dollar Index falls into May while yen futures rise from a March or April low; and USD/CAD has a potential bearish window when the Dollar Index makes a March-to-April high and declines into May while Canadian dollar futures rise from a low into May. He stresses that both sides of a pair do not have to be trending — one supportive side is enough — and that these windows are periods to focus on, not trade signals. The recording states no prices, entries, risk parameters or results of any kind.
How we researched this article
BestProps used document-based research from primary firm sources, checked September 24, 2026. The complete source list, scope, limitations, and commercial-state record appear near the end of this article.
What ICT Ideal Seasonal Tendencies Mean
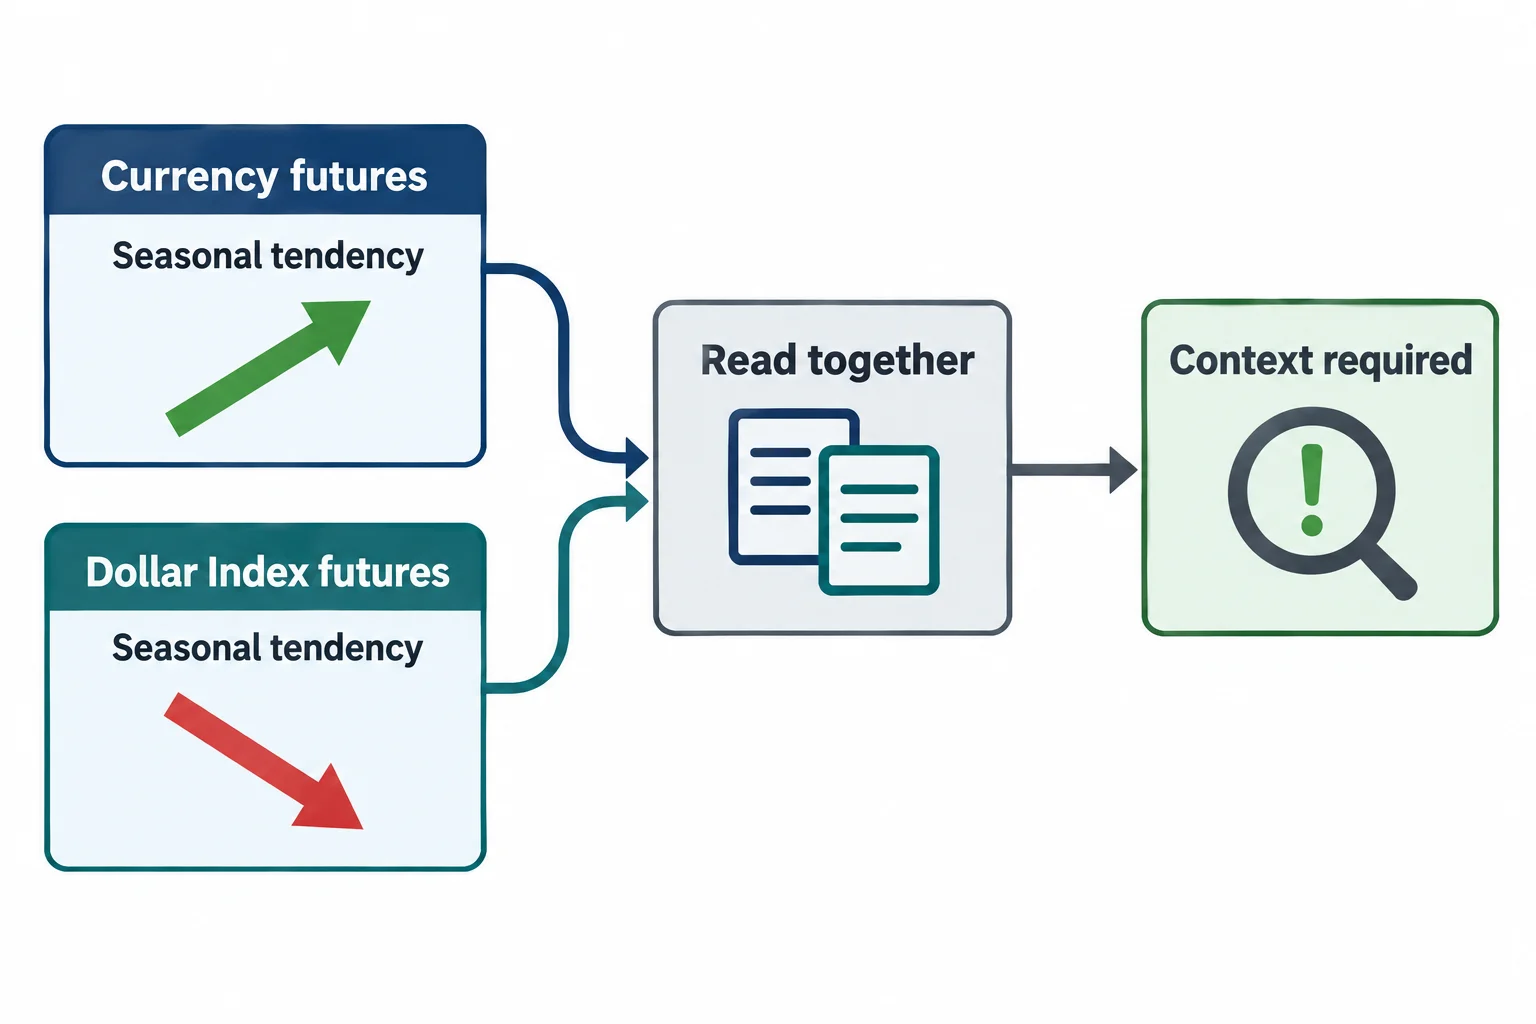
In ICT Mentorship Core Content (Month 05, Ideal Seasonal Tendencies), ICT identifies the recording as lesson 4.3 of the January 2017 mentorship and narrows the subject immediately: ideal seasonal tendencies as higher-time-frame analysis, specifically for foreign-exchange pairs (0:16, 0:22, 0:26). He begins with the limitation rather than the setup. A seasonal tendency, in his words, is a tendency and not a panacea, a be-all end-all or an absolution; it is a roadmap of what has already happened in price action (0:36, 0:43, 0:49).
The mechanical orientation comes next. For each pair the chart on the left is the currency-futures seasonal tendency and the chart on the right is the US Dollar Index futures seasonal tendency, and the exercise is to read the two together rather than one at a time (0:55, 1:00, 1:05, 1:13). His definition of an ideal case is when the underlying market is already predisposed to move in the direction the seasonal tendency outlines (1:25, 1:30). He repeats that this does not mean the pattern appears every year and treats the charts as a general rule of thumb (1:34, 1:40), adding that there is something in the major pairs just about every year that would set up a potential long-term trade (1:44).
A sourcing note belongs here because it affects how the rest of this article should be read. The transcript used for this rewrite is automatic local speech-to-text of the recording’s full audio (Whisper large-v3-turbo), not human-verified captions. The integrity checks passed: the decoded audio is complete and matches the listed duration, with a single low-confidence fragment, a stray full stop at the very end. Terminology is therefore reconstructed from context in a few places rather than trusted character by character: the automatic transcription renders “seasonal tendency” as “seasonal tenancy” in the New Zealand section (3:24) and “seasonal low” as “seasonal Lodiform” in the British pound section (6:18), and both are read here as the seasonal terms he uses everywhere else. The charts themselves were not available to this review, so nothing below describes a chart’s appearance, a price level or an axis.
ICT Seasonal Tendencies for the Major FX Pairs
Seasonal Tendencies for AUD and NZD
For AUD/USD he compares Australian dollar futures with the Dollar Index. From 1:50 he identifies a shaded area as the strongest tendency for Australian dollar futures to rally in March and make a top sometime in May, with the Dollar Index showing the contrasting decline into a May low (1:59, 2:06, 2:14). He then points at the pair construction: the Australian dollar is the first currency in the pair name, so a rise in Aussie futures against a falling Dollar Index is the combination the FX pair expresses (2:20, 2:25, 2:31, 2:35). In his framing the trade is best suited to a long-term primary bull market, or to a market that appears to have made a long-term low and could be tested for a longer-term position (2:52, 2:59).
NZD/USD gets the same treatment from 3:14: a typical March–April window with a high in May for New Zealand dollar futures, and a contrasting sell-off in the Dollar Index over the same months (3:35, 3:41, 3:44). He adds a scope limit that governs the whole lesson: he is not listing every possible seasonal play, only the most obvious ones that stand out and have historical data behind them (3:49, 3:56, 4:01, 4:06). The condition he attaches is bullishness in the underlying New Zealand dollar, with March–April as the expected seasonal low and a rally into around May (4:14, 4:18, 4:22, 4:27).
Seasonal Tendencies for EUR and GBP
The EUR/USD example starts at 4:37. He describes a seasonal low in euro futures that usually forms between June and July, paired with a high forming in the Dollar Index in the same period, and states the higher-time-frame scenario as a low forming in the summer of EUR/USD (4:51, 4:55, 4:58, 5:04). The recording gives no price, no entry model and no outcome for this example.
GBP/USD is discussed from 5:13, where he names the strongest tendency for British pound futures: a low in March with a high forming in May, against a Dollar Index high between March and April and a low in May (5:31). He says it is a really good time to expect a bullish scenario, at least for a long-term trade, when the underlying British pound market is bullish (5:48, 5:53, 6:00, 6:06). At 6:32 he explains the two lines on that chart: the blue line represents 40 years of data and the red line represents 15 years, and he says the overlap of the two samples is part of why he rates this one highly, because the same window shows up in both the shorter and the longer history (6:38, 6:46, 6:56, 7:05). The March–April low into a spring high around May is restated at 7:10 (7:10, 7:15). He also says a suspected long-term turn can be tested by taking a trade and seeing whether it pans out (7:18, 7:25, 7:32, 7:36).
Seasonal Tendencies for USD CHF and USD JPY
Pair construction matters most when the US dollar is the first currency, and USD/CHF is the first example. From 7:45 the Dollar Index chart is on the left and the Swiss franc chart is on the right. He describes the Dollar Index as tending to make a seasonal high in the June–July period, with the contrasting low forming in the Swiss franc over the same months, and calls it a strong tendency for a major turning point in the summer for this pair (8:01, 8:05, 8:08, 8:16). The condition he attaches is a bearish primary downtrend in the Dollar Index, or a primary uptrend in the Swiss franc (8:23, 8:29). Because stronger Swiss franc futures would generally weigh on USD/CHF, the directional reading is the opposite of the AUD/USD example.
For USD/JPY, beginning at 8:46, he says the strongest tendency in the Dollar Index is a high and a sell-off into May, with the opposite seen in Japanese yen futures: a seasonal low forming in March and April that he says generally makes the long-term low for the yen across the calendar year (8:52, 9:03, 9:09, 9:16). The way he frames it is conditional on direction: a Dollar Index downtrend makes it a really good one to sell dollar versus Japanese yen, or a bullish uptrend in the yen makes it a good time to short the pair, buying yen strength while selling dollars (9:24, 9:31, 9:37, 9:46).
Seasonal Tendencies for USD CAD
The USD/CAD discussion begins at 10:00 with the Dollar Index on the left and the Canadian dollar on the right. He describes the Dollar Index as tending to make a high in the March–April period and a low in May, with the Canadian dollar the opposite way round: a low in March–April and a high in May (10:06, 10:15, 10:21, 10:26). His framing is again conditional: if the Dollar Index is bearish this is a good time to sell short dollar-CAD, or if the Canadian dollar is in a long-term bullish trend this is a good time to sell the pair, because the weakness in the Dollar Index and the strength in the Canadian dollar point the same way (10:30, 10:33, 10:39, 10:43).
How He Blends the Two Sides of a Pair
From 10:47 he summarises the whole exercise and adds the clarification that makes it usable. He does not require both sides to be trending: the Dollar Index could be in long-term consolidation while a bullish uptrend in the paired currency supplies the seasonal context, so one supportive side is enough (10:52, 11:01, 11:10, 11:16, 11:22, 11:28, 11:38, 11:47, 11:58). In his words it is a blending of the ideas, not a rule that the dollar must be in a downtrend while the other currency is in an uptrend, and the effect of the blend is to narrow attention to the calendar months where the highest-probability window for a big move falls (12:02, 12:08, 12:12, 12:17, 12:22, 12:29).
The practical instruction that follows is the most concrete part of the recording. He says to go through the calendar ahead of time and write down the months in which specific plays may unfold, because it is easy to forget the seasonal tendencies when caught up in day trading, short-term trading and other ICT material (12:33, 12:38, 12:42, 12:48). On the trading desk he wants an ongoing “things to watch this month, things to watch the coming month” note, and he says to start every trading day by reviewing a macro perspective like this one, asking whether the market is coming into a period with a high probability of a sustainable move (12:52, 12:56, 13:00, 13:05, 13:11). He closes by saying the seasonal tendencies will come up again in swing trading and short-term trading, so the treatment here — higher-time-frame analysis only — is not the end of the subject (13:29, 13:37, 13:41, 13:45).
Key Takeaway
The lesson reduces to a structured research routine:
- Identify the historical seasonal window for the relevant currency futures.
- Compare it with the Dollar Index seasonal tendency for the same months.
- Account for whether the US dollar is the first or the second currency in the FX pair.
- Check whether at least one side has a supportive higher-time-frame trend or a suspected long-term turn.
- Write the window into the calendar and treat it as a period for closer observation rather than permission to enter.
What the recording does and does not establish is worth separating. It supports the window dates, the two-chart comparison method, the 40-year and 15-year samples he points at and the requirement of at least one supportive side, because he states all of those in the audio. It contains no prices, no fills, no risk parameters, no year-by-year results and no measurements of any kind, and because only the audio was available to this review, nothing above describes the charts themselves. The windows are his stated observations about historical seasonality and a way of organising attention; they are not evidence that the tendencies are reliably predictive or profitable, and nothing here is a recommendation to copy a trade.
Watch the Original Recording
ICT Mentorship Core Content – Month 05 – Ideal Seasonal Tendencies
The Inner Circle Trader · uploaded 15 September 2022 · 13 minutes 57 seconds. This recording is the primary source for every timestamp link above.
The recording is not embedded here because the video owner has disabled playback on other websites. That was tested directly on 15 September 2026 from a BestProps page origin at both desktop and mobile widths: the embedded player frame loads, then reports “Playback on other websites has been disabled by the video owner” with no duration and no playback progress, while the video itself plays normally on YouTube. No empty or half-working player is left on this page.
The watch page was read on 15 September 2026 and is publicly listed as ICT Mentorship Core Content – Month 05 – Ideal Seasonal Tendencies by The Inner Circle Trader: uploaded 15 September 2022, not private and not unlisted, with the player reporting a duration of 837 seconds — about 13 minutes 57 seconds. The audio used for this article runs to 836.4 seconds, so the transcription and the listed duration agree. The recording identifies itself in its opening seconds as lesson 4.3 of the January 2017 mentorship content, which is the lesson number used above 0:16. The audio and the upload are five years apart, and the two dates are kept distinct here rather than treated as a contradiction: the recording names the 2017 lesson it belongs to, while the page states an upload date of 15 September 2022.
Resources
These are the sources checked for this article. The regulator and investor-education pages are general material about how trading systems sold to the public should be assessed and about short-term trading risk; neither one evaluates this speaker and neither verifies the seasonal windows described above. Any ICT, smart-money or third-party indicator, script, note set, chart annotation, transcript pack or re-upload circulating outside the publishing channel’s own page is unofficial and has not been tested here.
- [1] ICT Mentorship Core Content – Month 05 – Ideal Seasonal Tendencies — The Inner Circle Trader (primary source and the recording transcribed for this article; watch page read 15 September 2026, listed duration 837 seconds, about 142,000 views at the time of reading).
- [2] The Inner Circle Trader — official YouTube channel (read 15 September 2026) — the publishing channel for the 2017 mentorship series used here.
- [3] CFTC — Fraud Advisory: Commodity Trading Systems Sold on the Internet (read 15 September 2026) — the regulator’s guidance on assessing trading systems and advisory services sold to the public.
- [4] Investor.gov (SEC) — Day Trading (read 15 September 2026) — investor education on short-term trading risk, relevant background to a lesson that deliberately works only on higher timeframes.
Source: ICT, ICT Mentorship Core Content – Month 05 – Ideal Seasonal Tendencies, The Inner Circle Trader, 15 September 2022. The transcript used was automatic local speech-to-text of the recording’s full audio (Whisper large-v3-turbo), not human-verified captions; the integrity checks passed with the decoded audio complete against the listed duration, and any term that looked like a mishearing is flagged above rather than silently corrected. No price, level, entry, fill or result has been invented anywhere in this article, and the charts referenced in the recording were not available to this review. This commentary is educational and is not investment advice.