
Key takeaways
This recording identifies itself as lesson three of the January 2017 mentorship and its subject as how to use intermarket analysis 0:12, 0:19, and he warns at the outset that the material is conceptual, with no charts, and is dry enough that the viewer should save it for a time they can take notes 0:26,…
Read the full summary
This recording identifies itself as lesson three of the January 2017 mentorship and its subject as how to use intermarket analysis 0:12, 0:19, and he warns at the outset that the material is conceptual, with no charts, and is dry enough that the viewer should save it for a time they can take notes 0:26, 0:35. The framework rests on four groups he says are closely related: the bond and interest-rate markets, commodities, the stock market and currencies 1:53, 2:02. He treats bond prices and stocks as generally moving together, so rising Treasury prices are supportive of equities and a persistent bond decline is a headwind, since falling bond prices mean rising yields and stocks do not like higher rates 5:10, 6:45. Bonds and commodities he describes as inverse, with commodity strength as the leading indication of an inflationary environment, and he gives six to twelve months as the lead-and-lag window over which those trend changes show up 9:35, 10:23, 10:38. The dollar index and commodities are inverse as well, with export-sensitive grains and livestock responding to dollar strength or weakness 7:29, 7:59. He then insists the benchmark matters: the CRB index is weighted towards agriculture and livestock, the Goldman Sachs commodity index towards energy, and the industrial-metals index towards copper, aluminium, zinc and tin rather than precious metals 11:38, 11:57, 12:17. His confirmation list pairs a bullish dollar with bearish gold, oil strength with Canadian-dollar strength and so a weaker USD/CAD, Dow strength with Nikkei strength, and falling yields with a weaker currency because money seeks yield 15:15, 15:28, 15:34, 15:57. He closes with the limits: these relationships confirm a long-term bias but timing is the hardest part, higher-time-frame execution forces wider stops and longer holding periods, nothing is certain and the analyst can always be wrong 16:53, 17:31, 18:16. The lesson supplies no entries, no sizing, no objective trend rules, no alignment threshold and no results.
How we researched this article
BestProps used document-based research from primary firm sources, checked September 17, 2026. The complete source list, scope, limitations, and commercial-state record appear near the end of this article.
What this lesson is, and what it deliberately is not
He introduces the material as lesson three of the January 2017 mentorship content and names the topic as how to use intermarket analysis 0:12, 0:19. The framing that follows is unusually blunt: he says the presentation is predominantly conceptual, that there are no charts, and that the information is useful but very dry, advising anyone who cannot give it full attention to come back and take notes later 0:26, 0:35, 0:44. What follows is therefore a lecture about relationships rather than a demonstration of them, and nothing in the transcript shows a chart being read.
His premise is that world markets are directly linked and that many traders do not realise exactly how. He points to correlations between asset classes, groups and sectors, and adds that some of the relationships are between markets that look unrelated until the country’s export profile is understood 0:57, 1:06, 1:16. Studying those markets as a collective, he says, aids the analysis 1:37.
The video is published as ICT Mentorship Core Content – Month 05 – How To Use Intermarket Analysis with a watch page upload date of 14 September 2022, while the speaker presents it as January 2017 content. The two dates describe different things, and the transcript alone does not establish when the session was recorded.
The four groups, and why they do not move lockstep
He sets out four groups and says they are closely related to one another: the bond and interest-rate markets, the commodity markets, the stock market and the currencies market 1:53, 2:02, 2:12. Because his focus is long-term analysis, he says the work is about the relationships between those groups rather than any single market 1:45.
The caveat comes immediately. They do not move in lockstep, and he rules out the idea that a five-point move in bonds produces a matching fixed move elsewhere 2:17. Working from a long-term macro perspective, he says there is a measure of lead time and lag time in these relationships 2:29, 2:35. He recognises that this will put some viewers off, because traders are used to expecting a reaction right away, and repeats that when you are a long-term trader you have to expect delay before the market reflects what the analysis suggests 2:43, 2:51, 2:56.
Why he prefers this to digesting fundamental data
The reason he gives for gravitating to this approach is candid: reading every fundamental release — CPI, employment trends and the rest of the monthly data — is more information than he can digest, and he says flatly that he does not claim the mental capacity to understand it all 3:06, 3:24. He adds that he does not believe there is a realistic way to stay abreast of that volume of data, and that he would like to meet someone who can use fundamental data to forecast future prices, because in his own studies he has never found anyone able to do it with a great deal of accuracy 3:29, 3:38, 3:48, 4:00.
His claim is that watching these four groups delivers the insights the fundamental data would ultimately deliver, without the data-wading 4:26, 4:31, 4:37. That argument returns at the end of the recording, where he says price across the asset classes reflects what the fundamentals are actually doing, because trained and accredited staff at the large institutions, banks, producers, manufacturers and exporters use the real data and build their business plans around it 20:26, 20:33, 20:37. That is his reasoning, not an independently tested finding, and the recording offers no comparison against a fundamental approach.
Bonds and stocks, and the yield mechanism behind them
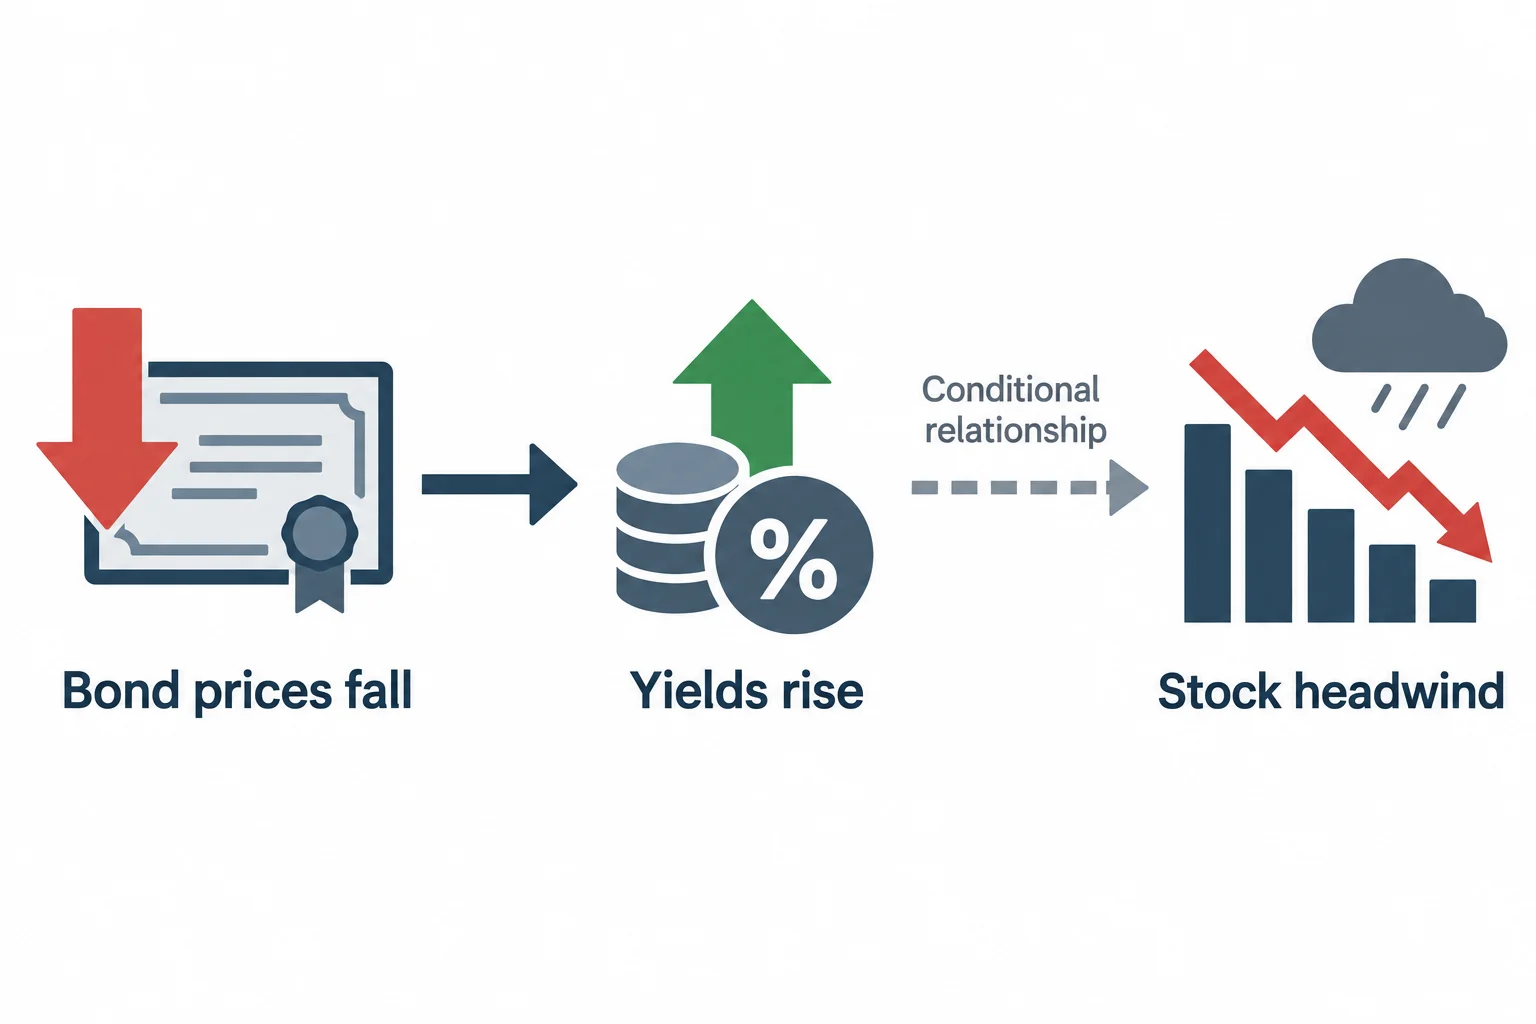
The first relationship he walks through is bonds against stocks, which he describes as generally moving together 5:03, 5:10. If the Treasury bond market is rallying in an uptrend, he treats that as helpful and supportive of a bull market for stocks 5:16, 5:22. Conversely, when the bond market is in a downtrend he says it will be very hard for stocks to rally in that environment — not impossible, but he describes the bond trend as a weight on any stock rally, with the stock market eventually having to correct back into alignment with the overall bond trend 5:28, 5:33, 5:43.
He spells out the mechanism so the direction of the signal is unambiguous: bond prices falling means interest-rate yields increasing, and stocks do not like higher rates 6:45, 6:54. That is why falling bond prices and rising yields are read as a headwind rather than a tailwind.
From there he extends the same idea to how a stock trader could use it. He says you have to constantly refer to the market indices for stocks and to the bond market, and that a stock trader can use the information taken from bonds as an indicator of underlying strength; bond prices going higher is the condition in which he says a buyer of stocks can go in with confidence that lower interest rates and rallying bond prices sit behind them 6:15, 6:22, 6:27, 6:34. He then names the bond market, or the 30-year benchmark, as a leading indicator for stock direction, with the same six-to-twelve-month possibility for long-term trend changes to show up in stocks 13:48, 13:53, 13:55, 14:02.
He attaches one caveat to the bond-stock relationship, and calls it a rarity: deflationary periods, when prices are decreasing. He says this was indicated in the markets in the latter part of 1998, that it does not happen often, and that in such a period bonds perform very well because the interest-rate markets are collapsing — bond prices higher while stocks go lower and commodities go down 14:18, 14:20, 14:27, 14:44, 14:50. He adds that he does not imagine seeing a deflationary period again anytime soon, which is his personal expectation rather than anything the recording establishes 15:01.
Bonds against commodities, and the inflation reading
Bonds and commodities he describes as inverse as well, moving opposite each other. Bond prices trading higher is paired with commodities moving lower, and bonds trending lower is what he says allows commodities to rally 9:30, 9:35, 9:41, 9:51. What he says he is really watching in that pairing is inflationary impact, and he calls commodities the leading indication for inflationary environments 10:05, 10:10, 10:18.
He puts a number on the delay here, and it is the largest in the lesson: because these are long-term macro relationships, a change in trend between bonds and commodities can take six to twelve months to appear, so commodities may turn up and bonds turn lower later as a result, or the reverse 10:26, 10:32, 10:38, 10:45. He stresses that it does not happen step for step and gives no immediate feedback, and that the effects of interest-rate changes or of supply and demand in commodity production and consumption take a long time to work through 11:00, 11:08, 11:11.
He closes that section with the summary he wants remembered: bond yields going higher means bond prices going lower, and he says that pushes commodities up; bond yields going down means Treasury prices going higher, which pushes commodities down 12:54, 12:59, 13:05, 13:10. For measuring it he names Treasury bonds against the CRB index 11:28.
Which commodity benchmark you use changes the answer
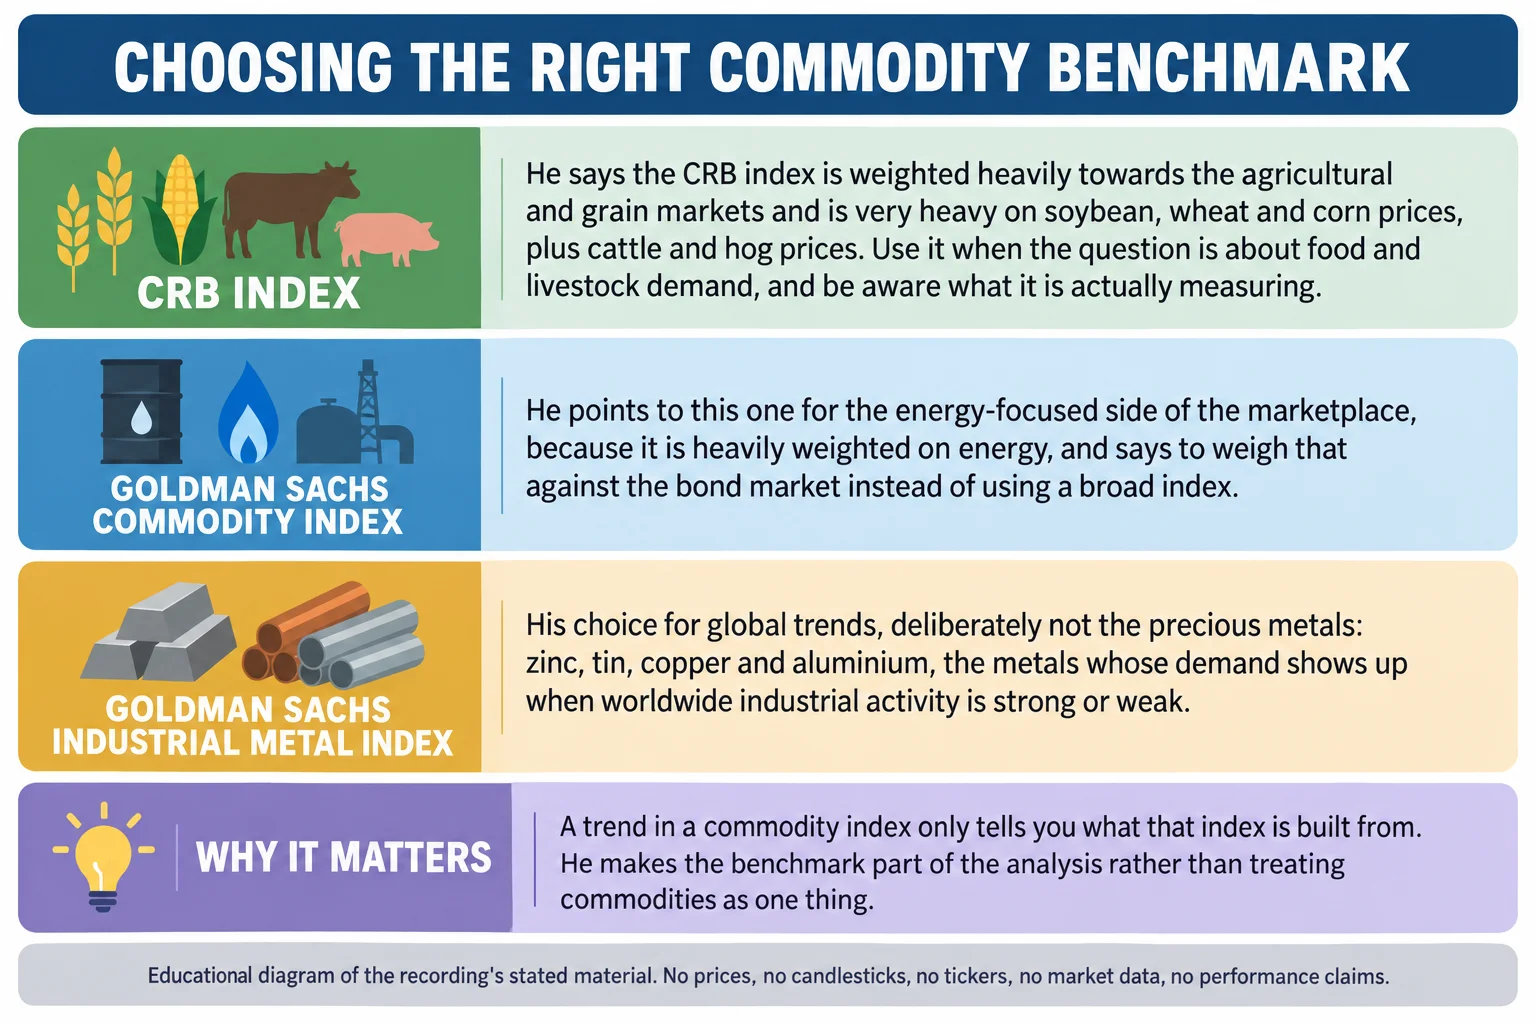
This is the most practical passage in the recording, and it is why he tells viewers to keep the weighting of each index in mind. The CRB index, he says, is weighted with the agricultural and grain markets and is very heavy on soybean, wheat and corn prices along with cattle and hog prices 11:32, 11:38, 11:42, 11:51. When he wants the energy-focused side of the marketplace he says to use the Goldman Sachs commodity index instead and weigh that against the bond market, because it is heavily weighted on energy 11:57, 12:04. For global trends he points to the Goldman Sachs industrial metal index, and he is explicit that it is not for silver, palladium, platinum or gold: the metals in it are zinc, tin, copper and aluminium, the industrial ones, so a large worldwide demand for industrial metals shows up there and a lack of it does too 12:09, 12:17, 12:25, 12:34.
He also gives a source for the CRB data, naming crbtrader.com, and says the PDF accompanying the lesson carries more detail on everything covered 9:09, 9:17, 9:21. The lesson states the weights but does not publish them numerically, so no percentages are claimed here.
The dollar index against commodities and the export channel
He describes the first relationship in his own list as the US dollar against commodities, presented as inversely related: whichever direction the dollar index moves, commodities as a group move the other way, so a rising dollar index is paired with commodities trending lower and a falling dollar index with commodities going higher 7:23, 7:29, 7:40, 7:45.
He then gives the reason it matters for specific markets rather than just as a statistic. Grains and agriculturals are export sensitive: a strong dollar diminishes demand for grain and livestock exports, and a weak dollar index instils increased demand for grain and agricultural exports 7:59, 8:06, 8:12, 8:21. He links the dollar in three further directions — a rising dollar index alongside stocks and bonds moving up, a falling dollar index alongside stocks and bonds trending lower, and a dollar index moving higher with commodity currencies moving lower or lower with a commodity currency rallying 8:31, 8:44, 8:54, 9:01. For measurement he suggests the US dollar index against the CRB index 9:09.
These are stated as broad macro tendencies. The recording does not demonstrate them on a chart, does not define how quickly any of them should be expected to show up, and does not test them, so they should be read as his framework rather than as established behaviour.
The confirmation list he actually checks
Towards the end he gathers the relationships into a short list of pairings, and this is the part of the lesson that reads closest to a checklist 15:09:
- A bullish dollar index pairs with bearishness on gold, and bearish gold is in turn described as usually bullish for USD/CAD 15:15, 16:03.
- Bullishness on gold pairs with a bullish New Zealand dollar, which he attributes to its nature as a gold exporter; the audio pass clips the country name, so that reading comes from the surrounding words rather than from a clean transcription 15:20.
- Bullish oil pairs with bearish USD/CAD, which he attributes to Canada’s oil export leadership 15:28, 15:34.
- A bullish Dow pairs with a bullish Nikkei index, described as a direct relationship, and that pairing is described as bearish for USD/JPY 15:34, 15:44, 15:51.
- Falling yields are described as bearish for a currency on the reasoning that money seeks yield 15:57, 16:03.
His stated purpose for the list is confirmation rather than entry. If a number of these relationships line up with the long-term analysis, he says you are probably looking in the right direction, and that it is rare to see a wide disparity with all of them failing to align; with a good sample size in agreement he expects the long-term analysis to pan out 16:14, 16:19, 16:24, 16:37, 16:43. Notably absent is any definition of how many relationships constitute a good sample, which is a judgement the viewer is left to make.
The limits: timing, drawdown and the human element
The passage he seems to consider most important is about what the framework cannot do. He calls timing the problem, saying that long-term trend trading and long-term analysis are, in his opinion, among the hardest things to time, largely because it is hard to get traders to accept more movement against their entry point 16:53, 17:02, 17:08. His explanation for why that is tolerable connects to why someone trades higher time frames at all: home life and time constraints often keep a trader from managing a lower-time-frame entry, which forces execution off the daily chart, and daily execution means permitting a great deal more adverse movement in the stop because the ranges are larger and the holding time is longer 17:14, 17:20, 17:26, 17:31, 17:35.
He then states the limits without hedging. He says the information helps build probabilities in your favour and is useful whether you day trade, scalp, swing trade or position trade, and immediately adds that nothing in the material equates to certainty and that nothing out there cannot change on the drop of a hat 17:46, 17:58, 18:02, 18:08, 18:16. He names the analyst as the human element and says there is always one involved, that what you think you see in the charts can always be wrong 18:21. He argues the same lagging effect that affects fundamental data applies here, and that just because the fundamentals suggest a market should be bullish does not mean it goes straight up tomorrow 19:18, 19:24, 19:28.
What the lesson does not contain is worth stating as clearly as what it does. There are no entry criteria, no stop rules, no position-sizing method, no account risk limit, no defined threshold for how much alignment is enough, no transaction costs, no maximum attempt count and no reported results of any kind. It is a conceptual lecture, he says so at the start, and he repeats at the end that it is not flashy material with Judas swings and patterns but is meant to describe how the markets tie together 19:56. Nothing here is investment advice.
Watch the original recording
ICT Mentorship Core Content – Month 05 – How To Use Intermarket Analysis
The Inner Circle Trader · watch page lists upload 14 September 2022 · about 21 minutes 27 seconds. The speaker opens the recording as lesson three of the January 2017 content. This recording is the primary source for every timestamp link above.
The recording is not embedded here. The upload’s own watch page reports the video as not playable in an embed, and an embed attempt tested directly on 17 September 2026 from a BestProps page origin at both desktop and mobile widths stops at a video player configuration error carrying error 153, with no duration and no playback progress, while the video itself plays normally on YouTube. No half-working player is left on this page.
The watch page was read on 17 September 2026 and is publicly listed as ICT Mentorship Core Content – Month 05 – How To Use Intermarket Analysis by The Inner Circle Trader, upload date 14 September 2022, not private and not unlisted, with a listed duration of 1,287 seconds — about 21 minutes 27 seconds, against a transcribed audio duration of 1,286.9 seconds.
A note on the transcription
There was no usable caption track for this recording, so the transcript behind this article is an automatic speech-recognition pass over the full original audio, not human-verified captions and not YouTube’s own captions. The pass covered the complete audio and reported no low-confidence stretches, but a machine transcript still mishears terms. Two are worth naming because they sit inside load-bearing statements: the deflationary period discussion renders the word as “devlationary” once, and the New Zealand dollar reference clips the country name to “Zealand” 15:01, 15:20. The phrase he uses when he says nothing equates to certainty is also garbled at the point of recording it 18:08. Index names, the six-to-twelve-month figures and the commodity weights all come from his spoken words and are reported as such. Nothing in this article is taken from anywhere other than the spoken content of this recording, and this review did not view the recording’s charts: there are none in this lesson, as he says himself.
Resources
These are the sources checked while preparing this article. The regulator and market pages are general material about how trading systems and cross-market claims should be assessed, and about the official data behind futures markets; none of them evaluates this speaker, verifies the bond-stock, bond-commodity or dollar-commodity relationships, the six-to-twelve-month lead-and-lag window, the index weightings or the confirmation list above, and none endorses anything said in the recording. Any ICT, smart-money or third-party indicator, script, no