
Key takeaways
This recording identifies itself as lesson 1.5 of the mentorship and names its subject as defining institutional swing points 0:11.
Read the full summary
This recording identifies itself as lesson 1.5 of the mentorship and names its subject as defining institutional swing points 0:11. He warns at the outset that he will not draw any charts or pull up any examples and wants the material understood conceptually, as “what’s going on behind the scenes” 1:28. His claim is that turns in the marketplace come in only two forms: a stop run, which he calls the breaker swing point, and a failure swing 1:37. In the breaker he describes price running an old high or an old low, rejecting, then breaking the short-term swing that formed in between; that break of the intervening swing is what he labels the market structure shift, and a return to it is the entry he wants 9:46. The failure swing is the same picture without the second pass through the level: price trades through a level, breaks away, comes back to retest it and cannot make another pass, so the preferred breaker entry never appears and he says he waits instead for the nearby short-term swing to be broken, then trades the return to it 19:35. The lesson is presented without charts, and he concedes that the developing retracement is a grey area he cannot know in advance 23:35. Every statement about institutional intent is his interpretive framework rather than an established fact: the recording shows no price, no order, no fill and no result.
How we researched this article
BestProps used document-based research from primary firm sources, checked September 24, 2026. The complete source list, scope, limitations, and commercial-state record appear near the end of this article.
What This Recording Is, and What It Refuses to Show
He opens by naming the lesson and the topic together: lesson 1.5, defining institutional swing points 0:11. From there the framing is deliberately abstract. He says he does not want to draw charts, does not want to pull examples up, and wants the viewer to think about the subject as a concept instead 1:28. Later in the same stretch he repeats the point by asking the viewer to think about what is going on behind the scenes 1:26. Nothing in the recording is a chart being read: the description is entirely verbal, and no price, instrument, timeframe or date is attached to any of the illustrations he refers to.
Before the framework, he restates the ordinary definition he says he learned from his mentor Larry Williams: a swing high is a high with a lower high to its left and a lower high to its right, and a swing low is the mirror image, each one a three-bar pattern, and he calls it simple 0:32. He adds that plenty of the elaborate patterns he came across during his own development were, in his words, fun to read about initially but did not deliver much in the way of future prognostication 1:02. The lesson is not about those. His purpose is to sort turning points by what he believes is happening behind them rather than by their shape.
A sourcing note belongs here because it changes what can be claimed. The transcript used for this rewrite is automatic local speech-to-text of the recording’s own audio (Whisper large-v3-turbo), not human-verified captions, so a misheard word cannot be ruled out and no chart, level, order or result has been inferred from it. The download passed the integrity checks — the decoded audio is complete against the listed duration of 1,977 seconds — and the audio ran to 1,976.7 seconds, and no segment was flagged low-confidence. Where a spoken term is ambiguous the ambiguity is flagged in the text rather than silently corrected.
Two Forms, and Only Two, in His Framing
His organising claim is blunt: there are really only two forms of swing points in the marketplace, a stop run or a failure swing, and he presents the rest of the lesson as the contrasting differences between them and what he says makes each one an opportunity 1:37. He is explicit that the first form he teaches is the one he trades predominantly because it is built around the pattern he says he likes, which he calls turtle soup 17:41.
The Breaker Swing Point
The breaker is the pattern in which, as he describes the selling case, price makes a higher high and then fails, breaks down and is rejected back at the highs 2:17. He says this is the result most traders have met at some point in their development: they buy a level expecting higher prices, it moves their way initially, and once a new higher high is made it breaks lower aggressively; or they sell a low, feel good as it breaks lower, and then a small move below a previous low turns into an upside explosion that traps them or stops them out 2:30. In his words this is the most powerful, most dynamic and most significant of the price patterns he wants the viewer to learn conceptually 3:01.
The location he attaches to it is an area of old resistance, which for him can be a bearish order block, a breaker, a mitigation block, an old low or an old high that price is returning to 3:18. His description is that price may fall short of that level by only a few pips or points and start to trade lower, which is the point at which he says he and most retail traders expect the decline to begin in earnest 3:37. Instead, price makes one more pass higher, driving out the short-term high it just created, spooking the market and upsetting traders who are already short 3:56. What it reaches, in his reading, is the level that should have been traded to the first time: a resistance level, a bearish order block, or a gap being closed 4:07.
This is where the reference points he taught earlier come back in. He lists the bearish and bullish order blocks, liquidity voids and fair value gaps from the September material, says these appear on the chart as levels delineated by blue lines in his diagrams, and tells the viewer that he anticipates price trading to them or into them a little 4:18. The short-term high that forms before the higher high is, in his account, what catches most traders, and the bearish order block often sits just above it: either price did not quite trade to it, or it left a small fair value gap, and price falls short of filling it before driving up and closing that range 5:00.
His justification for the name is structural. The pattern creates a short-term low between the new higher high and the previous high, and when the market breaks down and takes that intervening low out, he reads it as having broken the traders who were initially short 5:29. What he says the trader should take from that is the opportunity for the market to move aggressively away from the level after what he calls an initial fake out, with buy stops as the further target 5:52. He also claims frequency for it: the pattern, he says, materialises every single day and in every single pair, and he tells the viewer to study how it manifests on every timeframe 6:42.
The Bullish Mirror
The buying case is described as the same thing in opposite terms: he wants to see a short-term low form at or just above a key support level, which could be a bullish order block, a liquidity void that had not filled in on an earlier pass, or an old low that simply gets run below 13:10. On the age of that old low he is permissive: there is no time limit between the old low and the new low that forms, and he offers six months as an example of a gap that is still the same pattern when it finally trades below and runs 13:24. Ideally, though, he wants something recently created, where price came back for a few days or about a week and then drives one more time 13:46.
His reading of the other side of the book is the same idea inverted: the buyers at that little top have their protective sell stops just below the low, and he wants to think institutionally about accumulating those orders, so if traders are going to sell to him there he is a buyer, buying at what he calls a deep discount 14:18. The condition he emphasises is the response rather than the level: he wants an immediate move away from it, and he does not want price to trade down and hang around 14:40. He is honest about the cost of that on a daily chart, because as a position trader the confirmation can take a long time — possibly the entire daily range before the candle prints the wick 14:52.
That leads to one of the sharpest distinctions he draws in the lesson. Candlestick traders, he says, trade the candle after it has formed, and he names the hammer and the doji as the shapes people get excited about 15:18. His claim is that the institutional trader takes the same candle while it is still, in his phrasing, a bold-faced candle, before it becomes the wick or the hammer or the doji 15:36. He also notes the retail alternative directly: if a trader demands confirmation, the entry down at the low is not going to be available, but a favourable entry can still be had by waiting for the market structure shift 15:58.
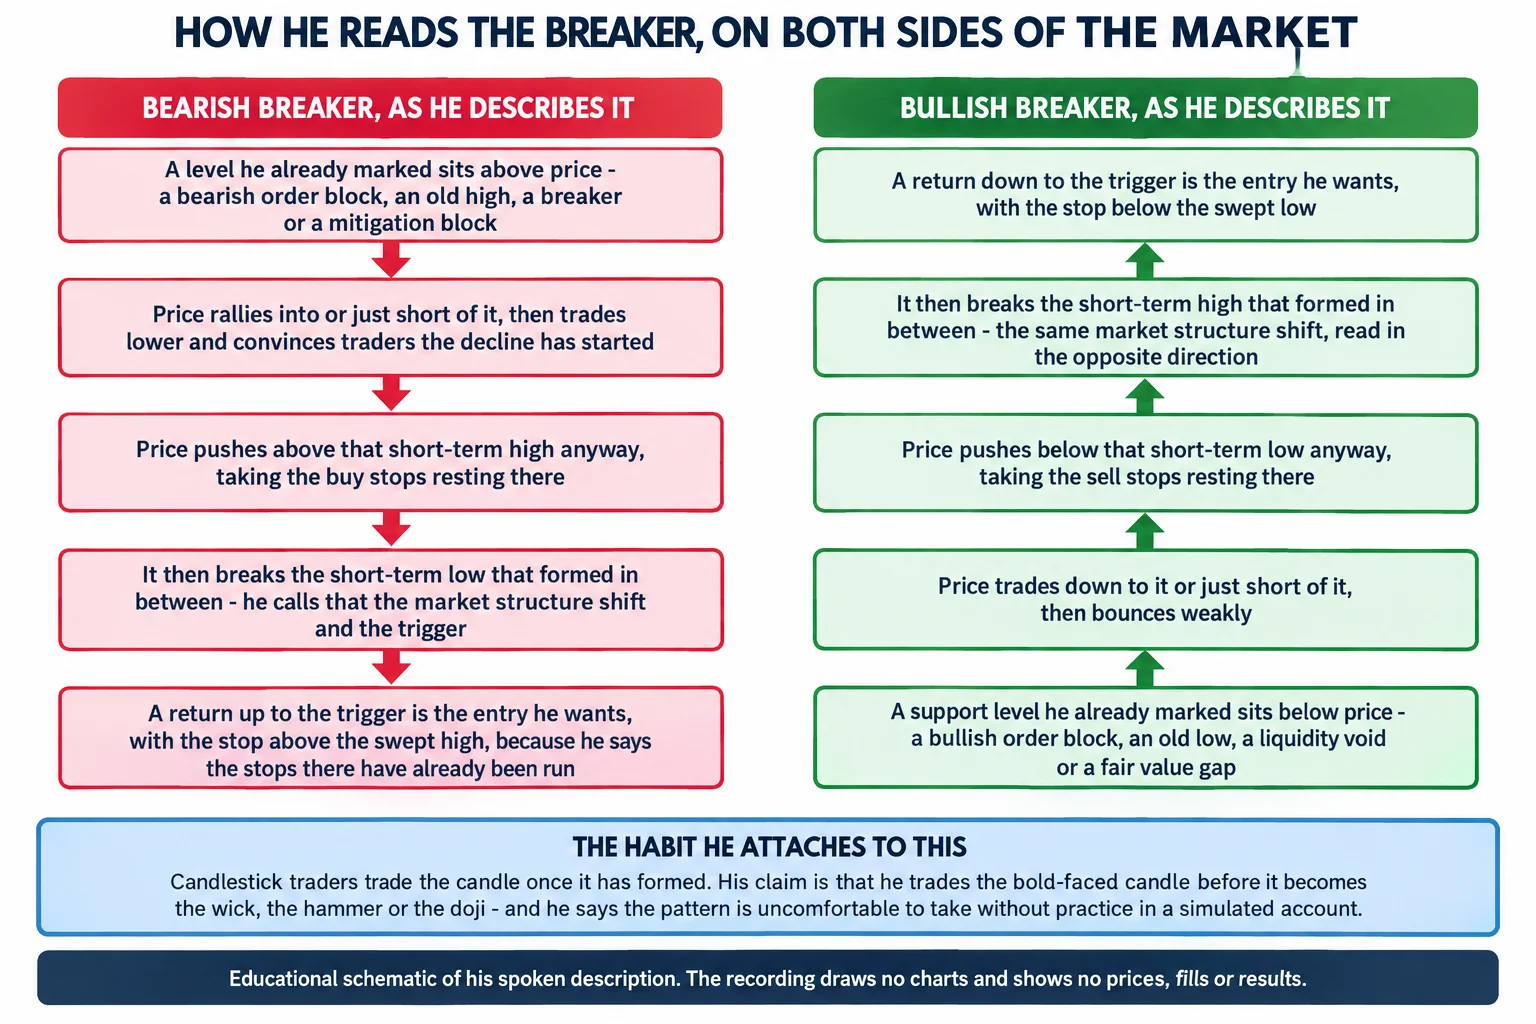
What makes the return worth waiting for, in his account, is the stop that becomes available. Once the high has been broken and the intervening low taken out, the market structure shift becomes the trigger, and a return to that level is where he would sell 9:46. Because the stop run has already happened, he says he can hold a stop above the high, or right at it, with confidence that the market will not come back for traders it has already knocked out 11:18. The mechanism he gives is that the drop lulls traders into believing the decline has started, their buy stops end up just above the high, and the pass-through clears that buy-side liquidity so new shorts can be engineered on the return 11:45. He calls this the highest-probability condition for short selling because it carries a built-in advantage, while conceding that selling above an old high is the most fearful thing for a trader who has not practised it 12:34.
Why He Calls It a Two-Chance Setup
He describes the breaker as a turtle soup trade in his own terms: a false break above an old high, rejection and then a quick move away, with a second chance to get in if the first entry is missed 17:45. He points out that two chances are not the norm — usually a missed trade is either gone or taken at a loss 18:05 — and calls the pattern the best one in market structure for locating the lowest point at which to buy and the highest point at which to sell, adding that it takes conviction but does not demand it, because the trader can wait for the break of market structure instead 18:32. He follows that immediately with the contrast that sets up the second form: the failure swing does not extend the same forgiveness 18:53.
The Failure Swing
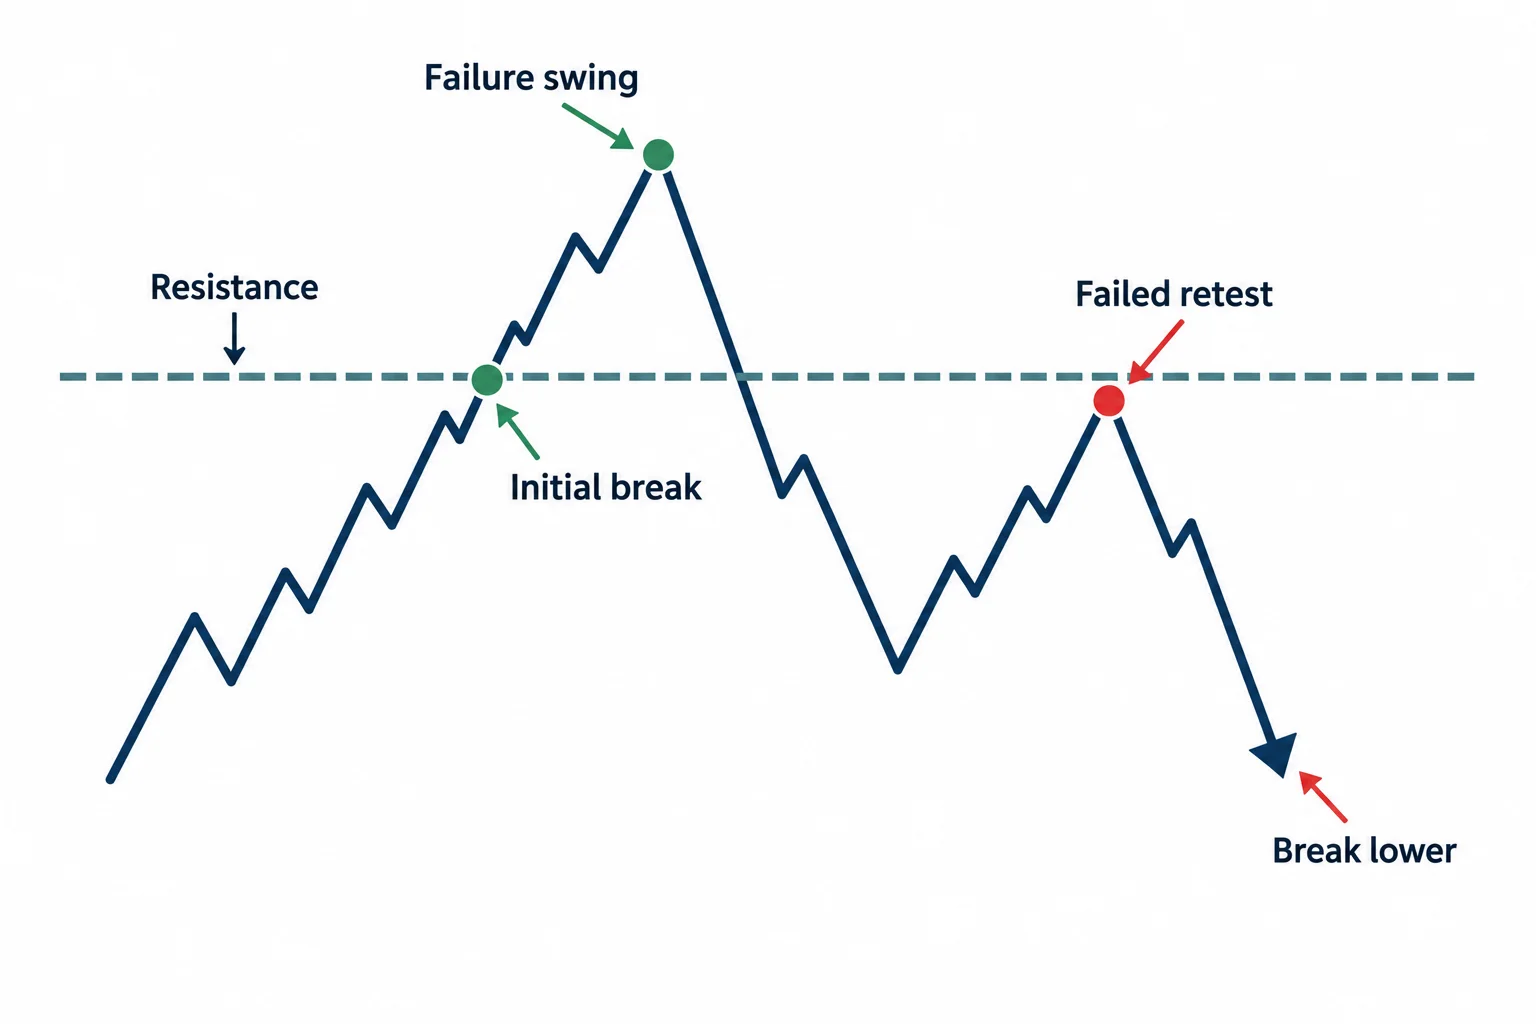
The second category is defined by an absence. A failure swing is when there is a resistance level, price trades through it, breaks down, comes back and retests it, and cannot make another pass through 19:35. He notes that it makes no difference whether price touched the level and then failed to return to it or simply fell short of the level entirely: the same conditions apply 19:51. He also narrows the whole exercise at this point to two ways of viewing the marketplace when it turns 19:25.
What makes this category difficult, in his framing, is that a trader can be waiting for the ideal breaker and never get it. He says he never knows with real conviction whether the breaker will set up, so while the move unfolds a trader might be anticipating a high being taken out in order to sell it, and instead price comes up, falls short and breaks lower — a missed opportunity, and not the same as the absence of an opportunity 20:16. The buy side is the same in reverse: a support level may be represented by a line right at the low, and the question he is waiting on is whether price makes another pass through and retests it 20:58.
His stated fallback assumes the same underlying mechanic. If a trader gets the buy setup, price retraces from the level where support was expected, comes back down, fails and makes one more pass up, then the break of the short-term high — or of the short-term low on the sell side — is another opportunity 21:37. His reason is that the market has already shown a willingness to run an area of liquidity out and to trap traders on both sides, leaving sellers stuck below and buyers stuck above while it reprices quickly 21:56. To make that concrete he points at the turtle-style long-term position traders who sell on a breakout, selling below 20-period lows and buying above 20-period highs, and says the pattern he is describing is what it looks like when those traders are moved away from a low aggressively, come back without making a new low, and then break through a short-term high in an area where he expects bullishness 22:37.
He is candid about the limit of what he knows here. The retracement itself, he says, is a grey area: he does not know whether it will stop or continue up into a breaker swing point, and he does not know whether the sell-side version will continue lower 23:35. He states plainly that he never knows it for certain, that he is looking for the most optimal entry and may not get it, and that he can read it wrong just as anyone can 23:57. When that happens his answer is mechanical rather than predictive: he waits for the nearby swing point to be violated and then aims for the level 24:37, placing the protective stop on the far side of the low or high that has already been used for stops 25:26.
He then generalises the whole picture into an institutional story, which is his interpretation rather than something the recording demonstrates. Institutions, he says, go into the marketplace to trap or to knock off — they are in the business of taking the funds out when they are going to be right, and of putting them on the wrong side when their pending orders allow it 25:53. His illustration is a fund with buy stops that reads as a long-term trend-following buy programme; in his telling the stops are driven into, the resulting market buy orders are sold into, the market is repriced aggressively lower and the position flips short 26:11. The reverse case is described the same way: a quick repricing higher forces shorts to buy back at a higher price, letting the position accumulated below be scaled out at a profit 28:18. He repeats that he may read it wrong, and that missing the scenario simply means waiting for the break and selling the return 26:37.
Where He Puts the Stop, and Why He Insists on the Levels
The practical content of the lesson is mostly about where the protective order goes. In the failure-swing version, if the trader is selling the return to the level, the buy stop can sit just above the short-term high, inside the area where buy stops have already been run 24:48; if buying the return after a high is broken, the stop-loss can sit just below the low that has already been used to collect sell stops 25:32. He treats that prior manipulation as the reason the level should hold rather than as a probability estimate, and says the magnitude of the move away from the level is what indicates how many orders are trapped on the wrong side 27:57. He also concedes the honest failure case: if price comes back anyway, the trader is probably wrong and wants to be out 27:16.
The other insistence is that the institutional reference points be on the chart before any of this is evaluated. He says the levels have to already be outlined, because otherwise the trader will not be able to capitalise on what the pattern offers 7:40, and elsewhere that the levels are what allow the pattern to be anticipated rather than suffered as a surprise 9:14. His list is consistent across the lesson: bearish and bullish order blocks, breakers, mitigation blocks, old highs and old lows, liquidity voids and fair value gaps 9:01.
What the Lesson Claims, and What It Does Not Show
He closes by compressing the framework into a claim about completeness. He says the breaker is the ideal and most optimal entry pattern there is, because it is described as the deepest discount at which to buy and the most premium at which to sell, and he calls it scary and uncomfortable when a trader first attempts it 29:10. His recommended route through that discomfort is a demo account: he says the trader has to step in front of the market as it rolls into a new high or an old low, see the immediate feedback, and learn from being wrong quickly with a relatively modest stop rather than a hundred-pip one 29:42. He also rules out the classical catalogue — head and shoulders, bull flags and bear flags — and says there are only two ways the market turns, one a breaker where stops are run and the other a failure swing 30:28.
The strongest form of the claim is unfalsifiable in the way he states it: he says it is either a breaker or a failure swing every single time and invites the viewer to show him a case where it is not 31:13. Read carefully, the two categories cover both a level being swept and a level not being swept, which is why the framework can be presented as exhaustive; it is a description of turning points rather than evidence about who caused them. Nothing in the recording supplies a chart, a price, an order, a fill or a result, so the claims about stop runs and trapped funds cannot be checked against the source, and he himself frames the read as fallible and the retracement as a grey area 23:35.
What the lesson does provide is a consistent decision structure, and it is worth stating in his own terms rather than as a recommendation. As a seller he offers two options: sell the run above an old high, or sell the retracement back to a break in market structure 31:31. As a buyer he offers the mirror: buy the run below an old low, or buy the return to a market structure break at support 31:36. He reduces the whole exercise to knowing where the orders sit relative to old institutional order flow reference points and key support and resistance on higher timeframes, and to reading how the market behaves at that level — whether it passed through it and rejected, or fell short and made one more pass that might produce the breaker entry 32:04. He ends by telling the viewer to do this in a demo account rather than rushing live money, and to learn the characteristics of the two theories first 32:23.
Key Takeaway
The framework as the recording states it, with the caveats kept attached:
- He sorts institutional swing points into two forms only: a breaker, where a level is run and rejected before the intervening swing breaks, and a failure swing, where the level is retested and cannot be passed again 1:37.
- The trigger in both cases is the loss of the short-term swing that formed between the two extremes — the market structure shift — and the entry he wants is a return to it 9:46.
- The reference levels are a precondition, not a detail: order blocks, breakers, mitigation blocks, old highs and lows, liquidity voids and fair value gaps have to be marked before the pattern is evaluated 4:18.
- The protective stop goes beyond the high or low that has already been used to collect stops, on the argument that the market has no reason to return for traders it has already removed 11:18.
- He does not present this as certain: he says the retracement is a grey area, that he can read it wrong, and that the ideal breaker entry may simply never arrive 23:35.
Watch the Original Recording
ICT Mentorship Core Content – Month 05 – Defining Institutional Swing Points
The Inner Circle Trader · uploaded 13 September 2022 · listed as PT1977S, about 32 minutes 57 seconds. This recording is the primary source for every timestamp link above.
The recording is not embedded here because the video owner has disabled playback on other websites. That was tested direct