
Key takeaways
This is lesson 6.1 of the 2017 mentorship content, and its job is to put the higher-timeframe arrays he has already taught into a fixed order rather than a loose collection (0:16, 2:18).
Read the full summary
This is lesson 6.1 of the 2017 mentorship content, and its job is to put the higher-timeframe arrays he has already taught into a fixed order rather than a loose collection (0:16, 2:18). The starting move is to outline the current trading range using the most recent move between an old high and an old low on the monthly chart, and to call the halfway point equilibrium (17:31, 18:04). Above equilibrium is premium and below it is discount (9:30, 9:50). His premium list, read from the deepest premium down toward equilibrium, is old high or old low, rejection block, bearish order block, fair value gap, liquidity void, bearish breaker, then mitigation block (18:26, 19:07, 19:21); the practical search order when price is near equilibrium and moving up is the reverse, starting at the nearest mitigation block (19:47, 20:53, 24:42). The discount side mirrors it: mitigation block, bullish breaker, liquidity void, fair value gap, bullish order block, rejection block, then an old low or a historical high sitting in discount (27:24, 29:20). He gives breakers special precedence, saying a breaker takes priority over everything else on the list relative to price and that a void or gap above it will most likely stay unfilled (21:31, 31:46). He applies the same hierarchy unchanged to weekly and daily charts (30:23, 31:18), and he is explicit that time and price both have to be submitted to because nobody knows how long a move takes and price can go part way and fail (13:07, 16:54, 17:04). The source is automatic local speech-to-text of the recording with no low-confidence characters flagged, not human-verified captions, and no prices, entries, fills or results are recoverable from it.
How we researched this article
BestProps used document-based research from primary firm sources, checked September 24, 2026. The complete source list, scope, limitations, and commercial-state record appear near the end of this article.
What this lesson is for
He opens by naming the lesson and the problem it solves. The framing question, in his words, is that when a trader looks at any chart two ideas come to mind — support and resistance, or bought and oversold, or price being too cheap or too expensive — and he says the algorithm has similar concepts built into it as premium and discount (0:16, 0:56). The problem he identifies is that technical analysis alone leaves everyone with a different idea of what counts as resistance: one trader sees an old low, another an old high, another something else (1:30, 1:52).
The stated fix is a mindset rather than a new indicator: he says that to remove the ambiguity you need a framework going in, and that this lesson teaches the hierarchy he uses for framing trades (1:57, 2:04). He stresses that the arrays themselves are not new — they are the same tools he has used since the start of the mentorship — and that what changes is that they are being put in an order so they are not used in a disorganised fashion (2:10, 2:21).
A sourcing note belongs here because it affects how the lesson should be read. The transcript used for this article is an automatic local speech-to-text pass over the full audio, not a human-transcribed caption track. Its integrity checks passed — complete audio, no low-confidence characters flagged — but automatic transcription of this kind of material can still mishear specialised vocabulary, and one such case is flagged below. Nothing that could not be established from the words spoken was reconstructed from the charts, and the charts he is pointing at throughout were not available to this review.
He also sets the scope deliberately. The focus is higher-timeframe analysis and nothing below the daily chart, because he is treating the arrays as a way to frame a market rather than as an intraday trigger (6:33, 6:37). He notes that levels exist inside large candles and swings that will not be visible unless you drop to a lower timeframe — a daily short-term high inside a monthly low, for instance — and says that is not what the majority of trades should be based on (6:03, 7:23). Monthly and weekly charts are what frame the context of what the market should be doing using these arrays (7:29, 7:35).
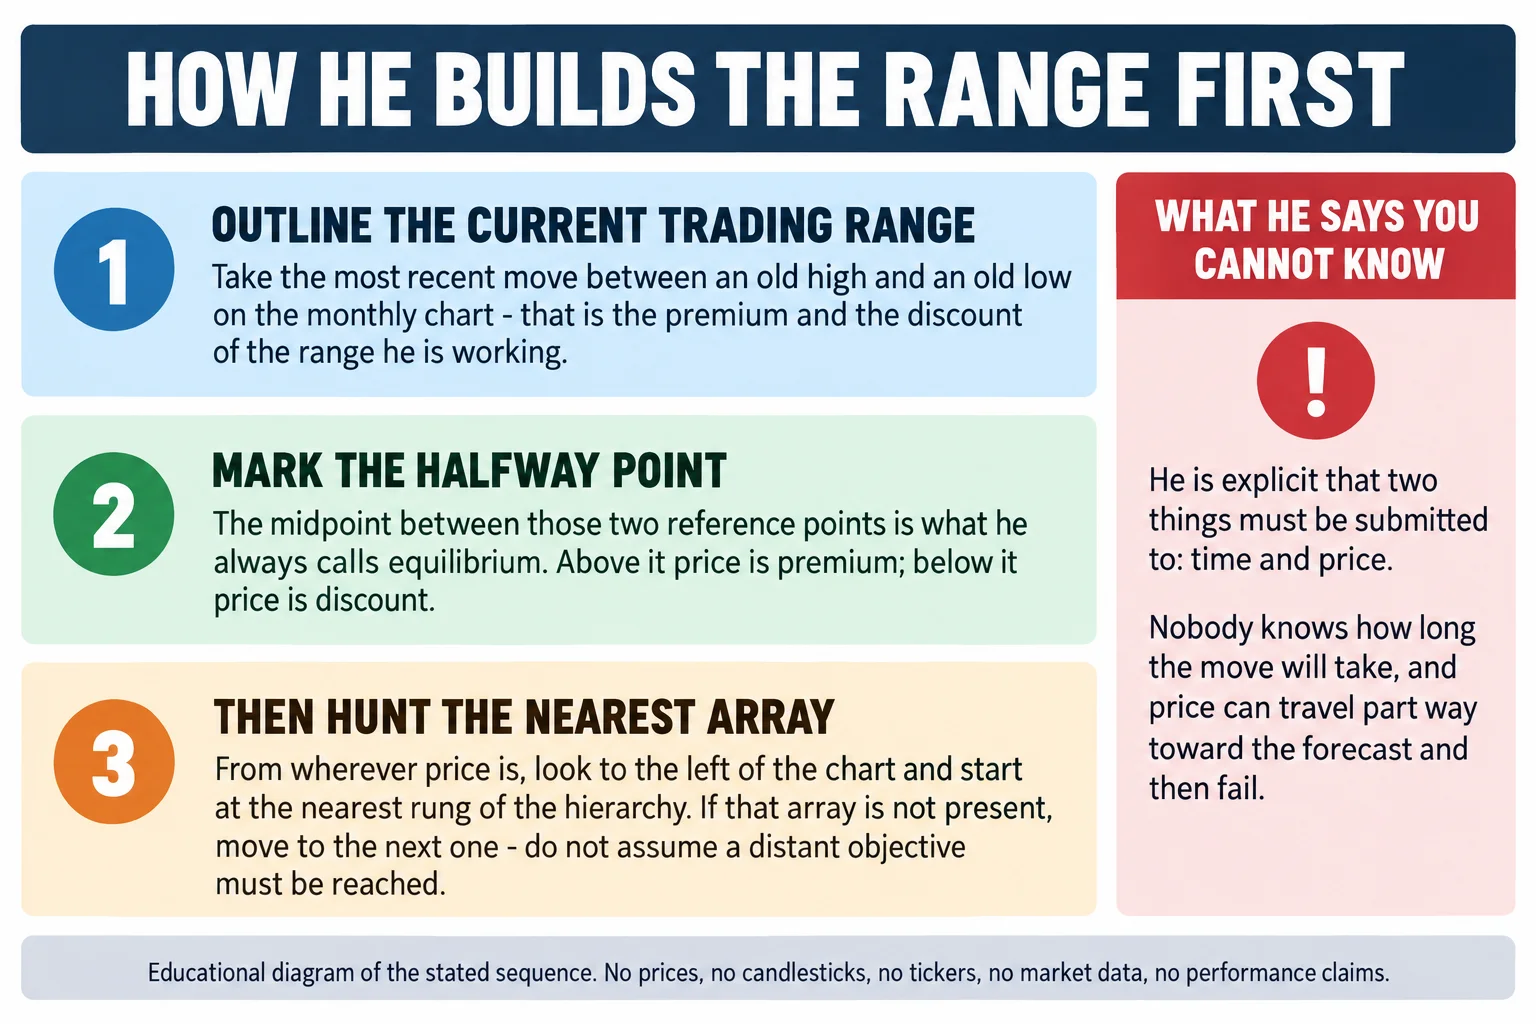
He is equally clear that the framework does not remove uncertainty. He separates what he calls the two elements a trader has to submit to: time, which nobody knows, and price, which is what you study while you wait (12:47, 13:56). He says a forecast can fail — in his words, just because you think price is going there does not mean it is; it could go halfway and fail and go lower (16:54, 17:00, 17:04). He also rejects the idea that knowing direction is sufficient, saying a trader would still find another way to lose money through over-leveraging or breaking rules and would end up blowing the account (3:27, 3:48).
Step one: define the range, then equilibrium
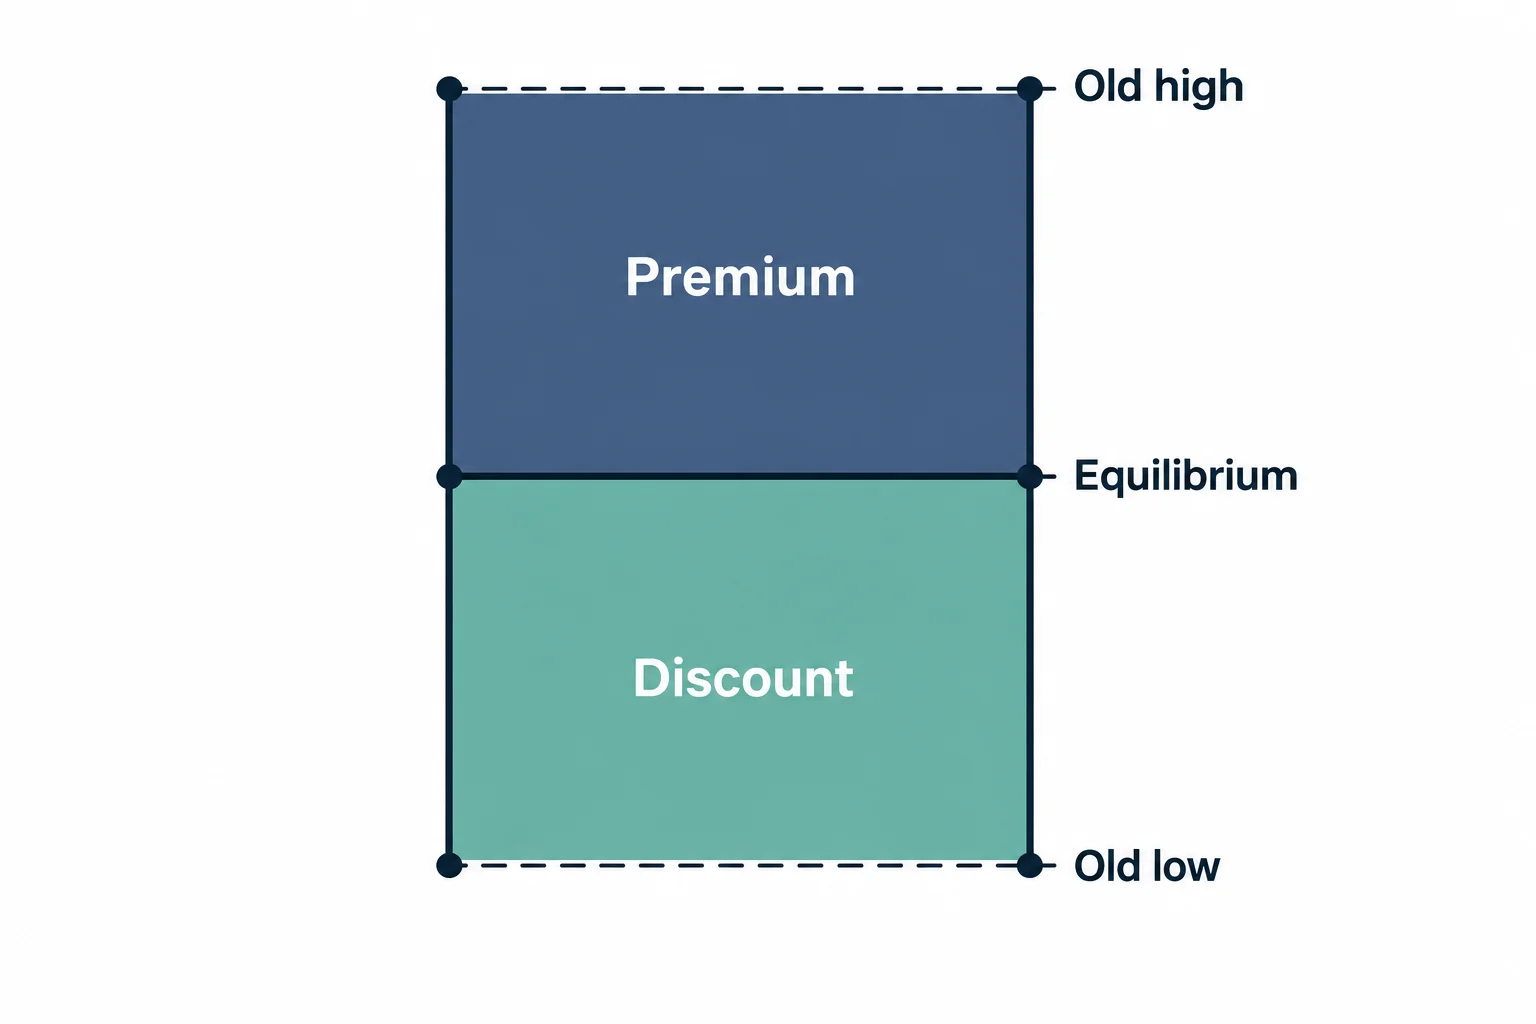
The mechanical part of the lesson starts with the range rather than with an array. On a monthly chart he says to look at the current trading range, and the easiest way to outline it is with old highs and old lows — specifically the most recent trading range that the market has moved from an old high to an old low (17:31, 17:50). Those two reference points define premium at the top and discount at the bottom, and the halfway point between them is what he says is always referred to as equilibrium (17:55, 18:04, 18:10).
He describes equilibrium as the balance point between the two extremes: price above equilibrium moving into the upper extreme is what he calls buying imbalance or premium, and price below equilibrium moving into the lower extreme is selling imbalance or discount (9:30, 9:54). He then frames the whole exercise as a question a trader asks constantly — where would you expect price to go next (9:59, 10:03).
He gives the reason the range matters in the first place, and it is valuation rather than geometry: when price has moved away from an old high and is dropping from a premium area it is, in his words, too high, so valuation is reduced and price is repriced lower until it becomes too much of a discount, at which point a premium has to be built back in (11:18, 11:39). His description of the algorithm is that it moves price back and forth like that until something of significant impact drives the market one-sided and creates a strong imbalance; otherwise it gyrates looking for liquidity based on premium and discount conditions (11:44, 11:59). He places central banks in that picture as the entity adjusting price over the long term through interest rate policy, and says technical work is how a trader aligns with that (15:56, 16:32). That causal story is his interpretation of how price is set, not something the lesson demonstrates.
Why the same array can be premium or discount
Two qualifications in the lesson stop the list from being read mechanically. The first is that the label depends on the range you chose: he explains that an old low appears in the premium list because on the lower end of a higher-timeframe downtrend, price may rally a considerable distance up to an old low, and even though it is an old low by price it is high up in the premium of the active range (23:14, 23:47). The second is that these are graded rather than binary: he describes the exercise as scaling the grade of how much importance to place on each array (23:52, 23:57). He summarises his own intent explicitly — that he is not just relisting things from earlier teachings but putting them in an order of significance (23:57, 24:02, 24:06).
He applies the same logic to the target-side of a trade. If the expectation is lower prices into discount or support, the first array he expects to encounter is a mitigation block, with a bullish breaker next if there is none, and so on down the list (26:53, 27:20). He is careful to say that any of these may simply not appear in the price action, which is why the instruction is to check the list in order rather than to insist on a particular structure being present (26:15, 26:20).
The premium hierarchy, and the order you actually search in
Above equilibrium he gives the arrays in a stated order of importance, and the first thing he names is old high and old low, which he says is as high as you can get in the premium (18:26, 25:07, 25:14). He then reads the rest of the list downward: a rejection block, which he defines as sitting just above the candle’s body rather than at the wick; then the bearish order block; a fair value gap; a liquidity void; a bearish breaker; and finally the mitigation block (18:55, 19:21).
The important nuance is that this is the order of significance, not the order in which a trader encounters things. Because price starts from wherever it currently is, the search runs upward from equilibrium and therefore hits the bottom of the list first. So if price is at equilibrium, he says the first question is where the nearest mitigation block is; if there is none, check it off and look for the nearest bearish breaker; if there is one, that is a reasonable place to expect a reaction and then selling lower (19:22, 20:07). Only if both are absent does he move to the liquidity void — asking whether there is a range that needs to be closed in — then to the fair value gap, and then to the bearish order block, which he says is probably going to be there (20:11, 20:38).
He gives the geography behind that ordering: the mitigation block is the lowest of the group, the bearish order block is much higher up in the premium, and small bounces inside a bear market are essentially mitigation blocks (20:44, 21:04). Where the bearish order block is absent or unusable — he mentions situations with a lot of wicks — the fallback is a rejection block just above the candle bodies, followed ultimately by a run on the old high (22:39, 23:14).
Why breakers are treated as the dominant array
He reserves his strongest qualification for breakers, and it is worth quoting precisely because it overrides the rest of the list. In his words, whenever you see bearish breakers you should not expect the bearish order block to be hit, because the breaker will most likely keep price lower, and that makes it the most dominant array of the group (21:31, 21:46). He repeats the point in general terms later: if there is a breaker below a liquidity void, the void may simply stay open, and the breaker will take precedence over everything on the list when price is below it (22:03, 26:48). Mechanically he describes a bearish breaker as the down candle right before a second high takes out an old high — the pattern he calls turtle soup — which, when retraded, is a breaker that keeps price from reaching the higher order block (21:08, 21:25).
The discount hierarchy
The discount side is presented as the mirror of the premium side. If price is expected to move lower into discount or support, he says the first array to expect is a mitigation block, then a bullish breaker, then a liquidity void, then a fair value gap, then a bullish order block, then a rejection block, and finally the deepest form of discount, which is an old low or a trade down to a historic high (26:53, 29:25). As on the premium side, his rejection block here is defined relative to the candle bodies: just below the lowest candle and its body, not down at a long wick (29:05, 29:10, 29:14).
He defines the bullish breaker explicitly, which he does not do for every term: it is an up candle between two swing lows where the most recent swing low is the lower of the two, so there is a stop run in the past and the high of the up candle between the lows becomes the breaker level (27:48, 28:11). The consequence he draws is the same rule as on the premium side: if a breaker is present he expects price not to go below it and the void to stay intact, and only if the breaker is overtaken does the void become relevant (28:16, 28:35). Where there is no breaker and no void but there is a gap, he expects price to reach down into the fair value gap — which he defines as a small gap where price has only been delivered on one side of the market — and then into the bullish order block (28:35, 29:01).
He then restates the summary of the whole exercise from a below-premium position: when price is at or above equilibrium and you are looking higher for where it might travel, the order you encounter things in runs from the mitigation block at the bottom of the list up to the old high, while the order of importance runs the other way, with the old high at the top (24:27, 25:29). His summary sentence is that the higher you go up the list, the deeper into a premium market you are, and that certain arrays in it will keep you from reaching the next higher one (25:30, 25:45).
The same hierarchy on monthly, weekly and daily charts
He is explicit that nothing changes across the three higher timeframes. Monthly premium arrays are, in his framing, the areas to sell from or to use as bullish targets, and monthly discount arrays are where he looks for bearish targets or for longs depending on current conditions (29:42, 30:18). He then walks the weekly chart through exactly the same sequence from equilibrium up — mitigation block, bearish breaker, and if a breaker is present price probably will not go higher, otherwise look for a void to close in or a fair value gap, otherwise trade into the bearish order block, and if that is judged not strong, a rejection block above the bodies and then a run above the old high (30:23, 31:10).
For the daily chart he says the same hierarchy exists unchanged: if price is at equilibrium and lower prices are expected, the first things to look for on the left of the chart are mitigation blocks or a bullish breaker, and anything below that breaker will probably not be revisited — with the caveat that breakers hold precedence on both sides (31:18, 31:51). He closes by pointing forward to lesson 6.2, where he says the framework is applied to the dollar-yen example he had briefly mentioned in the lesson-five money-management discussion, and by describing this lesson as the foundation needed to understand that one (10:24, 32:02).
Key takeaway
The transferable procedure is the ordering, not any single array: pick one coherent higher-timeframe range and mark its midpoint, decide whether price is in premium or discount, look left for the nearest applicable array in the direction being considered, and only move down the list when a nearer structure is genuinely absent (18:04, 26:15). The breaker rule is the sharpest practical instruction in the lesson, because it tells the trader where to stop looking (26:48, 31:46).
What the lesson does not do matters as much. It does not redefine most of the arrays it ranks — the terms are carried over from earlier lessons in the mentorship — and it presents no measurements, backtest or performance figures at all. It also says plainly that price can travel part way toward a forecast level and fail, and that the waiting time is unknowable in advance (13:07, 17:00, 17:04). What it offers is a way to prioritise which chart reference to study next, which is a narrower claim than a prediction, and this article treats it that way. Nothing above is investment advice.
Watch the original recording
ICT Mentorship Core Content – Month 05 – Defining HTF PD Arrays
The Inner Circle Trader · published 16 September 2022 · about 32 minutes 12 seconds. This recording is the primary source for every timestamp link above.
The recording is not embedded here because the video owner has disabled playback on other websites. That was tested directly on 15 September 2026 from a BestProps page origin at both desktop and mobile widths: the embedded player frame loads, then reports “Playback on other websites has been disabled by the video owner” with no duration and no playback progress, while the video itself plays normally on YouTube. No empty or half-working player is left on this page.
The watch page was read on 15 September 2026 and is publicly listed as ICT Mentorship Core Content – Month 05 – Defining HTF PD Arrays by The Inner Circle Trader: upload date 16 September 2022, not private and not unlisted, with the player reporting a duration of 1,932 seconds — about 32 minutes 12 seconds. The audio used for this article runs to 1,931.6 seconds, so the transcription and the listed duration agree. The recording identifies itself in its opening seconds as lesson 6.1 of the January 2017 mentorship content, which is the lesson number used in the text above (0:16).
Resources
These are the sources checked for this article. The regulator and investor-education pages are general material about how trading systems and advisory services sold to the public should be assessed, and about short-term trading risk; neither one evaluates this speaker and neither verifies the range construction, equilibrium placement, hierarchy order or breaker precedence described above. Any ICT, smart-money or third-party indicator, script, note set, chart annotation, transcript pack or re-upload circulating outside the publishing channel’s own page is unofficial and has not been tested here.
- [1] ICT Mentorship Core Content – Month 05 – Defining HTF PD Arrays — The Inner Circle Trader (primary source; watch page read 15 September 2026, listed duration 1,932 seconds, about 340,000 views at the time of reading).
- [2] The Inner Circle Trader — official YouTube channel (read 15 September 2026) — the publishing channel for the 2017 mentorship series used here.
- [3] CFTC — Fraud Advisory: Commodity Trading Systems Sold on the Internet (read 15 September 2026) — the regulator’s guidance on assessing trading systems and advisory services sold to the public, including its warning that hypothetical results are typically simulations calculated over past prices.
- [4] Investor.gov (SEC) — Day Trading (read 15 September 2026) — investor education on short-term trading risk, relevant background to a framework that ranks where price may react.
Source: ICT, ICT Mentorship Core Content – Month 05 – Defining HTF PD Arrays, The Inner Circle Trader, 16 September 2022. The transcript used was