
Key takeaways
This recording identifies itself as lesson 4.1, Implementing Macroanalysis, on applying seasonal tendencies to higher-time-frame analysis, and he says it covers the buy side only 0:13, 0:18.
Read the full summary
This recording identifies itself as lesson 4.1, Implementing Macroanalysis, on applying seasonal tendencies to higher-time-frame analysis, and he says it covers the buy side only 0:13, 0:18. Seasonality is presented as a proverbial roadmap of past performance rather than a panacea, and he repeats that repetition in the past does not guarantee the future 1:13, 1:28. The chart he works from is a 40-year seasonal compilation of Canadian dollar futures delivery months, beginning in 1976 and compiled through 2015, with a long-term average plotted against a 15-year average; he reads the small gap between them as a recurring tendency 2:26, 3:56. He identifies roughly March through May and June as the favourable window for the Canadian dollar futures contract, and late September into the run-up to Christmas as the weak one 5:26, 7:10. Because the US dollar is the first name in the USD/CAD pair, he says the futures reading must be inverted: Canadian dollar futures weakness is the bullish case for USD/CAD 6:33, 7:02. He then reviews weekly USD/CAD examples from 2008 onward and is explicit that some years worked and some did not, pointing out that the final two years were trending lower, which he says argues for looking for sells rather than buys 8:07, 8:57, 9:36. He ties the whole exercise to the quarterly shifts he teaches, each of roughly three to four months, and says the seasonal read only helps once a market is already predisposed to move that way 11:39, 12:23. Crude oil is added as a related market, since Canada’s exports are oil-weighted, and he shows a bullish window from about mid-February or March into May and June on the crude futures contract 14:17, 14:28. He also says he lost money trading seasonals early on because he assumed they would work every time and positioned too heavily, and the lesson supplies no entry, stop or sizing model and no verified results.
How we researched this article
BestProps used document-based research from primary firm sources, checked September 17, 2026. The complete source list, scope, limitations, and commercial-state record appear near the end of this article.
What the recording is, and what it says it covers
He opens by naming the material: lesson 4.1, Implementing Macroanalysis, and within it the application of seasonal tendencies to higher-time-frame analysis 0:13. He states up front that this session deals only with the buy side, leaving the bearish side to the following lesson 0:38, and that the market used to open the subject is the Canadian dollar 0:43. A crude oil section follows as supporting material, and he closes by saying the full set of seasonal charts for the currencies is reserved for the bearish module 18:36.
The published video is titled ICT Mentorship Core Content – Month 05 – How To Use Bullish Seasonal Tendencies In HTF Analysis and its watch page lists an upload date of 15 September 2022, while the speaker presents the material as a numbered lesson in a mentorship series. The two dates describe different things — the re-release on the channel and the teaching inside it — and the transcript alone does not establish when the lesson was originally recorded.
The framing: a roadmap, not a guarantee
He introduces seasonal tendencies as a proverbial roadmap of past performance and says plainly that they are not to be viewed as a panacea or a be-all and end-all 1:13. What follows is the caveat he repeats: simply because something has behaved a certain way in the past does not guarantee it will behave that way in the future, and the seasonal read is one more tool adding confluence to reasons a trader may already have for expecting a market to go higher or lower 1:28, 1:39.
He then asks why the material is worth studying at all. His answer is personal: he says that as a new trader he would never have agreed that a market could be inclined to move in a particular direction at a particular time of year because of some underlying influence that repeats, and that seeing measured seasonality gave price a characteristic and convinced him there was a rhyme and reason behind what goes on 3:05, 3:36. That is his stated interpretation of the data, not an independently verified finding.
Reading the 40-year seasonal compilation
The chart he works from is a compilation of Canadian dollar futures price action across all delivery months, covering more than 40 years beginning in 1976, with the dataset itself compiled through 2015 2:26, 2:33. He notes that the series is plotted as a long-term line against a 15-year average, and that the two disagree very little on the strong tendencies for this currency, which is what he takes as evidence of a recurring pattern 3:48, 3:56, 3:59.
Two conventions matter for reading the chart. The horizontal axis mixes two calendars: the calendar months run along the bottom while vertical lines mark where each futures delivery month ends and the next begins 4:40, 4:46. Currencies deliver on the March, June, September and December cycle, so the chart is divided into four contract periods a year 2:13. He also addresses the age of the data directly, saying that if the viewer is worried about deviation in a later year, he can report that the output has hardly changed at all 2:45.
Because this session is about the buy side, he says bearish patterns are being set aside in favour of tendencies that lend themselves to being a buyer 4:11. His reading of the bullish window is roughly March through the May and June period, which he calls a strong tendency for the Canadian dollar to rally 5:26, 5:31. He is careful with what that means: it does not mean the market rallies every single year from March to June, only that there is what he calls a strong probability given the historical record and the comparison against the shorter average 5:58, 6:02.
The inversion: futures reading versus the FX pair
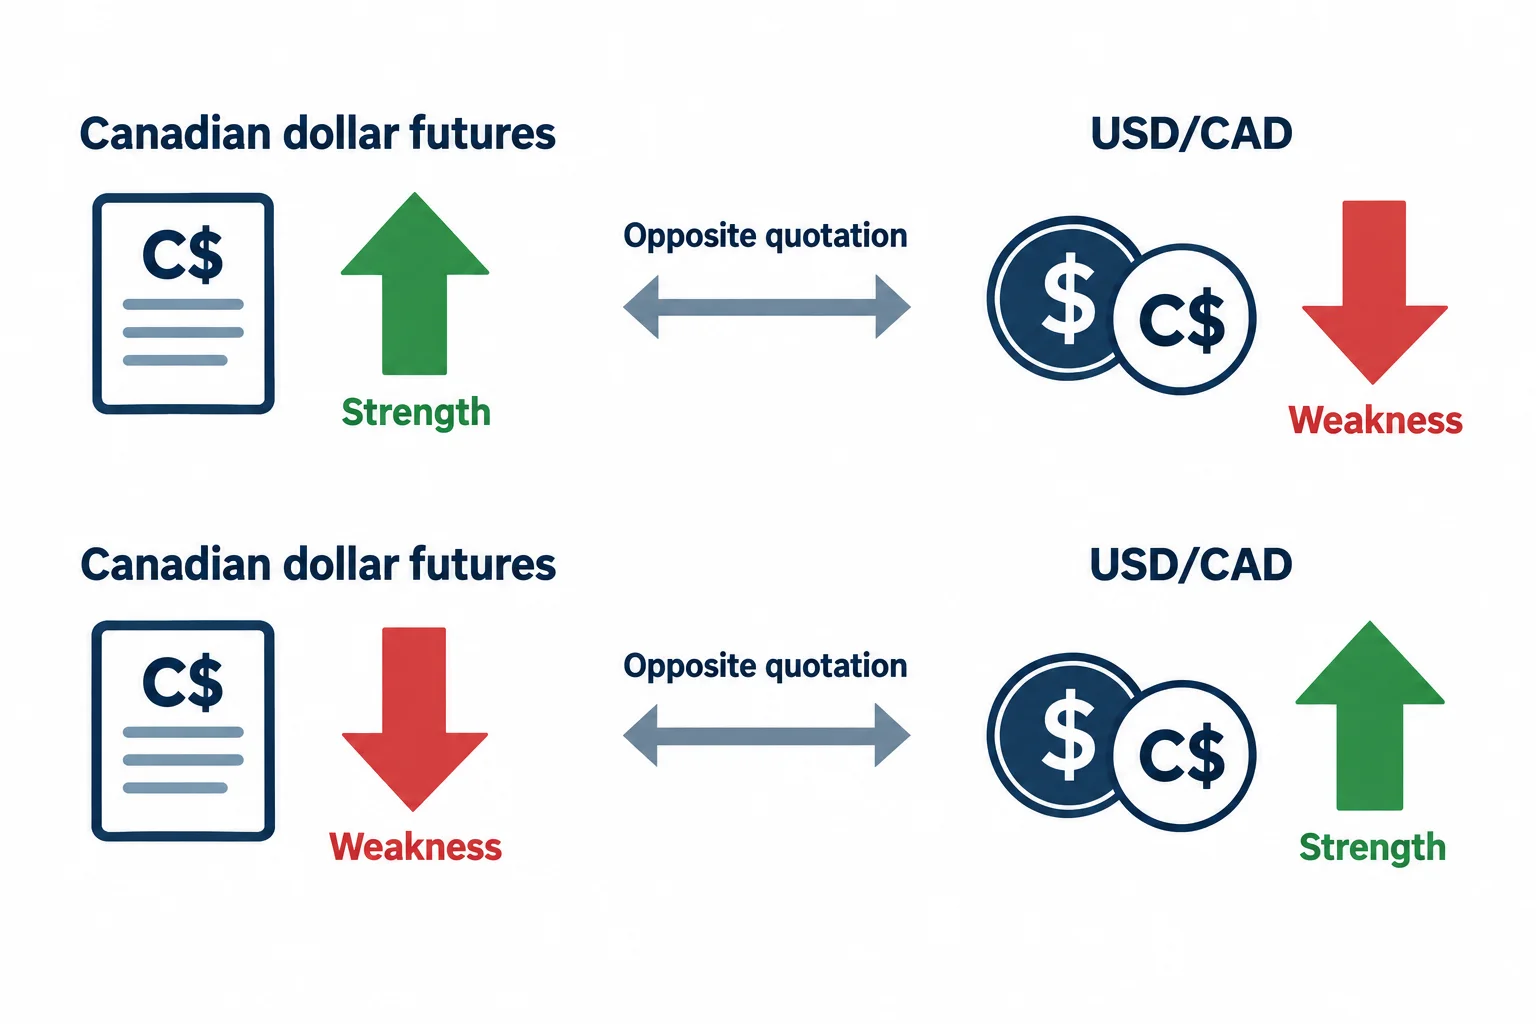
The part of the lesson he emphasises most is the translation step. A seasonal study of the Canadian dollar futures contract describes the contract, not the pair a foreign-exchange trader is buying or selling, and he points out that the US dollar comes first in the USD/CAD quotation 6:33. That ordering makes the two readings oppose each other: bullish Canadian dollars are consistent with the USD/CAD pair falling, and bearish Canadian dollars are consistent with it rising 6:43. His conclusion is that the FX trader has to locate the period that shows weakness in the Canadian dollar futures contract and read it as the buy window for USD/CAD 7:02.
On that basis he identifies roughly September through the period near Christmas as a seasonally weak stretch for the Canadian dollar futures contract, which becomes the potentially bullish window for USD/CAD 7:10, 7:34. He generalises the point beyond this one market: several of the majors are quoted with the US dollar first, so the futures reading has to be reversed for them too 11:26.
One term in this passage needs a flag rather than a quote. The automatic transcription renders his description of the pair’s naming convention in a way that reads as the US dollar index being the first element of the pair, which is not how a pair quotation works and is almost certainly a misrecognition of him saying the US dollar is the first name in the pair. The article therefore states the mechanism and notes the ambiguity instead of reproducing the phrase.
The weekly USD/CAD examples, including the ones that failed
He moves to a weekly USD/CAD chart with history going back to 2008, and shades the window from the start of September out to about mid-December to mark where the inverted seasonal read would look for strength in the pair 7:57, 8:07, 8:17. His first example is a strong advance in that window, and he asks the viewer to note how many pips it moved 8:48, 8:54. He then walks forward year by year: the following year he describes as a period where the seasonal window produced only a modest rally with the overall direction still lower, the year after that as lower again, and he asks the viewer to judge whether the last two years had been trending up or down before asking which side they would rather be looking for 8:57, 9:04, 9:29, 9:36.
The later examples return to agreement with the window: he points out a 2011 basing low followed by a shift in market structure, and describes institutional order flow turning bullish at a time of year when the futures contract would seasonally be weak, which is the bullish case for the pair 9:58, 10:03, 10:08. He then counts successive years where price rallied in the same stretch of the calendar, through 2016 10:29, 10:40, 10:50, 10:59.
He is explicit that this evidence base is selective. He says he deliberately stopped the chart where he did because showing more would give away discoveries the viewer should make by studying it themselves, and he invites the viewer to check how often the underlying market moves line up with the macro trend 13:07, 13:15. The years he points at are also described rather than documented: there are no fills, no entry or exit records and no stated sizes, so the examples show that the seasonal window and the direction sometimes agreed, not that a strategy built on it was profitable.
Why the seasonal window needs a predisposed market
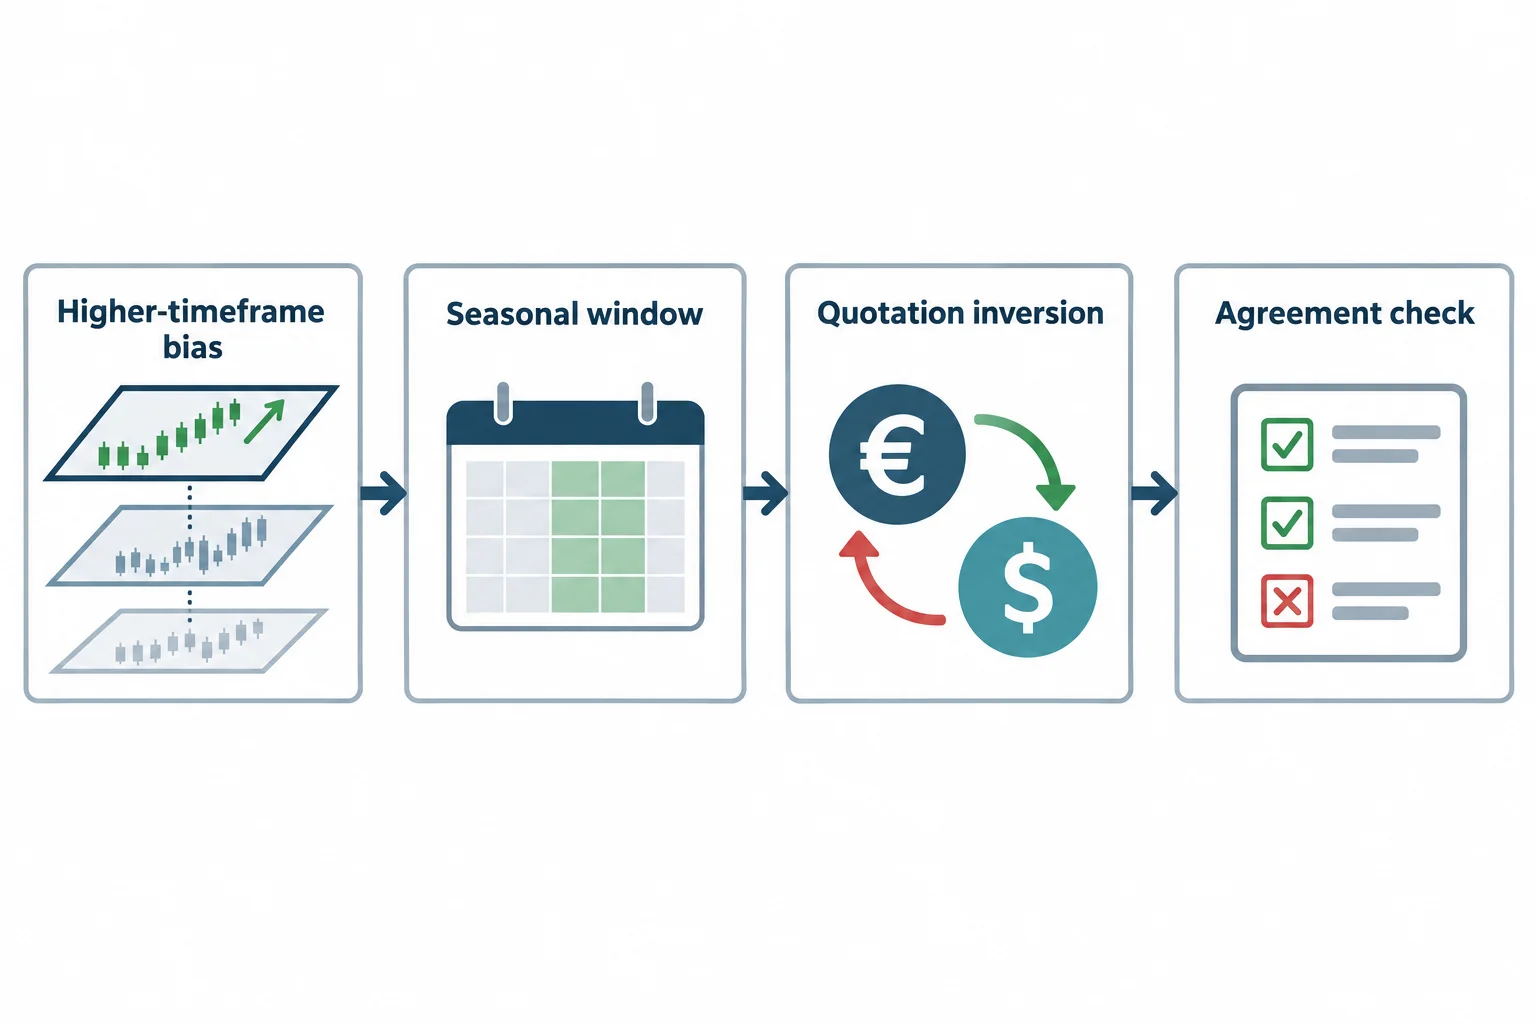
This is the rule he leans on to convert the seasonal study into something usable. He says the seasonal read by itself does not mean anything, and that it is meant to be combined with the quarterly shifts he has taught elsewhere — higher-time-frame moves he describes as developing over roughly three to four months 11:33, 11:39, 11:48. His question is not only whether a shift is due, but which direction it should be expected in, and the seasonal tendency is what he uses to help build that idea 12:03.
Stated as a sequence, his order of work is: establish that the market is already predisposed to move higher on the higher time frame, identify the seasonal window that historically favours that direction, apply the inversion when the traded quote differs from the futures contract, and act only when those agree 12:23, 12:31, 12:54. He sums the same idea up in a line worth quoting for its honesty about what it is: seasonality is a way of identifying quarters that historically favour buying or selling, and the difference in any given year is whether the market is already leaning that way 12:18. The window is a filter on where to look, not a trigger on its own.
He also notes the counter-intuitive finding he emphasises for this particular currency: the seasonal chart shows a tendency for the Canadian dollar futures contract to decline from September into late December, which is a stretch many traders would not expect to be the favourable one for the inverted pair 7:10, 7:34. That inversion is why he says he chose this market to teach the concept 11:15.
Crude oil as a related market
He brings in crude oil next, describing it as closely related to the Canadian dollar because Canada’s number one export is oil, and presenting it as a supporting idea rather than an independent signal 13:57, 14:00, 14:05. He reads a bullish window in the crude oil market running from about mid-February into March and carrying through the May and June period, and notes that the Canadian dollar generally moves almost in tandem with oil 14:17, 14:28. Combined, that gives him a broadly bullish March-to-June effect across both markets, which he says has to be reversed again when it is applied to the FX pair 14:50, 14:55.
The crude example is a weekly chart taken back to January 2014, and he describes the market as sitting in a long-term downtrend following what he calls the collapse from around the 105 level 15:21, 15:26, 15:33. Against that backdrop he points to advances in the March-to-June window across successive years, including 2016, and argues that rallies occurred in the seasonal window even inside a bear market; he adds immediately that they do not force trades 15:43, 15:47, 16:03, 16:27. The 105 level is his spoken reference to the chart in front of him, not a level this article has verified, and the rally dates are illustrations rather than documented trades.
His own experience with seasonals, and what the lesson leaves out
Near the end he describes how he came to the material. He says the seasonal charts felt like treasure maps when he was in his twenties, that he set them aside for a couple of months before studying them properly, and that he lost money trading them at first because he assumed they would work every time and responded by loading up the position and trading too many markets and too many times 16:44, 16:57, 17:08, 17:15. He says he put the subject aside until he understood the quarterly shift, and that he can now pick out the higher-probability seasonal windows for particular times of year 17:24.
That account is the closest thing in the recording to a risk warning, and it is worth stating what it is not. There is no described stop-loss rule, no position-sizing method, no account risk limit, no maximum attempt count, no transaction-cost discussion and no verified track record anywhere in the lesson. His strongest claim is that focusing on the quarters with the strongest tendencies in a given market gives what he calls a loaded deal in the form of odds, immediately followed by the statement that it does not mean the result will be profitable every time or accurate as a guarantee 17:34, 17:47, 17:52, 17:58. The article records that as his opinion and does not present the seasonal windows as an edge.
He closes by saying the bearish side and the full set of seasonal charts for the currencies are reserved for the next module 18:34, 18:36. Nothing here is investment advice, and the correlation he describes between the Canadian dollar and crude oil is a stated relationship he uses for context, not a fixed link that has to hold in any given year.
Watch the original recording
ICT Mentorship Core Content – Month 05 – How To Use Bullish Seasonal Tendencies In HTF Analysis
The Inner Circle Trader · watch page lists upload 15 September 2022 · about 18 minutes 45 seconds. The speaker opens the recording as lesson 4.1, Implementing Macroanalysis. This recording is the primary source for every timestamp link above.
The recording is not embedded here because the video owner has disabled playback on other websites. The embed was tested directly on 17 September 2026 by loading the embed URL itself at desktop (1440 by 900) and mobile (390 by 844) widths: the player loads and then reports a video player configuration error carrying error code 153 with a prompt to watch the video on YouTube, with no duration and no playback progress, while the video itself plays normally on YouTube. No half-working player is left on this page.
The watch page was read on 15 September 2026 and is publicly listed as ICT Mentorship Core Content – Month 05 – How To Use Bullish Seasonal Tendencies In HTF Analysis by The Inner Circle Trader, upload date 15 September 2022, not private and not unlisted, with a listed duration of 1,125 seconds — about 18 minutes 45 seconds, against a transcribed audio duration of 1,124.4 seconds.
A note on the transcription
There was no usable caption track for this recording, so the transcript behind this article is an automatic speech-recognition pass over the full original audio, not human-verified captions and not YouTube’s own captions. The pass covered the complete audio and reported no low-confidence stretches, but a machine transcript still mishears terms, and one term is flagged in the text above rather than quoted. Currency references are rendered in the audio pass as forms such as “US CAD” where the speaker means the USD/CAD pair, futures references appear as plain “Canadian dollar” without the word futures in places, and a reference to institutional order flow reads as “institutional overflow” 10:08. Month and window labels come from his spoken words and are reported as such. Nothing in this article is taken from anywhere other than the spoken content of this recording, and this review did not view the recording’s charts: the chart constructions, the two plotted averages and the historical price paths are described from what he says about them.
Resources
These are the sources checked while preparing this article. The regulator and market pages are general material about how trading systems and seasonality-based claims should be assessed; none of them evaluates this speaker, verifies the seasonal data behind the 1976 to 2015 compilation, the March-to-June or September-to-December windows, the inversion argument or the crude oil correlation described above, and none endorses anything said in the recording. Any ICT, smart-money or third-party indicator, script, note set, chart annotation, transcript pack or re-upload circulating outside the publishing channel’s own page is unofficial and has not been tested here.
- [1] ICT Mentorship Core Content – Month 05 – How To Use Bullish Seasonal Tendencies In HTF Analysis — The Inner Circle Trader (primary source; watch page read 15 September 2026, listed duration 1,125 seconds).
- [2] The Inner Circle Trader — official YouTube channel (read 15 September 2026) — the publishing channel for the mentorship series used here.
- [3] CFTC — Fraud Advisory: Commodity Trading Systems Sold on the Internet (read 15 September 2026) — explains that hypothetical trading results are typically simulations calculated over historical price data, and that technical analysis attempts to predict future price movements based on historical prices and price relationships.
- [4] CFTC — Commitments of Traders reports (read 15 September 2026) — the official weekly position data for futures markets, relevant background because the lesson’s seasonal tendency charts are themselves compilations of futures market data.
Source: ICT, ICT Mentorship Core Content – Month 05 – How To Use Bullish Seasonal Tendencies In HTF Analysis, The Inner Circle Trader, watch page upload date 15 September 2022; the recording identifies itself as lesson 4.1. Local automatic speech recognition of the full original audio was the transcript used for this article, and it is not human-verified captions. This commentary is educational and is not investment advice.